
UFP Industries (UFPI)
UFP Industries is in for a bumpy ride. Its weak sales growth and declining returns on capital show its demand and profits are shrinking.― StockStory Analyst Team
1. News


2. Summary
Why We Think UFP Industries Will Underperform
Beginning as a lumber supplier in the 1950s, UFP Industries (NASDAQ:UFPI) is a holding company making building materials for the construction, retail, and industrial sectors.
- Sales tumbled by 6.4% annually over the last two years, showing market trends are working against its favor during this cycle
- Earnings per share decreased by more than its revenue over the last two years, showing each sale was less profitable
- Estimated sales for the next 12 months are flat and imply a softer demand environment


UFP Industries falls short of our expectations. There are superior stocks for sale in the market.
Why There Are Better Opportunities Than UFP Industries


UFP Industries’s stock price of $89.70 implies a valuation ratio of 16.8x forward P/E. This multiple is cheaper than most industrials peers, but we think this is justified.
Cheap stocks can look like a great deal at first glance, but they can be value traps. They often have less earnings power, meaning there is more reliance on a re-rating to generate good returns - an unlikely scenario for low-quality companies.
3. UFP Industries (UFPI) Research Report: Q4 CY2025 Update
Building materials manufacturer UFP Industries (NASDAQ:UFPI) fell short of the market’s revenue expectations in Q4 CY2025, with sales falling 9% year on year to $1.33 billion. Its GAAP profit of $0.70 per share was 34% below analysts’ consensus estimates.
UFP Industries (UFPI) Q4 CY2025 Highlights:
- Revenue: $1.33 billion vs analyst estimates of $1.4 billion (9% year-on-year decline, 5% miss)
- EPS (GAAP): $0.70 vs analyst expectations of $1.06 (34% miss)
- Adjusted EBITDA: $107.2 million vs analyst estimates of $116.8 million (8.1% margin, 8.2% miss)
- Operating Margin: 4.4%, in line with the same quarter last year
- Free Cash Flow Margin: 6.2%, similar to the same quarter last year
- Market Capitalization: $6.39 billion
Company Overview
Beginning as a lumber supplier in the 1950s, UFP Industries (NASDAQ:UFPI) is a holding company making building materials for the construction, retail, and industrial sectors.
Headquartered in Grand Rapids, Michigan, UFP Industries has established itself as a significant player in the wood products industry. The company supplies products primarily manufactured from wood and other materials to the U.S., Mexico, Canada, Europe, Asia, and Australia.
UFP Industries operates through three business segments: UFP Retail Solutions, UFP Industrial, and UFP Construction.
UFP Retail Solutions serves national home center retailers, retail-oriented regional lumberyards, and contractor-oriented lumberyards. The company supplies these customers from multiple locations, offering a mix of dimensional lumber (both preserved and unpreserved). The UFP Industrial segment caters to manufacturers and agricultural customers who use pallets, specialty crates, wooden boxes, and other containers for packaging, shipping, and material handling purposes. UFP Construction serves four primary markets: factory-built housing, site-built residential construction, commercial construction, and concrete forming.
4. Building Materials
Traditionally, building materials companies have built competitive advantages with economies of scale, brand recognition, and strong relationships with builders and contractors. More recently, advances to address labor availability and job site productivity have spurred innovation. Additionally, companies in the space that can produce more energy-efficient materials have opportunities to take share. However, these companies are at the whim of construction volumes, which tend to be cyclical and can be impacted heavily by economic factors such as interest rates. Additionally, the costs of raw materials can be driven by a myriad of worldwide factors and greatly influence the profitability of building materials companies.
Other companies that manufacture wood building products include Boise Cascade (NYSE:BCC), Weyerhaeuser (NYSE:WY), and Louisiana-Pacific Corporation (NYSE:LPX)
5. Revenue Growth
A company’s long-term performance is an indicator of its overall quality. Even a bad business can shine for one or two quarters, but a top-tier one grows for years. Regrettably, UFP Industries’s sales grew at a sluggish 4.2% compounded annual growth rate over the last five years. This was below our standard for the industrials sector and is a poor baseline for our analysis.
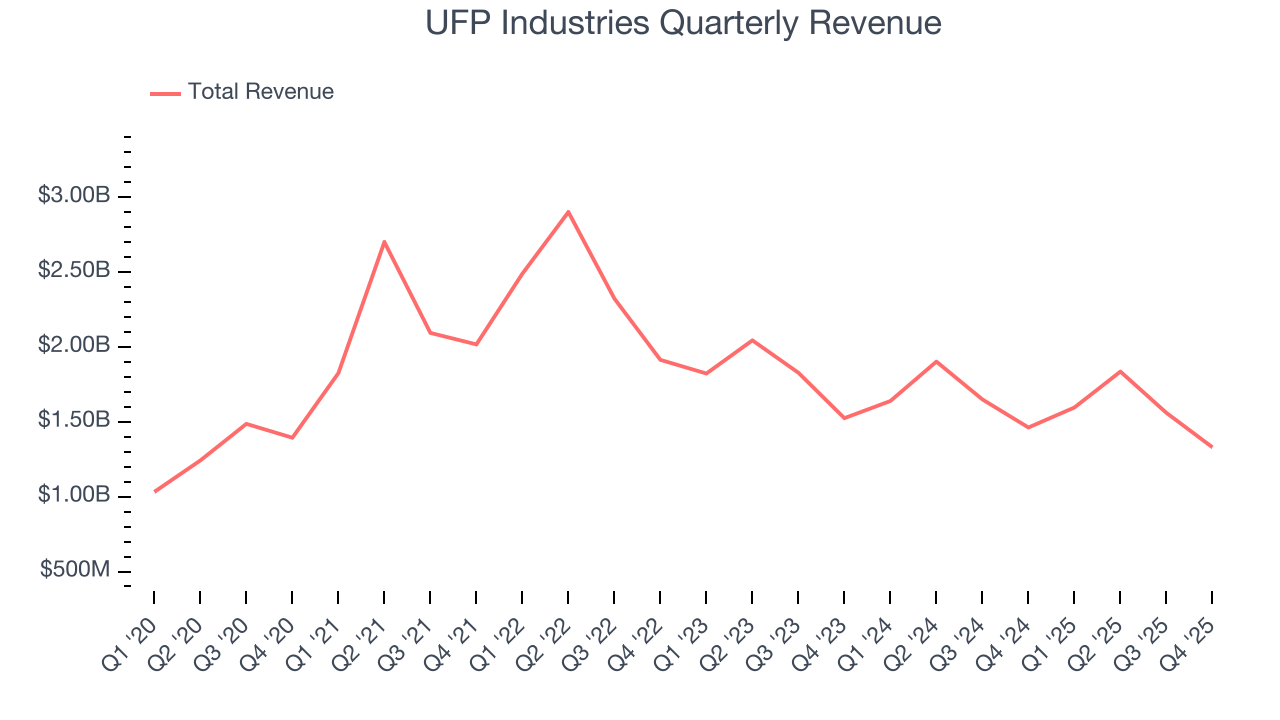
Long-term growth is the most important, but within industrials, a half-decade historical view may miss new industry trends or demand cycles. UFP Industries’s performance shows it grew in the past but relinquished its gains over the last two years, as its revenue fell by 6.4% annually. 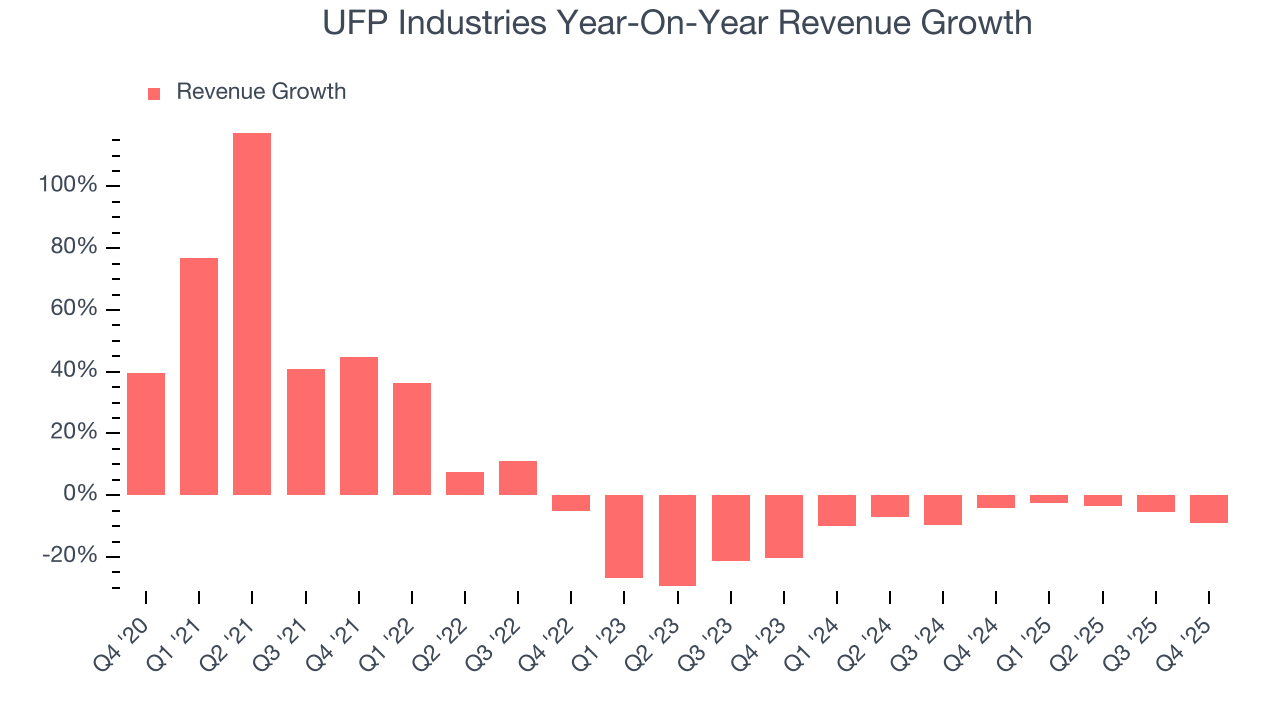
This quarter, UFP Industries missed Wall Street’s estimates and reported a rather uninspiring 9% year-on-year revenue decline, generating $1.33 billion of revenue.
Looking ahead, sell-side analysts expect revenue to grow 2.9% over the next 12 months. Although this projection indicates its newer products and services will fuel better top-line performance, it is still below the sector average.
6. Gross Margin & Pricing Power
All else equal, we prefer higher gross margins because they make it easier to generate more operating profits and indicate that a company commands pricing power by offering more differentiated products.
UFP Industries has bad unit economics for an industrials business, signaling it operates in a competitive market. As you can see below, it averaged a 17.9% gross margin over the last five years. That means UFP Industries paid its suppliers a lot of money ($82.05 for every $100 in revenue) to run its business. 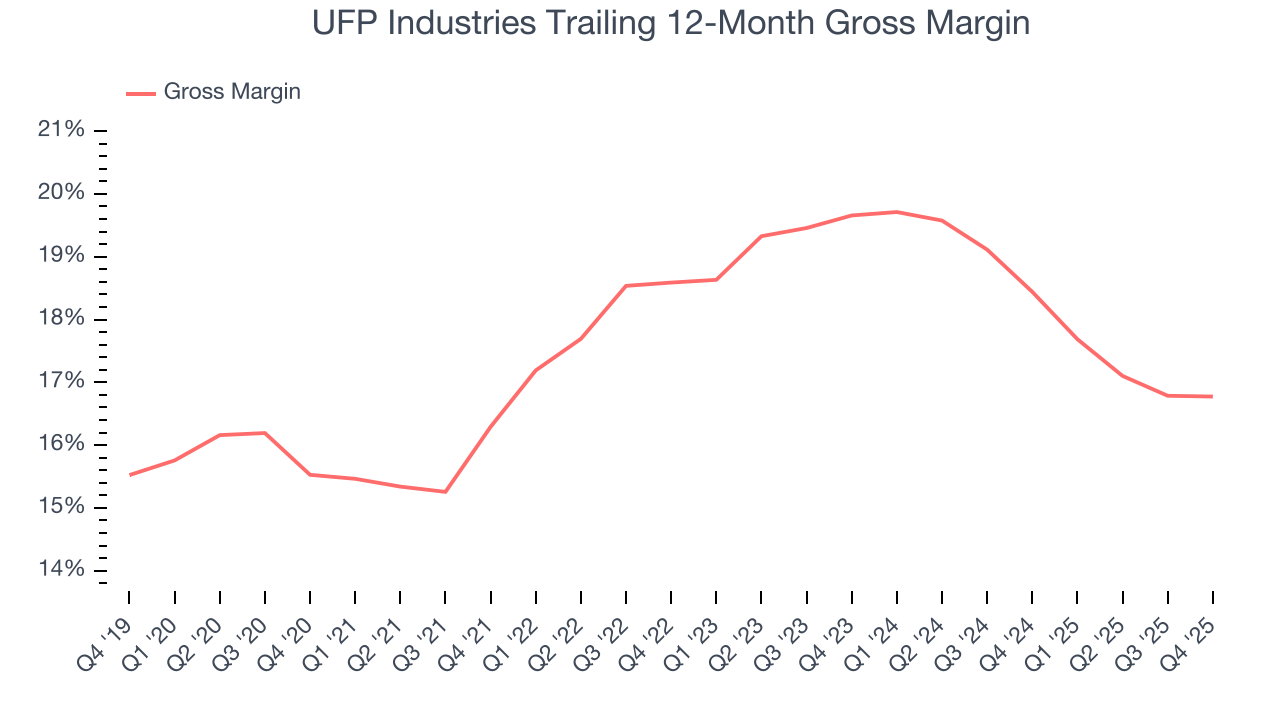
In Q4, UFP Industries produced a 16.3% gross profit margin, in line with the same quarter last year. On a wider time horizon, UFP Industries’s full-year margin has been trending down over the past 12 months, decreasing by 1.7 percentage points. If this move continues, it could suggest a more competitive environment with some pressure to lower prices and higher input costs (such as raw materials and manufacturing expenses).
7. Operating Margin
UFP Industries has done a decent job managing its cost base over the last five years. The company has produced an average operating margin of 8.3%, higher than the broader industrials sector.
Analyzing the trend in its profitability, UFP Industries’s operating margin decreased by 2.8 percentage points over the last five years. This raises questions about the company’s expense base because its revenue growth should have given it leverage on its fixed costs, resulting in better economies of scale and profitability.
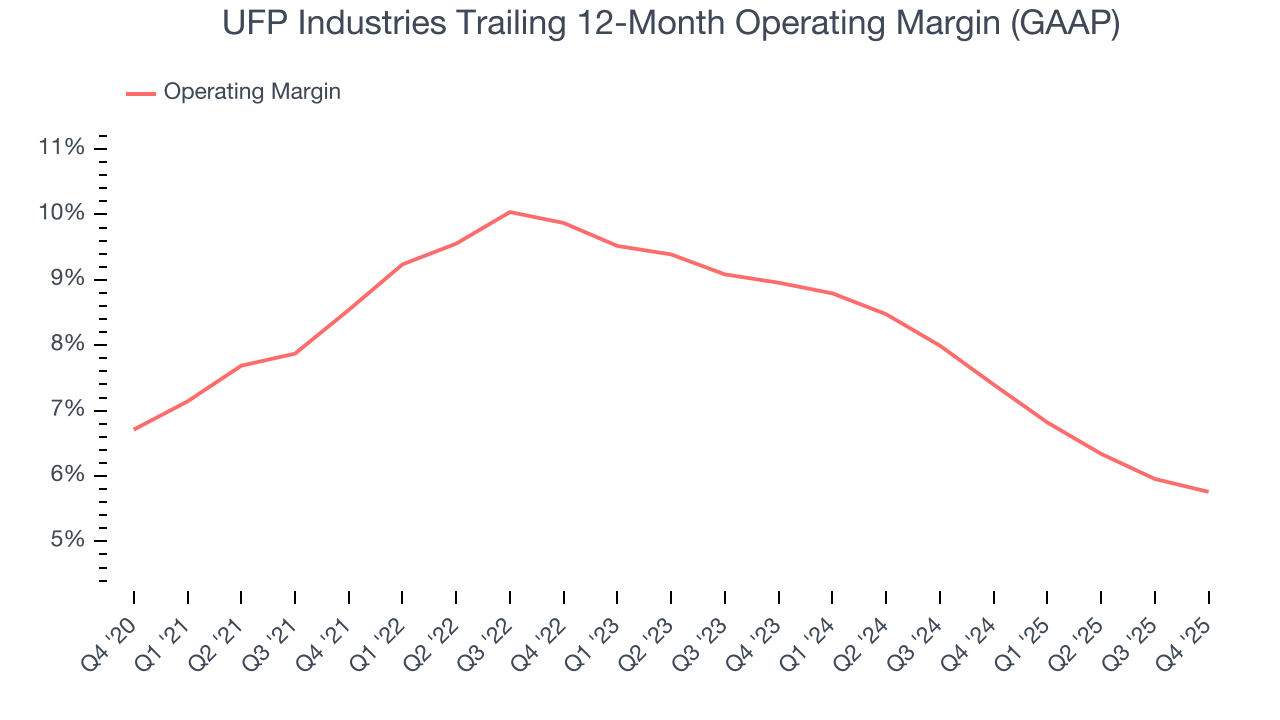
This quarter, UFP Industries generated an operating margin profit margin of 4.4%, in line with the same quarter last year. This indicates the company’s cost structure has recently been stable.
8. Earnings Per Share
We track the long-term change in earnings per share (EPS) for the same reason as long-term revenue growth. Compared to revenue, however, EPS highlights whether a company’s growth is profitable.
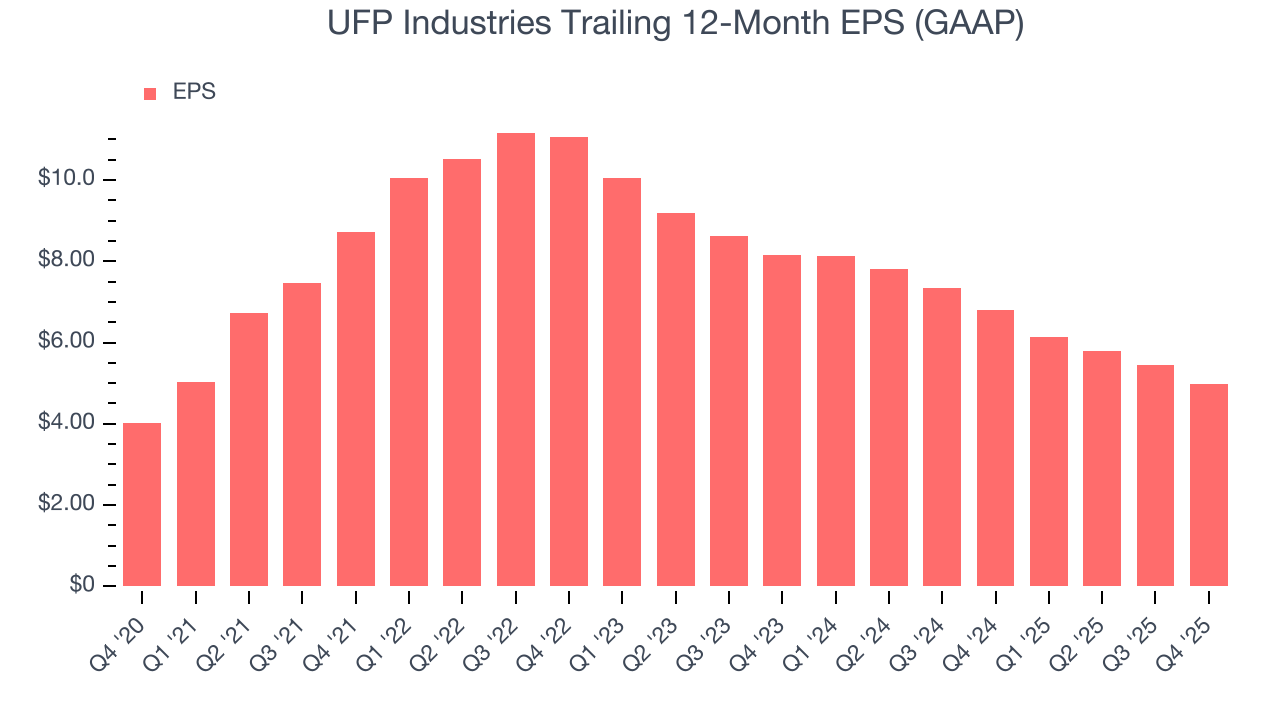
UFP Industries’s unimpressive 4.4% annual EPS growth over the last five years aligns with its revenue performance. This tells us it maintained its per-share profitability as it expanded.
Like with revenue, we analyze EPS over a more recent period because it can provide insight into an emerging theme or development for the business.
UFP Industries’s two-year annual EPS declines of 21.9% were bad and lower than its two-year revenue losses.
We can take a deeper look into UFP Industries’s earnings to better understand the drivers of its performance. While we mentioned earlier that UFP Industries’s operating margin was flat this quarter, a two-year view shows its margin has declined. This was the most relevant factor (aside from the revenue impact) behind its lower earnings; interest expenses and taxes can also affect EPS but don’t tell us as much about a company’s fundamentals.
In Q4, UFP Industries reported EPS of $0.70, down from $1.16 in the same quarter last year. This print missed analysts’ estimates. Over the next 12 months, Wall Street expects UFP Industries’s full-year EPS of $4.98 to grow 17.3%.
9. Cash Is King
Although earnings are undoubtedly valuable for assessing company performance, we believe cash is king because you can’t use accounting profits to pay the bills.
UFP Industries has shown decent cash profitability, giving it some flexibility to reinvest or return capital to investors. The company’s free cash flow margin averaged 6.5% over the last five years, slightly better than the broader industrials sector.
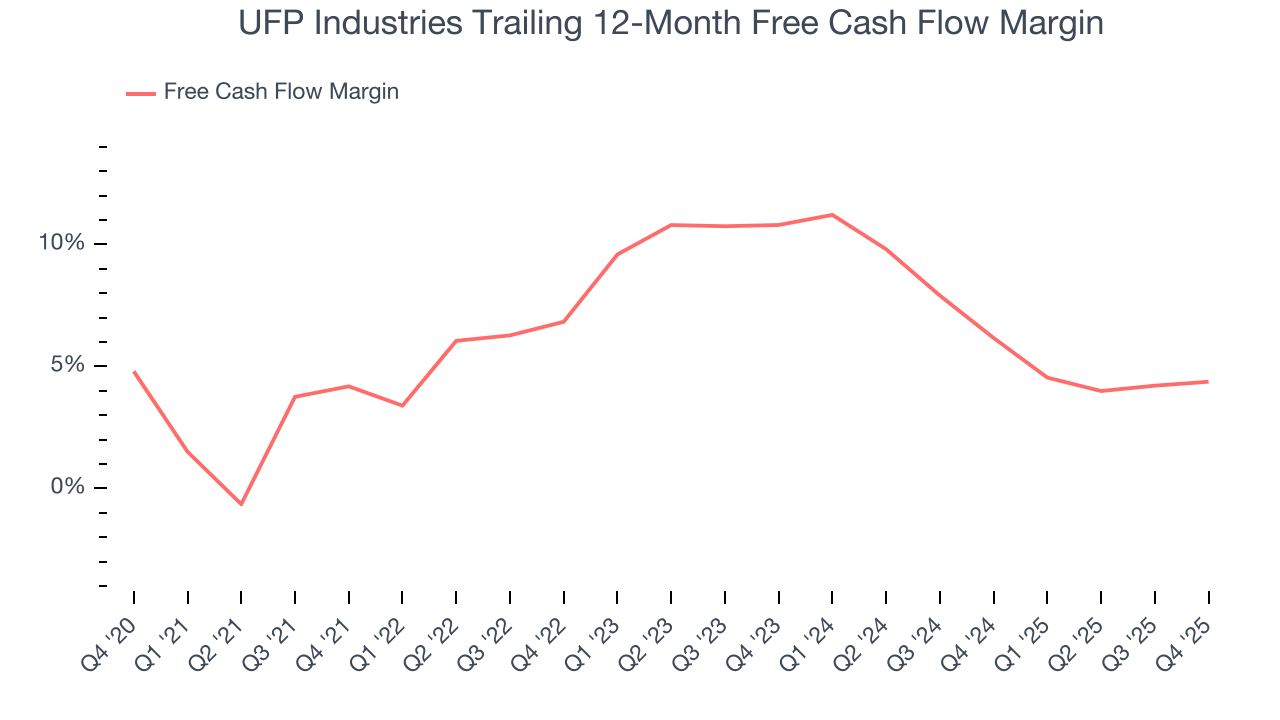
UFP Industries’s free cash flow clocked in at $82.74 million in Q4, equivalent to a 6.2% margin. This cash profitability was in line with the comparable period last year and its five-year average.
10. Return on Invested Capital (ROIC)
EPS and free cash flow tell us whether a company was profitable while growing its revenue. But was it capital-efficient? Enter ROIC, a metric showing how much operating profit a company generates relative to the money it has raised (debt and equity).
Although UFP Industries hasn’t been the highest-quality company lately because of its poor revenue and EPS performance, it found a few growth initiatives in the past that worked out wonderfully. Its five-year average ROIC was 21.2%, splendid for an industrials business.
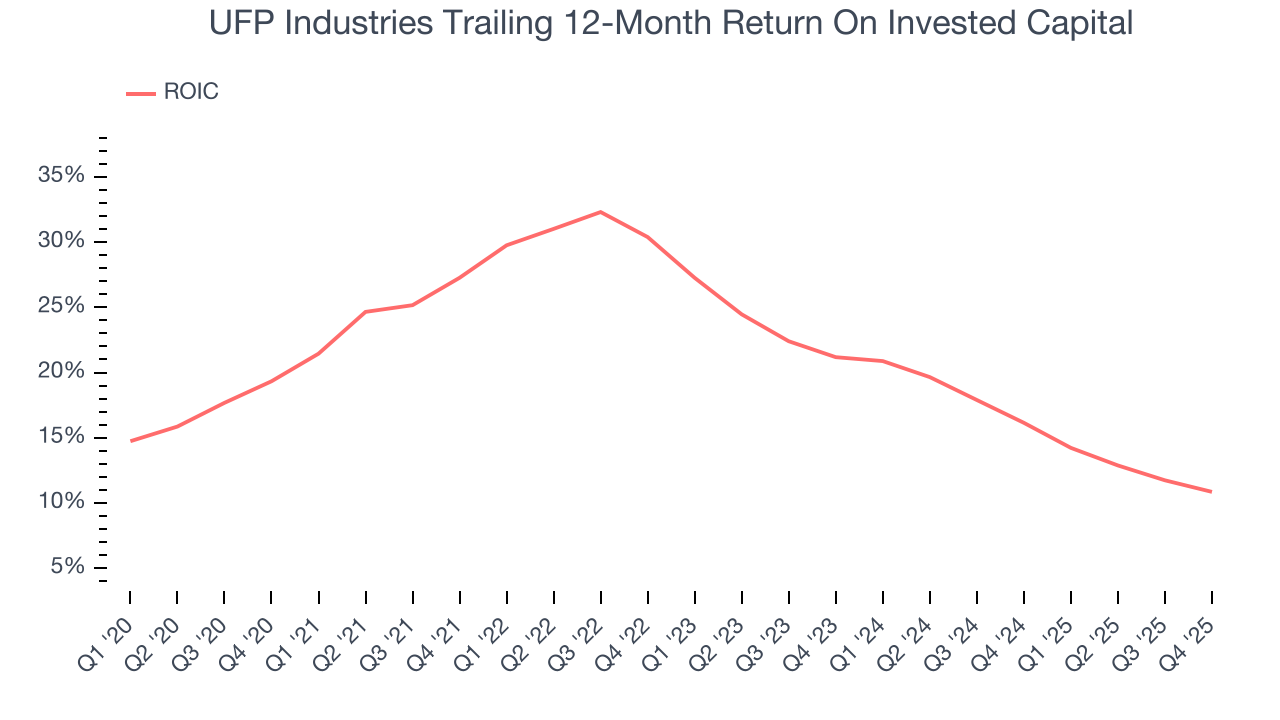
We like to invest in businesses with high returns, but the trend in a company’s ROIC is what often surprises the market and moves the stock price. Unfortunately, UFP Industries’s ROIC has decreased significantly over the last few years. We like what management has done in the past, but its declining returns are perhaps a symptom of fewer profitable growth opportunities.
11. Balance Sheet Assessment
One of the best ways to mitigate bankruptcy risk is to hold more cash than debt.
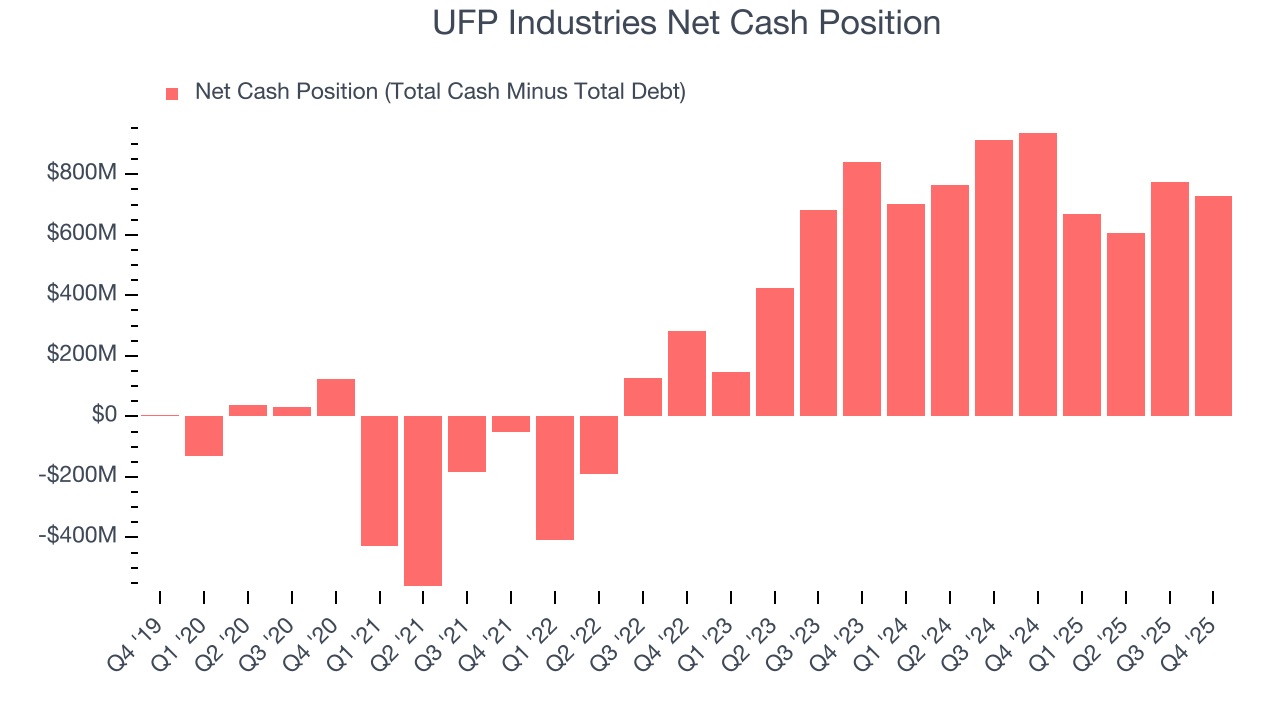
UFP Industries is a profitable, well-capitalized company with $959.4 million of cash and $229.8 million of debt on its balance sheet. This $729.7 million net cash position is 11.4% of its market cap and gives it the freedom to borrow money, return capital to shareholders, or invest in growth initiatives. Leverage is not an issue here.
12. Key Takeaways from UFP Industries’s Q4 Results
We struggled to find many positives in these results. Its revenue missed and its EBITDA fell short of Wall Street’s estimates. Overall, this quarter could have been better. The stock remained flat at $106.27 immediately after reporting.
13. Is Now The Time To Buy UFP Industries?
Updated: March 16, 2026 at 11:41 PM EDT
Before investing in or passing on UFP Industries, we urge you to understand the company’s business quality (or lack thereof), valuation, and the latest quarterly results - in that order.
UFP Industries falls short of our quality standards. First off, its revenue growth was uninspiring over the last five years, and analysts expect its demand to deteriorate over the next 12 months. While its stellar ROIC suggests it has been a well-run company historically, the downside is its diminishing returns show management's prior bets haven't worked out. On top of that, its low gross margins indicate some combination of competitive pressures and high production costs.
UFP Industries’s P/E ratio based on the next 12 months is 16.8x. While this valuation is fair, the upside isn’t great compared to the potential downside. There are superior stocks to buy right now.
Wall Street analysts have a consensus one-year price target of $111.80 on the company (compared to the current share price of $89.81).
Although the price target is bullish, readers should exercise caution because analysts tend to be overly optimistic. The firms they work for, often big banks, have relationships with companies that extend into fundraising, M&A advisory, and other rewarding business lines. As a result, they typically hesitate to say bad things for fear they will lose out. We at StockStory do not suffer from such conflicts of interest, so we’ll always tell it like it is.