
Gap (GAP)
We aren’t fans of Gap. Not only are its sales cratering but also its low returns on capital suggest it struggles to generate profits.― StockStory Analyst Team
1. News


2. Summary
Why We Think Gap Will Underperform
Operating under the Gap, Old Navy, Banana Republic, and Athleta brands, Gap (NYSE:GAP) is an apparel and accessories retailer selling casual clothing to men, women, and children.
- Sales stagnated over the last three years and signal the need for new growth strategies
- Low returns on capital reflect management’s struggle to allocate funds effectively
- A consolation is that its earnings per share have outperformed its peers over the last three years, increasing by 94.6% annually


Gap is in the penalty box. We’ve identified better opportunities elsewhere.
Why There Are Better Opportunities Than Gap


At $24.51 per share, Gap trades at 10.4x forward P/E. We acknowledge that the current valuation is justified, but we’re passing on this stock for the time being.
There are stocks out there featuring similar valuation multiples with better fundamentals. We prefer to invest in those.
3. Gap (GAP) Research Report: Q4 CY2025 Update
Clothing and accessories retailer Gap (NYSE:GAP) met Wall Street’s revenue expectations in Q4 CY2025, with sales up 2.1% year on year to $4.24 billion. On the other hand, next quarter’s revenue guidance of $3.51 billion was less impressive, coming in 0.5% below analysts’ estimates. Its GAAP profit of $0.45 per share was in line with analysts’ consensus estimates.
Gap (GAP) Q4 CY2025 Highlights:
- Revenue: $4.24 billion vs analyst estimates of $4.24 billion (2.1% year-on-year growth, in line)
- EPS (GAAP): $0.45 vs analyst estimates of $0.45 (in line)
- Adjusted EBITDA: $357 million vs analyst estimates of $336.2 million (8.4% margin, 6.2% beat)
- Revenue Guidance for Q1 CY2026 is $3.51 billion at the midpoint, below analyst estimates of $3.53 billion
- Operating Margin: 5.4%, in line with the same quarter last year
- Free Cash Flow Margin: 12.8%, similar to the same quarter last year
- Same-Store Sales rose 3% year on year, in line with the same quarter last year
- Market Capitalization: $10.32 billion
Company Overview
Operating under the Gap, Old Navy, Banana Republic, and Athleta brands, Gap (NYSE:GAP) is an apparel and accessories retailer selling casual clothing to men, women, and children.
The core customer is therefore broad, and the aesthetic is a mix of timeless and trendy Americana. For example, Gap has always been a good place to find a classic pair of khakis for work. It can also be a destination for a jacket that is a bit more trendy and fashion-forward. Prices tend to be towards the affordable end of the spectrum, with frequent sales further enticing customers.
Old Navy features the lowest prices and is the most casual in style. Banana Republic is the most upscale and this is reflected in its prices. The Gap brand sits in the middle regarding price and style. Athleta, acquired in 2008, offers women’s athleisure clothing such as yoga pants and sports bras.
Gap’s stores, regardless of brand, are roughly 5,000 square feet and located in malls or shopping centers. They are organized in a similar manner to other clothing retailers, with sections for men, women, and children as well as centralized displays for promoted or seasonal items. Gap has an e-commerce presence for each of its brands that gives customers various shopping options.
4. Apparel Retailer
Apparel sales are not driven so much by personal needs but by seasons, trends, and innovation, and over the last few decades, the category has shifted meaningfully online. Retailers that once only had brick-and-mortar stores are responding with omnichannel presences. The online shopping experience continues to improve and retail foot traffic in places like shopping malls continues to stall, so the evolution of clothing sellers marches on.
Retailers offering casual yet trendy apparel for men, women, and children include H&M (OM:HMB), Inditex (BME:ITX) which owns Zara, Abercrombie & Fitch (NYSE:ANF), and American Eagle Outfitters (NYSE:AEO).
5. Revenue Growth
A company’s long-term sales performance is one signal of its overall quality. Any business can put up a good quarter or two, but many enduring ones grow for years.
With $15.37 billion in revenue over the past 12 months, Gap is one of the larger companies in the consumer retail industry and benefits from a well-known brand that influences purchasing decisions. However, its scale is a double-edged sword because there is only so much real estate to build new stores, placing a ceiling on its growth. To accelerate sales, Gap likely needs to optimize its pricing or lean into international expansion.
As you can see below, Gap struggled to increase demand as its $15.37 billion of sales for the trailing 12 months was close to its revenue three years ago. This was mainly because it didn’t open many new stores.
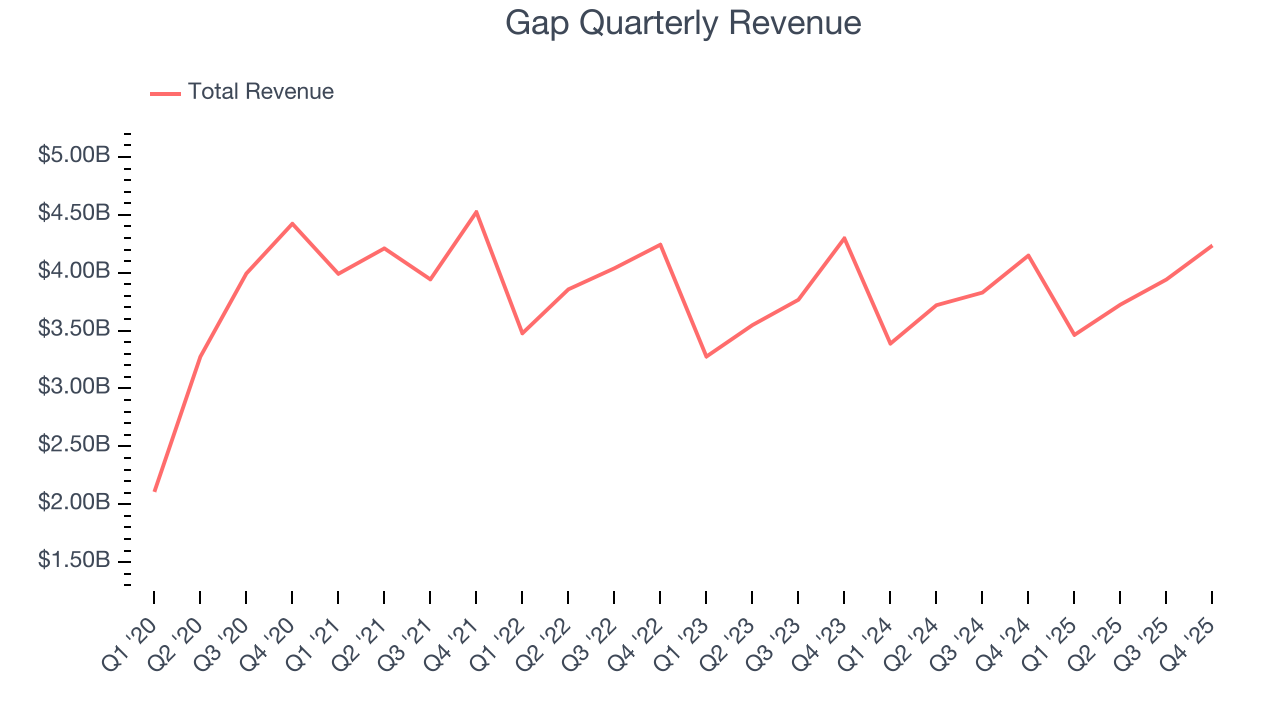
This quarter, Gap grew its revenue by 2.1% year on year, and its $4.24 billion of revenue was in line with Wall Street’s estimates. Company management is currently guiding for a 1.5% year-on-year increase in sales next quarter.
Looking further ahead, sell-side analysts expect revenue to grow 2.6% over the next 12 months. Although this projection suggests its newer products will spur better top-line performance, it is still below average for the sector.
6. Store Performance
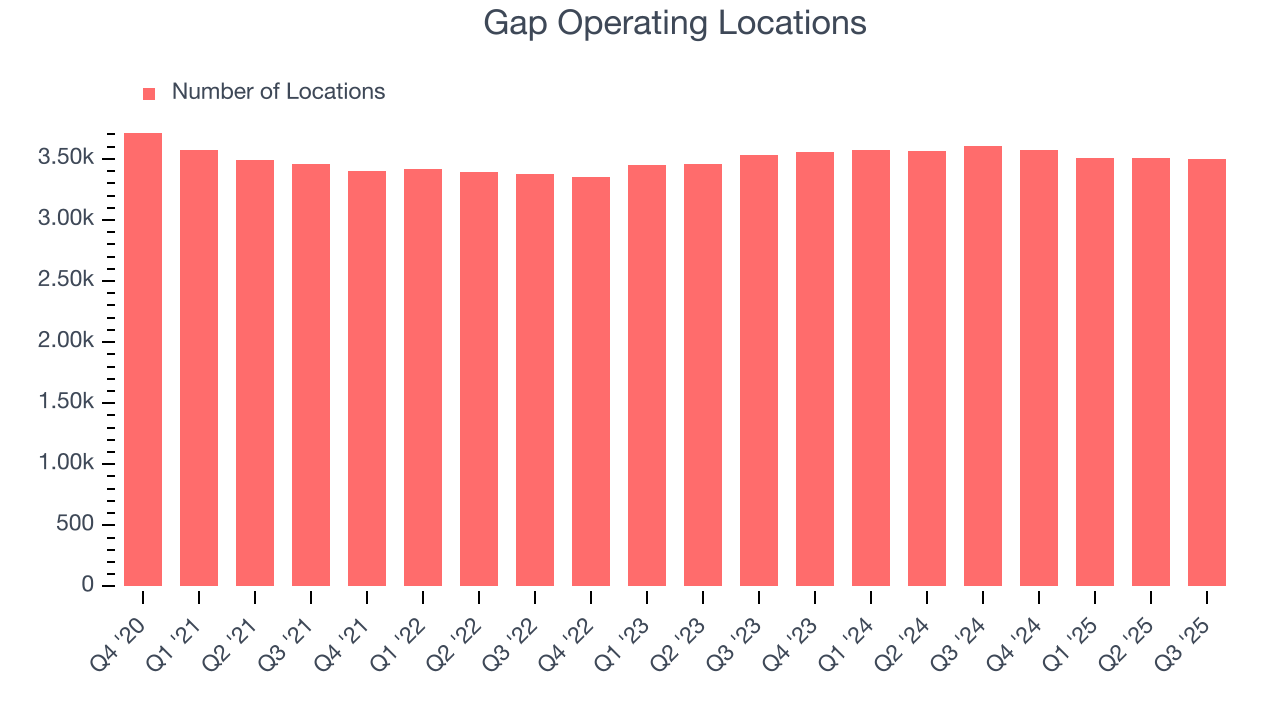
Number of Stores
A retailer’s store count often determines how much revenue it can generate.
Gap has kept its store count flat over the last two years while other consumer retail businesses have opted for growth.
When a retailer keeps its store footprint steady, it usually means demand is stable and it’s focusing on operational efficiency to increase profitability.
Note that Gap reports its store count intermittently, so some data points are missing in the chart below.
Same-Store Sales
A company's store base only paints one part of the picture. When demand is high, it makes sense to open more. But when demand is low, it’s prudent to close some locations and use the money in other ways. Same-store sales gives us insight into this topic because it measures organic growth for a retailer's e-commerce platform and brick-and-mortar shops that have existed for at least a year.
Gap’s demand has been healthy for a retailer over the last two years. On average, the company has grown its same-store sales by a robust 2.6% per year. Given its flat store base over the same period, this performance stems from not only increased foot traffic at existing locations but also higher e-commerce sales as demand shifts from in-store to online.
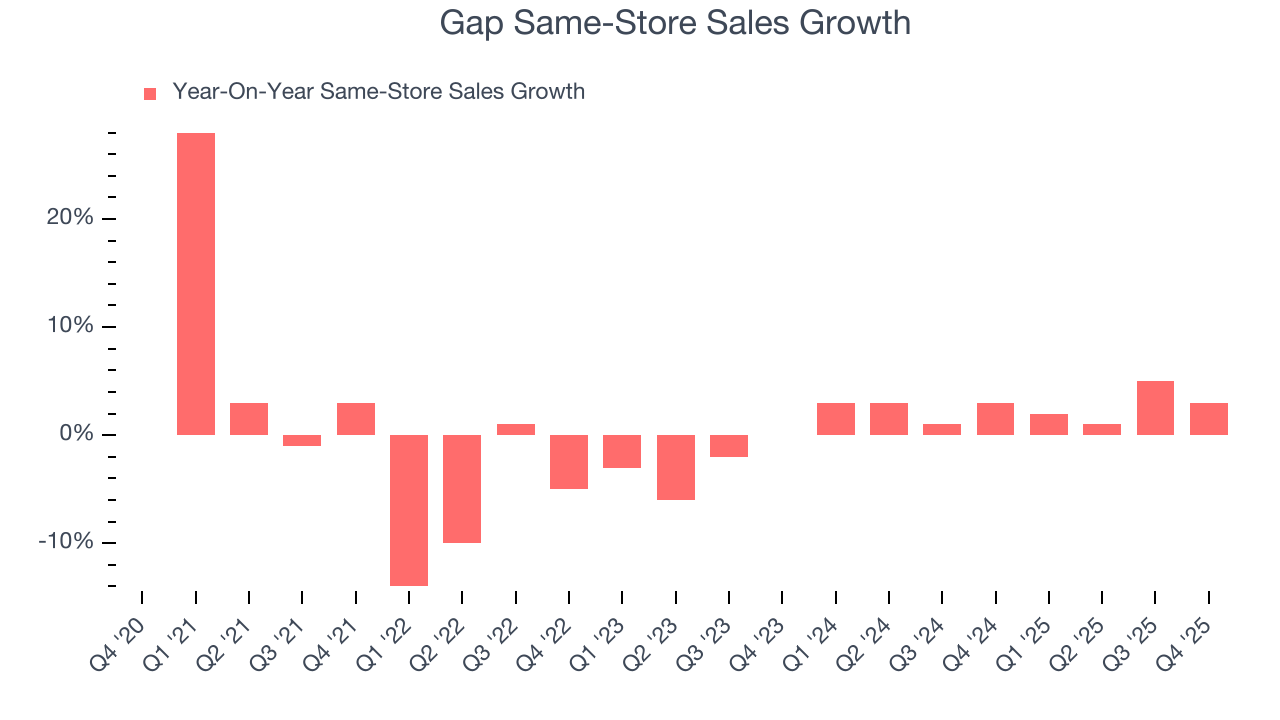
In the latest quarter, Gap’s same-store sales rose 3% year on year. This performance was more or less in line with its historical levels.
7. Gross Margin & Pricing Power
Gap’s unit economics are higher than the typical retailer, giving it the flexibility to invest in areas such as marketing and talent to reach more consumers. As you can see below, it averaged a decent 41% gross margin over the last two years. Said differently, Gap paid its suppliers $58.97 for every $100 in revenue. 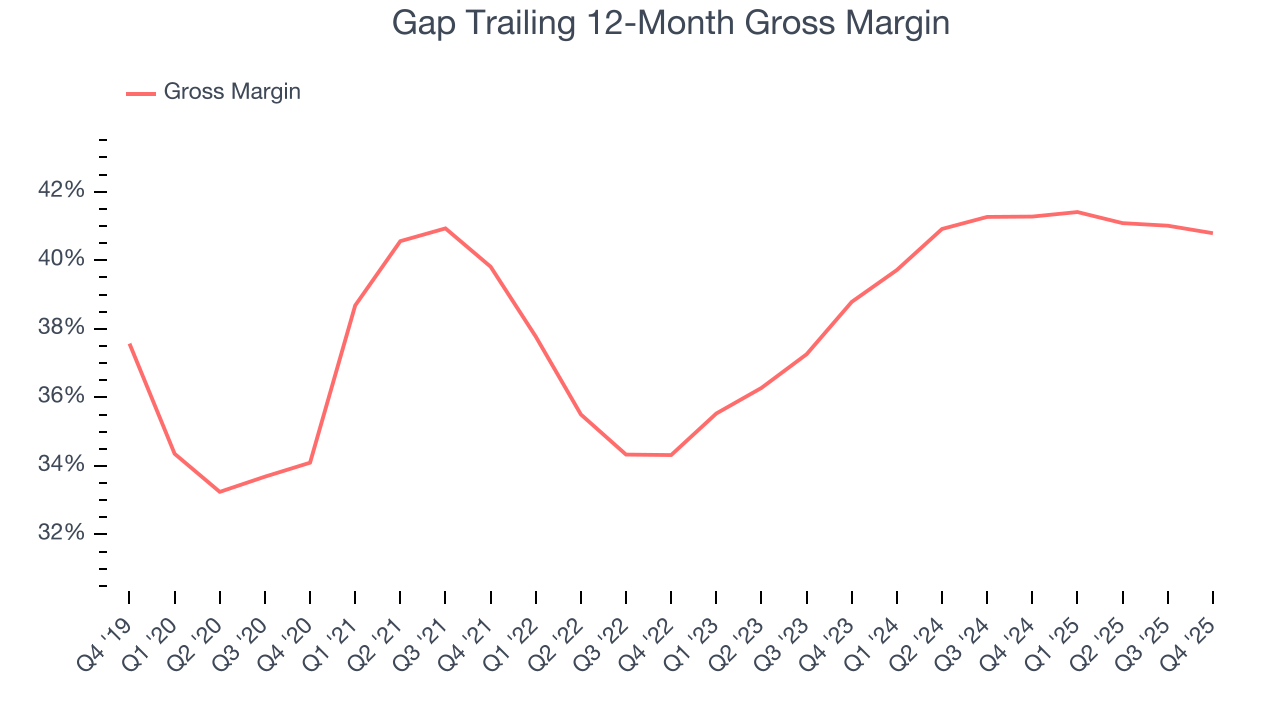
In Q4, Gap produced a 38.1% gross profit margin, in line with the same quarter last year. On a wider time horizon, the company’s full-year margin has remained steady over the past four quarters, suggesting it strives to keep prices low for customers and has stable input costs (such as labor and freight expenses to transport goods).
8. Operating Margin
Gap’s operating margin has generally stayed the same over the last 12 months, averaging 7.3% over the last two years. This profitability was mediocre for a consumer retail business and caused by its suboptimal cost structure.
Analyzing the trend in its profitability, Gap’s operating margin might fluctuated slightly but has generally stayed the same over the last year, meaning it will take a fundamental shift in the business model to change.
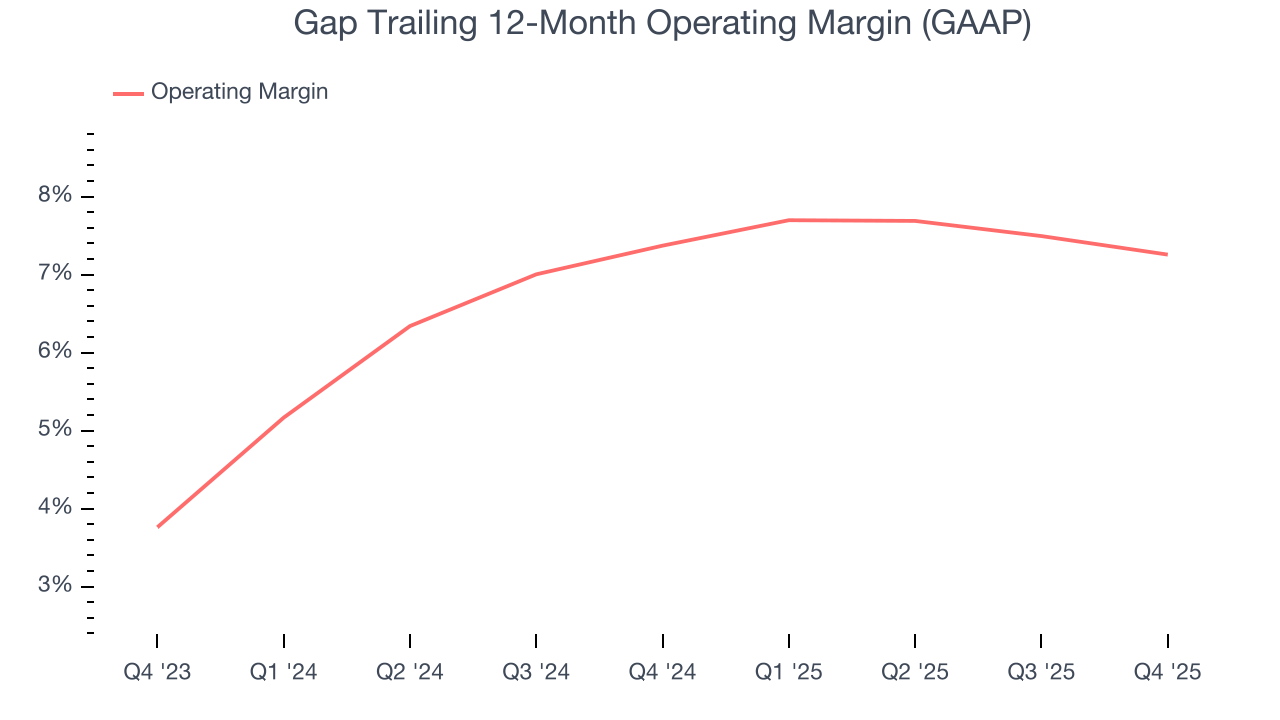
In Q4, Gap generated an operating margin profit margin of 5.4%, in line with the same quarter last year. This indicates the company’s cost structure has recently been stable.
9. Earnings Per Share
Revenue trends explain a company’s historical growth, but the long-term change in earnings per share (EPS) points to the profitability of that growth – for example, a company could inflate its sales through excessive spending on advertising and promotions.
Gap’s full-year EPS flipped from negative to positive over the last three years. This is encouraging and shows it’s at a critical moment in its life.
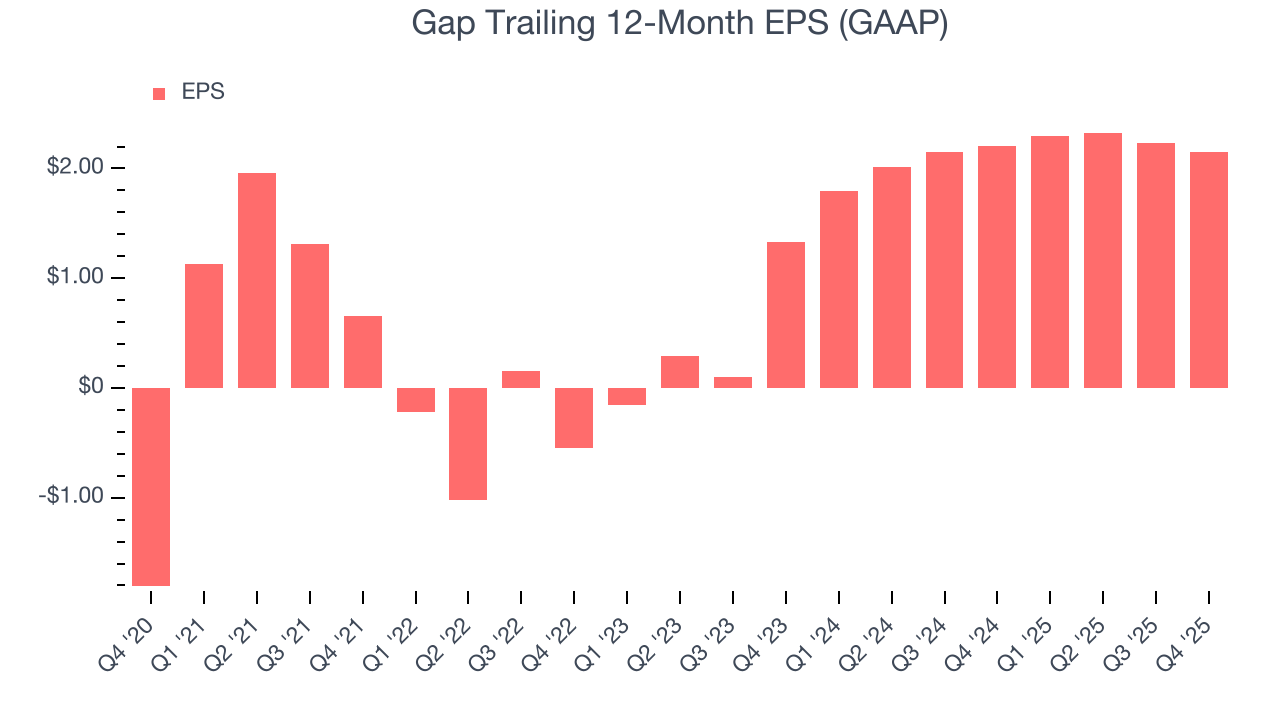
In Q4, Gap reported EPS of $0.45, down from $0.54 in the same quarter last year. This print was close to analysts’ estimates. Over the next 12 months, Wall Street expects Gap’s full-year EPS of $2.15 to grow 8.6%.
10. Cash Is King
If you’ve followed StockStory for a while, you know we emphasize free cash flow. Why, you ask? We believe that in the end, cash is king, and you can’t use accounting profits to pay the bills.
Gap has shown impressive cash profitability, giving it the option to reinvest or return capital to investors. The company’s free cash flow margin averaged 6.1% over the last two years, better than the broader consumer retail sector. Gap has shown impressive cash profitability relative to peers over the last two years, giving the company fewer opportunities to return capital to shareholders. The divergence from its underwhelming operating margin stems from the add-back of non-cash charges like depreciation and stock-based compensation. GAAP operating profit expenses these line items, but free cash flow does not.
Taking a step back, we can see that Gap’s margin dropped by 1.5 percentage points over the last year. If its declines continue, it could signal increasing investment needs and capital intensity.
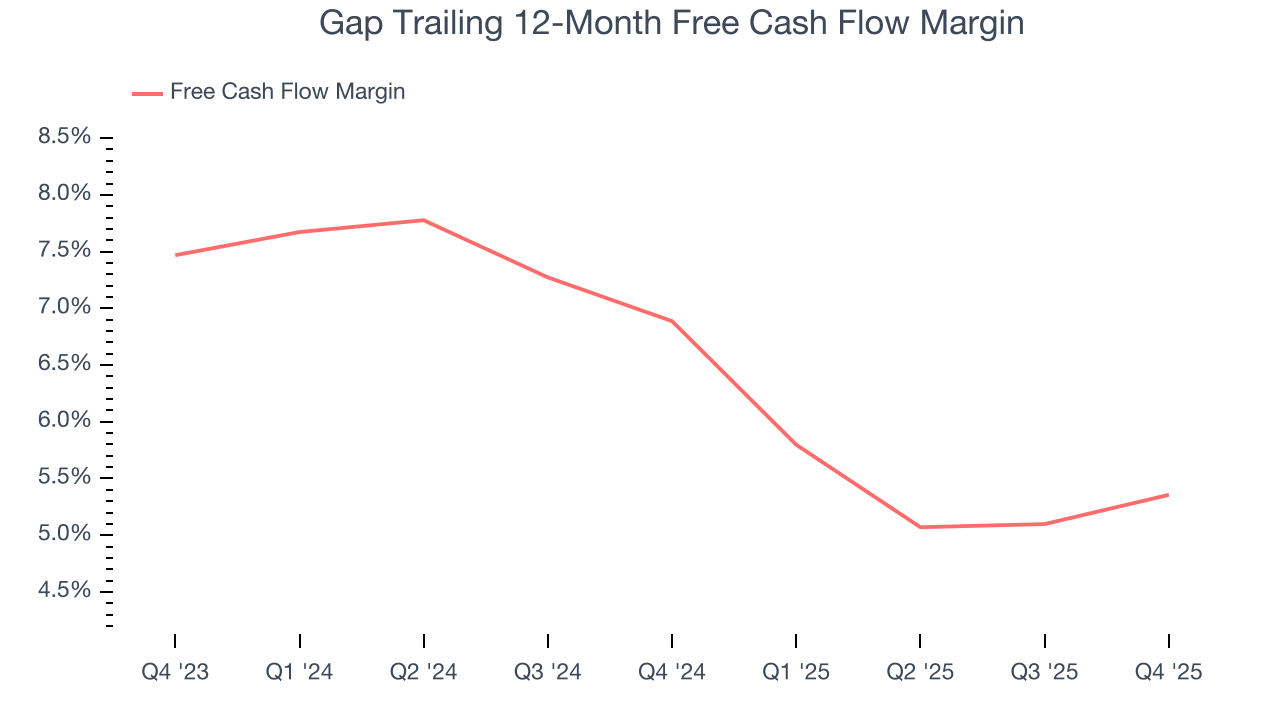
Gap’s free cash flow clocked in at $543 million in Q4, equivalent to a 12.8% margin. This cash profitability was in line with the comparable period last year and above its two-year average.
11. Return on Invested Capital (ROIC)
EPS and free cash flow tell us whether a company was profitable while growing its revenue. But was it capital-efficient? A company’s ROIC explains this by showing how much operating profit it makes compared to the money it has raised (debt and equity).
Gap historically did a mediocre job investing in profitable growth initiatives. Its five-year average ROIC was 7.6%, somewhat low compared to the best consumer retail companies that consistently pump out 25%+.
12. Balance Sheet Assessment
Gap reported $3.00 billion of cash and $5.61 billion of debt on its balance sheet in the most recent quarter. As investors in high-quality companies, we primarily focus on two things: 1) that a company’s debt level isn’t too high and 2) that its interest payments are not excessively burdening the business.
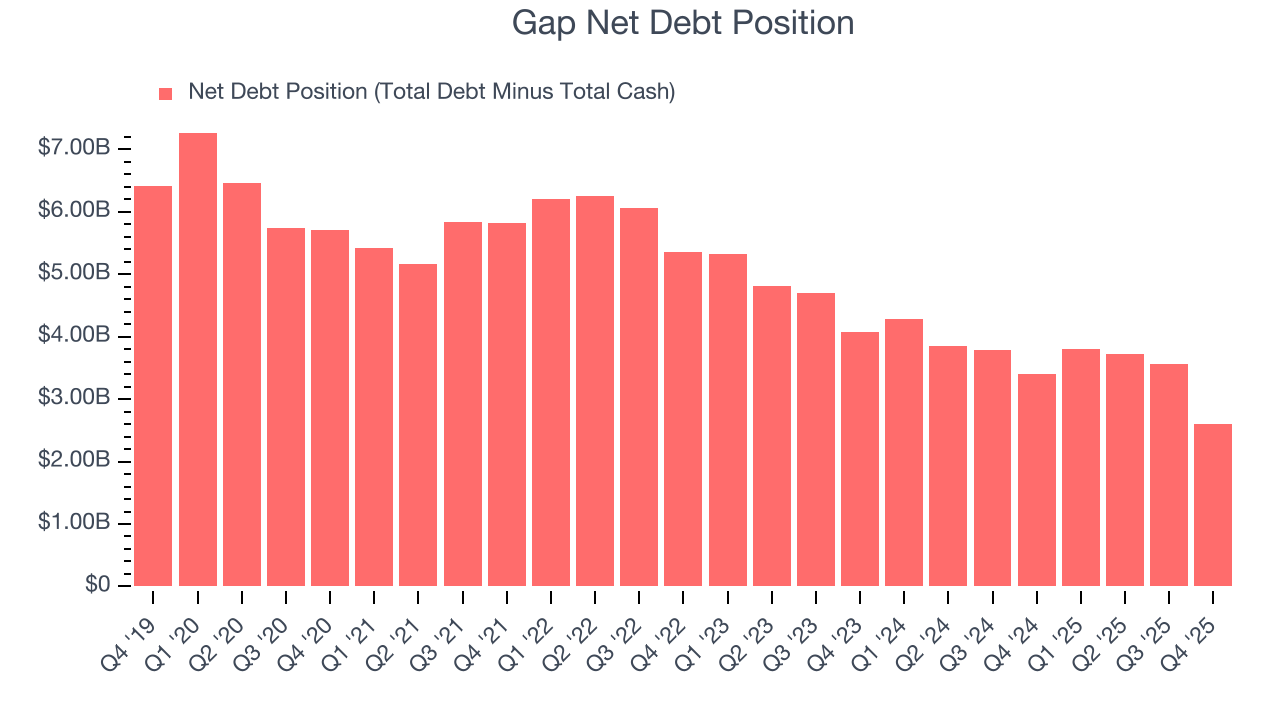
With $1.61 billion of EBITDA over the last 12 months, we view Gap’s 1.6× net-debt-to-EBITDA ratio as safe. We also see its $3 million of annual interest expenses as appropriate. The company’s profits give it plenty of breathing room, allowing it to continue investing in growth initiatives.
13. Key Takeaways from Gap’s Q4 Results
We enjoyed seeing Gap beat analysts’ EBITDA expectations this quarter. On the other hand, its revenue guidance for next quarter slightly missed. Overall, this print had some key positives. Investors were likely hoping for more, and shares traded down 9.4% to $24.64 immediately after reporting.
14. Is Now The Time To Buy Gap?
Updated: March 23, 2026 at 10:41 PM EDT
A common mistake we notice when investors are deciding whether to buy a stock or not is that they simply look at the latest earnings results. Business quality and valuation matter more, so we urge you to understand these dynamics as well.
Gap’s business quality ultimately falls short of our standards. To kick things off, its revenue has declined over the last three years. While its EPS growth over the last three years has been fantastic, the downside is its relatively low ROIC suggests management has struggled to find compelling investment opportunities. On top of that, its low growth in new store openings show it’s focused on existing locations.
Gap’s P/E ratio based on the next 12 months is 10.4x. This valuation multiple is fair, but we don’t have much faith in the company. We're fairly confident there are better investments elsewhere.
Wall Street analysts have a consensus one-year price target of $30.65 on the company (compared to the current share price of $24.51).
Although the price target is bullish, readers should exercise caution because analysts tend to be overly optimistic. The firms they work for, often big banks, have relationships with companies that extend into fundraising, M&A advisory, and other rewarding business lines. As a result, they typically hesitate to say bad things for fear they will lose out. We at StockStory do not suffer from such conflicts of interest, so we’ll always tell it like it is.