
General Mills (GIS)
General Mills faces an uphill battle. Strike one is its drop in sales and strike two is its falling cash conversion. No need to wait for strike three.― StockStory Analyst Team
1. News


2. Summary
Why We Think General Mills Will Underperform
Best known for its portfolio of powerhouse breakfast cereal brands, General Mills (NYSE:GIS) is a packaged foods company that has also made a mark in cereals, baking products, and snacks.
- Annual revenue declines of 1% over the last three years indicate problems with its market positioning
- Forecasted revenue decline of 2.5% for the upcoming 12 months implies demand will fall even further
- Organic sales performance over the past two years indicates the company may need to make strategic adjustments or rely on M&A to catalyze faster growth


General Mills is skating on thin ice. There are more promising alternatives.
Why There Are Better Opportunities Than General Mills


General Mills is trading at $38.91 per share, or 11.3x forward P/E. Yes, this valuation multiple is lower than that of other consumer staples peers, but we’ll remind you that you often get what you pay for.
Cheap stocks can look like great bargains at first glance, but you often get what you pay for. These mediocre businesses often have less earnings power, meaning there is more reliance on a re-rating to generate good returns - an unlikely scenario for low-quality companies.
3. General Mills (GIS) Research Report: Q1 CY2026 Update
Packaged foods company General Mills (NYSE:GIS) met Wall Street’s revenue expectations in Q1 CY2026, but sales fell by 8.4% year on year to $4.44 billion. Its non-GAAP profit of $0.64 per share was 12.1% below analysts’ consensus estimates.
General Mills (GIS) Q3 CY2025 Highlights:
- Revenue: $4.52 billion vs analyst estimates of $4.51 billion (6.8% year-on-year decline, in line)
- Adjusted EPS: $0.86 vs analyst estimates of $0.82 (5.4% beat)
- Reaffirmed full-year guidance previously given
- Operating Margin: 38.2%, up from 17.2% in the same quarter last year due to non-recurring divestiture gain of $1.1 billion (pre-tax)
- Free Cash Flow Margin: 6.4%, down from 10% in the same quarter last year
- Organic Revenue fell 3% year on year vs analyst estimates of 2.8% decline (roughly in line)
- Sales Volumes fell 8% year on year (0% in the same quarter last year)
- Market Capitalization: $26.5 billion
General Mills (GIS) Q1 CY2026 Highlights:
- Revenue: $4.44 billion vs analyst estimates of $4.42 billion (8.4% year-on-year decline, in line)
- Adjusted EPS: $0.64 vs analyst expectations of $0.73 (12.1% miss)
- Adjusted EBITDA: $664 million vs analyst estimates of $727.5 million (15% margin, 8.7% miss)
- Operating Margin: 11.8%, down from 18.4% in the same quarter last year
- Free Cash Flow Margin: 6.7%, down from 8.8% in the same quarter last year
- Organic Revenue fell 3% year on year (miss)
- Sales Volumes fell 11% year on year (-4% in the same quarter last year)
- Market Capitalization: $20.67 billion
Company Overview
Best known for its portfolio of powerhouse breakfast cereal brands, General Mills (NYSE:GIS) is a packaged foods company that has also made a mark in cereals, baking products, and snacks.
The company traces its roots back to 1866 when it started as Minneapolis Milling Company. The early years were marked by innovation, including the development of a more efficient grinding mill. In the 1920s, the company merged with 26 other mills to form General Mills.
Through organic development as well as mergers and acquisitions of companies such as Betty Crocker and Pillsbury, General Mills built a powerful portfolio of packaged foods brands. Today, Cheerios, Chex, Betty Crocker, Yoplait, and Haagen-Dazs are some of the company’s gems and also some of the most recognized brands in American households.
General Mills caters to middle-income households seeking convenience through trusted brands. The heads or caretakers of these households are usually busy and don’t have the time to cook meals or prepare snacks from scratch. The company’s products add convenience to everyday life, and they are often brands that customers have been eating since childhood. General Mills products are sold nearly everywhere. Retailers from the largest supermarkets to the corner deli or bodega all carry that box of Cheerios or the pint of Haagen-Dazs ice cream. Given the company’s scale and traffic-driving brands, General Mills often has prominent placement on retailer shelves.
4. Shelf-Stable Food
As America industrialized and moved away from an agricultural economy, people faced more demands on their time. Packaged foods emerged as a solution offering convenience to the evolving American family, whether it be canned goods or snacks. Today, Americans seek brands that are high in quality, reliable, and reasonably priced. Furthermore, there's a growing emphasis on health-conscious and sustainable food options. Packaged food stocks are considered resilient investments. People always need to eat, so these companies can enjoy consistent demand as long as they stay on top of changing consumer preferences. The industry spans from multinational corporations to smaller specialized firms and is subject to food safety and labeling regulations.
Competitors in packaged food with broad brand portfolios include Kellogg (NYSE:K), Mondelez (NASDAQ:MDLZ), Kraft Heinz (NASDAQ:KHC), and Nestle (SWX:NESN).
5. Revenue Growth
Reviewing a company’s long-term sales performance reveals insights into its quality. Even a bad business can shine for one or two quarters, but a top-tier one grows for years.
With $18.37 billion in revenue over the past 12 months, General Mills is larger than most consumer staples companies and benefits from economies of scale, enabling it to gain more leverage on its fixed costs than smaller competitors. Its size also gives it negotiating leverage with distributors, allowing its products to reach more shelves. However, its scale is a double-edged sword because there are only a finite number of major retail partners, placing a ceiling on its growth. To expand meaningfully, General Mills likely needs to tweak its prices, innovate with new products, or enter new markets.
As you can see below, General Mills struggled to generate demand over the last three years. Its sales dropped by 2.7% annually as consumers bought less of its products.
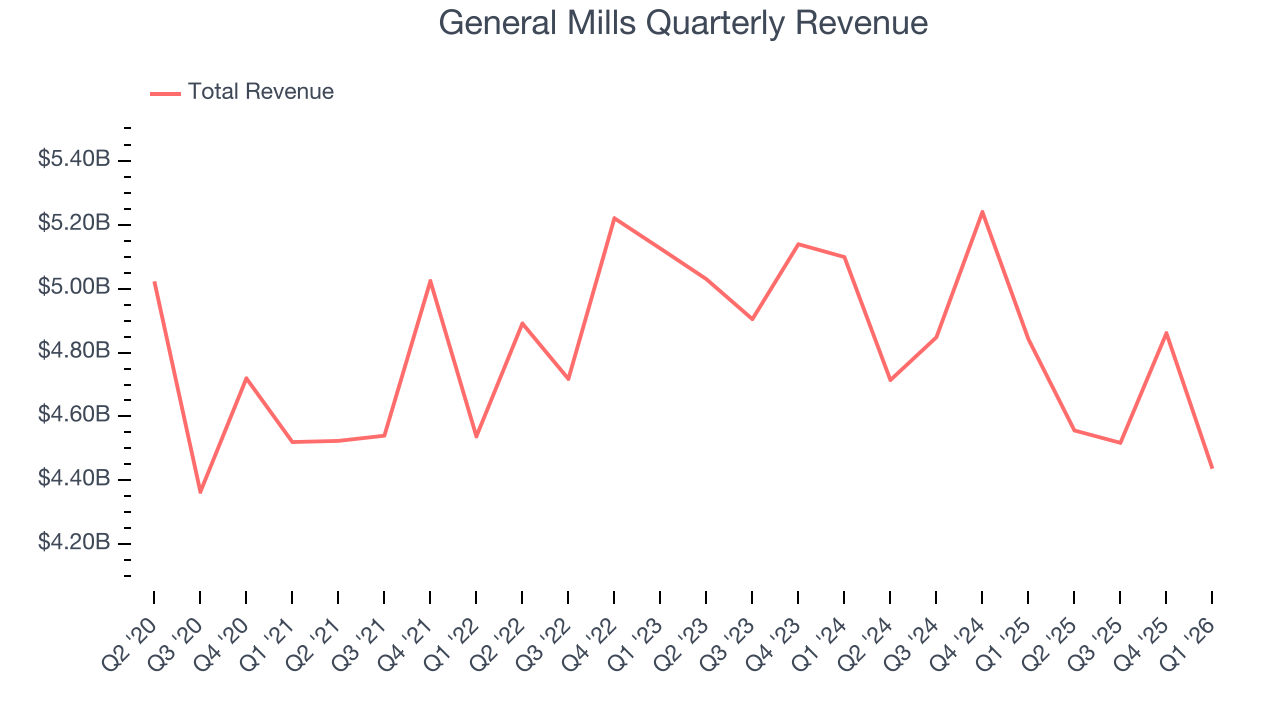
This quarter, General Mills reported a rather uninspiring 8.4% year-on-year revenue decline to $4.44 billion of revenue, in line with Wall Street’s estimates.
Looking ahead, sell-side analysts expect revenue to remain flat over the next 12 months. While this projection implies its newer products will fuel better top-line performance, it is still below average for the sector.
6. Volume Growth
Revenue growth can be broken down into changes in price and volume (the number of units sold). While both are important, volume is the lifeblood of a successful staples business as there’s a ceiling to what consumers will pay for everyday goods; they can always trade down to non-branded products if the branded versions are too expensive.
To analyze whether General Mills generated its growth (or lack thereof) from changes in price or volume, we can compare its volume growth to its organic revenue growth, which excludes non-fundamental impacts on company financials like mergers and currency fluctuations.
Over the last two years, General Mills’s average quarterly volumes have shrunk by 4.1%. This isn’t ideal for a consumer staples company, where demand is typically stable. In the context of its 2.6% average organic sales declines, we can see that most of the company’s losses have come from fewer customers purchasing its products.
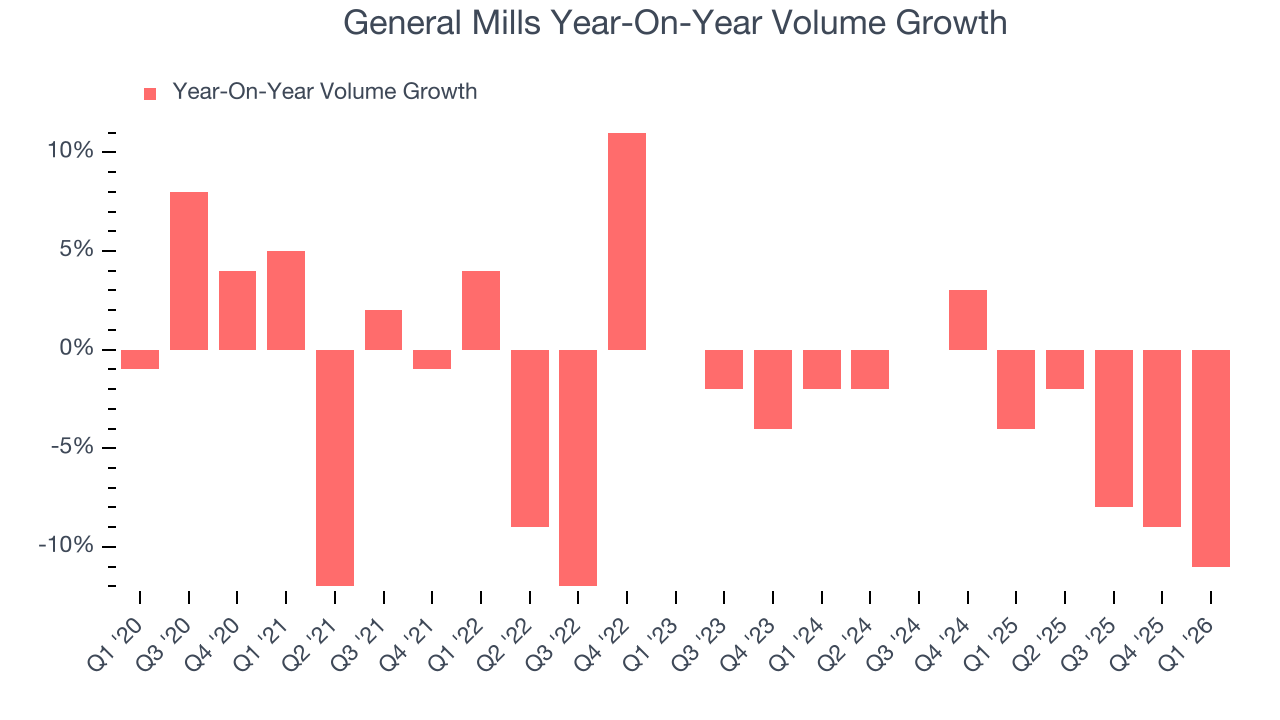
In General Mills’s Q1 2026, sales volumes dropped 11% year on year. This result represents a further deceleration from its historical levels, showing the business is struggling to move its products.
7. Gross Margin & Pricing Power
General Mills’s unit economics are higher than the typical consumer staples company, giving it the flexibility to invest in areas such as marketing and talent to reach more consumers. As you can see below, it averaged a decent 34.3% gross margin over the last two years. Said differently, General Mills paid its suppliers $65.73 for every $100 in revenue. 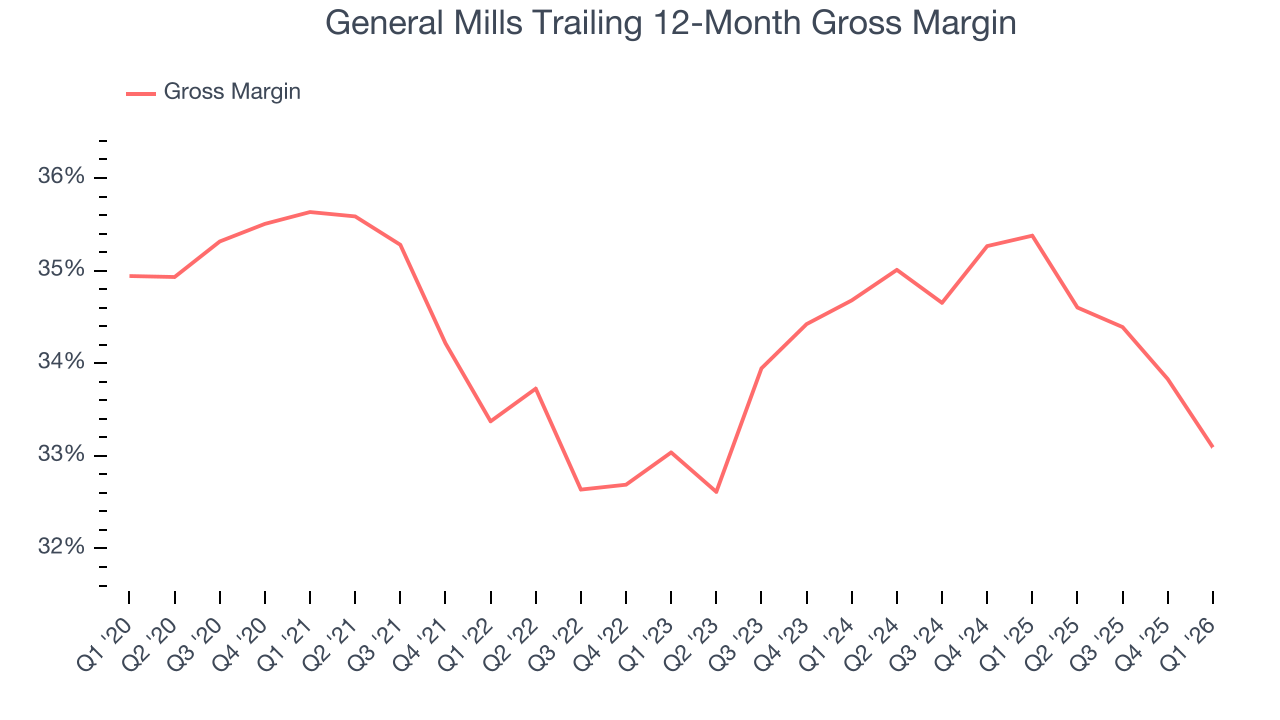
This quarter, General Mills’s gross profit margin was 30.8%, down 3 percentage points year on year. General Mills’s full-year margin has also been trending down over the past 12 months, decreasing by 2.3 percentage points. If this move continues, it could suggest a more competitive environment with some pressure to lower prices and higher input costs (such as raw materials and manufacturing expenses).
8. Operating Margin
Operating margin is an important measure of profitability as it shows the portion of revenue left after accounting for all core expenses – everything from the cost of goods sold to advertising and wages. It’s also useful for comparing profitability across companies with different levels of debt and tax rates because it excludes interest and taxes.
General Mills’s operating margin has more or less stayed the same over the last 12 months , averaging 18.6% over the last two years. This profitability was top-notch for a consumer staples business, showing it’s an well-run company with an efficient cost structure.
Analyzing the trend in its profitability, General Mills’s operating margin might fluctuated slightly but has generally stayed the same over the last year, highlighting the consistency of its expense base.
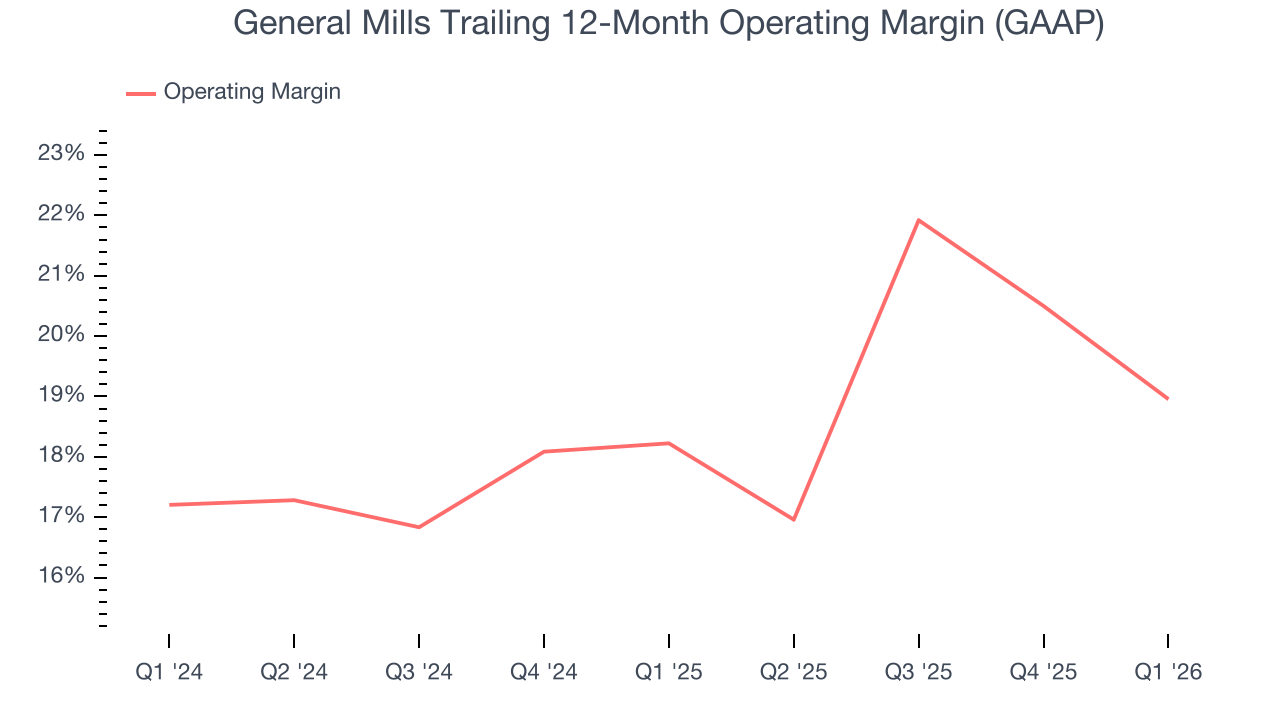
In Q1, General Mills generated an operating margin profit margin of 11.8%, down 6.6 percentage points year on year. Since General Mills’s operating margin decreased more than its gross margin, we can assume it was less efficient because expenses such as marketing, and administrative overhead increased.
9. Earnings Per Share
We track the long-term change in earnings per share (EPS) for the same reason as long-term revenue growth. Compared to revenue, however, EPS highlights whether a company’s growth is profitable.
Sadly for General Mills, its EPS declined by 8.1% annually over the last three years, more than its revenue. This tells us the company struggled because its fixed cost base made it difficult to adjust to shrinking demand.
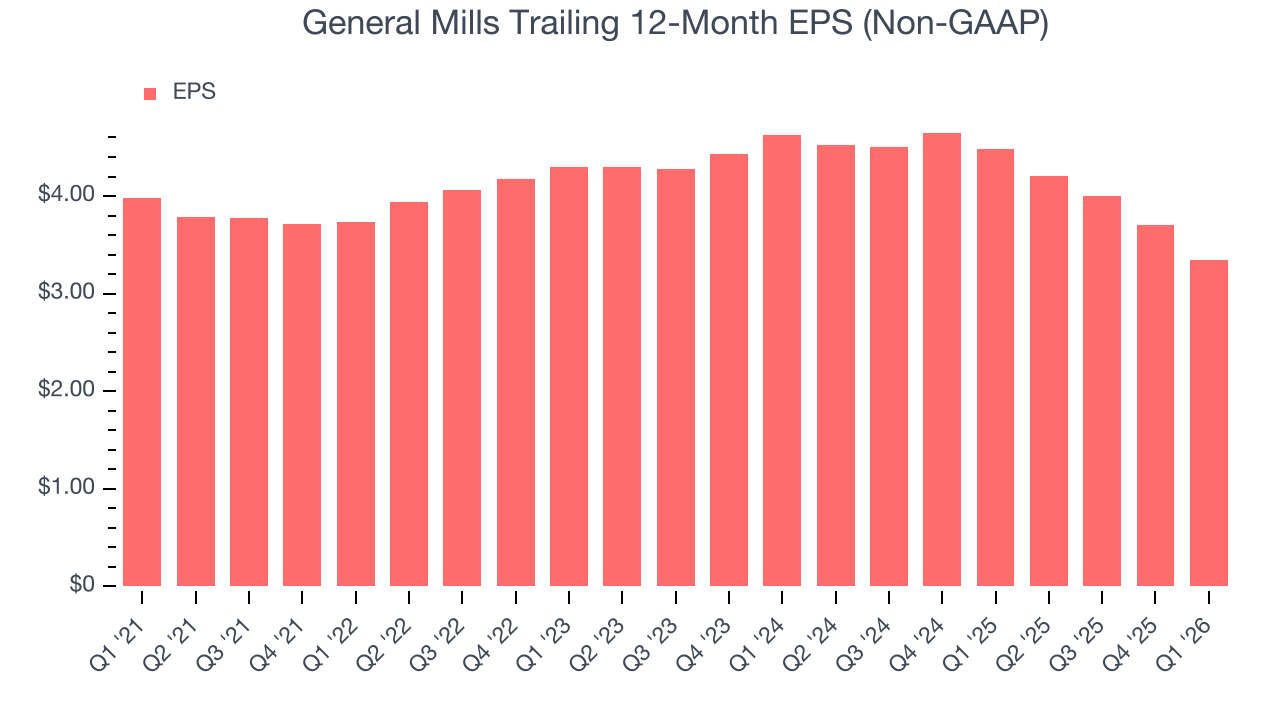
In Q1, General Mills reported adjusted EPS of $0.64, down from $1 in the same quarter last year. This print missed analysts’ estimates. Over the next 12 months, Wall Street expects General Mills’s full-year EPS of $3.34 to grow 5.1%.
10. Cash Is King
Free cash flow isn't a prominently featured metric in company financials and earnings releases, but we think it's telling because it accounts for all operating and capital expenses, making it tough to manipulate. Cash is king.
General Mills has shown robust cash profitability, giving it an edge over its competitors and the ability to reinvest or return capital to investors. The company’s free cash flow margin averaged 10.9% over the last two years, quite impressive for a consumer staples business.
Taking a step back, we can see that General Mills’s margin dropped by 3.6 percentage points over the last year. This decrease warrants extra caution because General Mills failed to grow its revenue organically. Its cash profitability could decay further if it tries to reignite growth through investments.
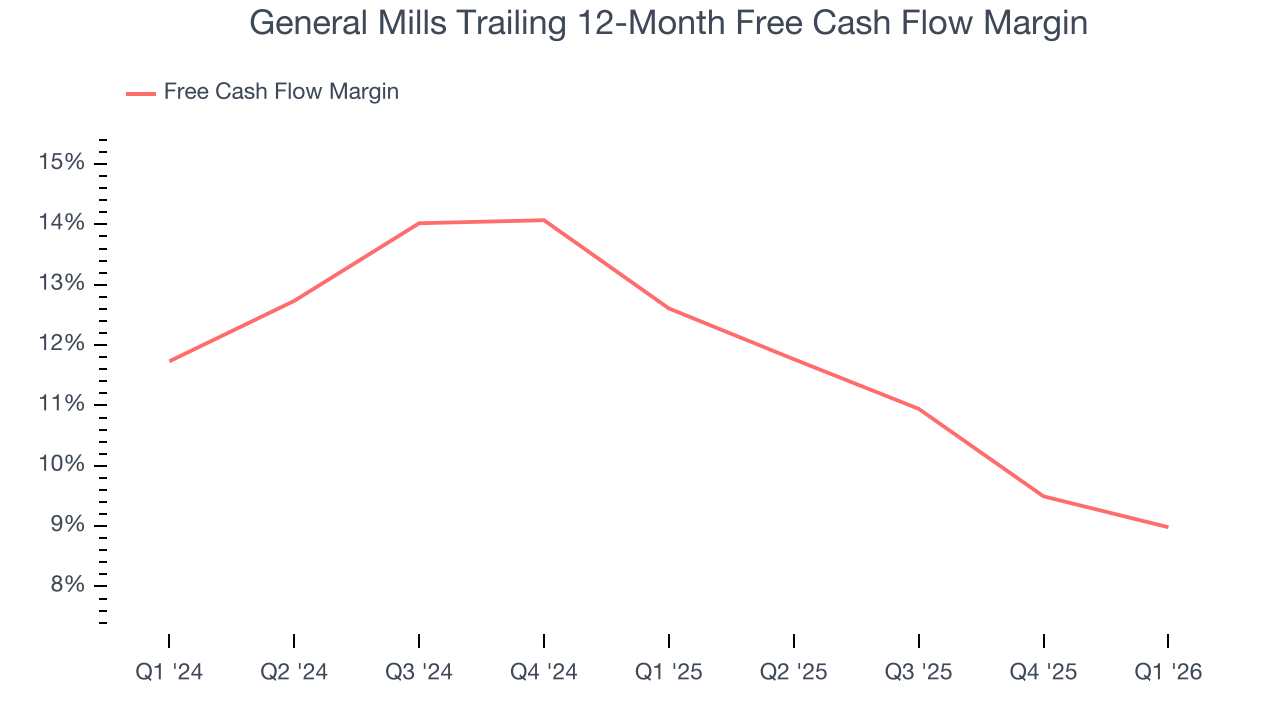
General Mills’s free cash flow clocked in at $295.5 million in Q1, equivalent to a 6.7% margin. The company’s cash profitability regressed as it was 2.2 percentage points lower than in the same quarter last year, suggesting its historical struggles have dragged on.
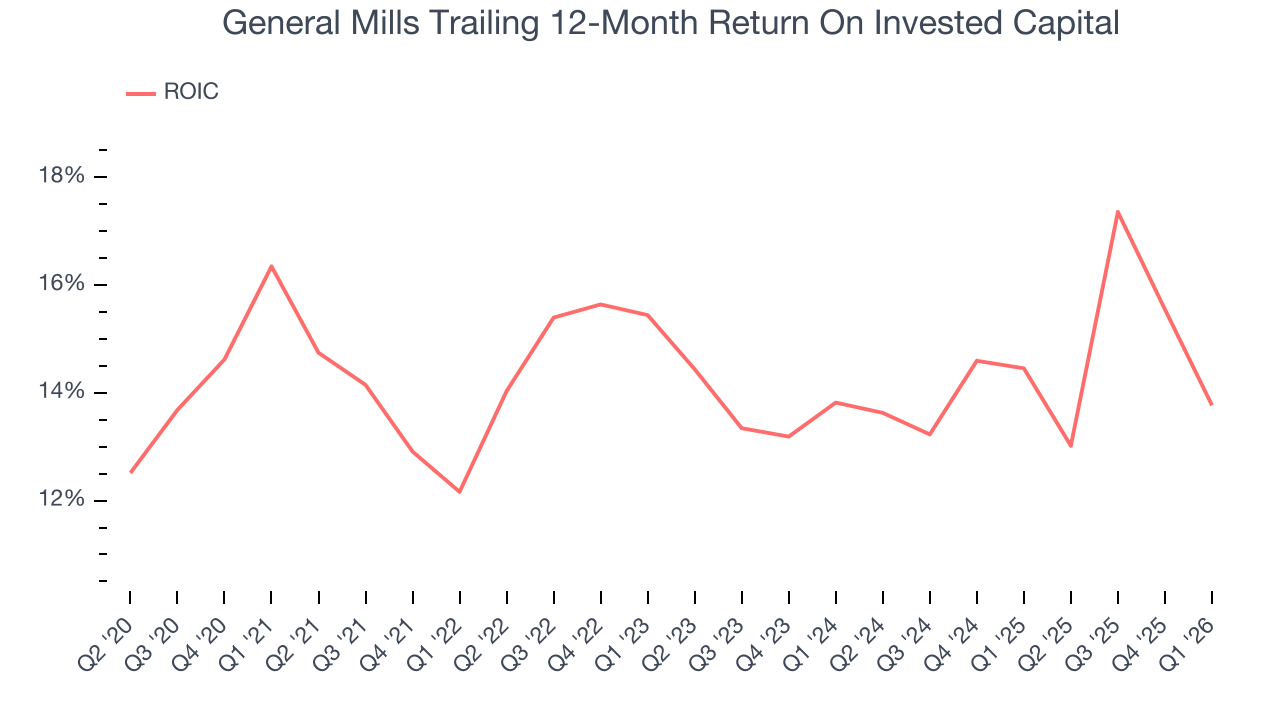
11. Return on Invested Capital (ROIC)
EPS and free cash flow tell us whether a company was profitable while growing its revenue. But was it capital-efficient? Enter ROIC, a metric showing how much operating profit a company generates relative to the money it has raised (debt and equity).
General Mills’s management team makes decent investment decisions and generates value for shareholders. Its five-year average ROIC was 13.9%, slightly better than typical consumer staples business.
12. Balance Sheet Assessment
General Mills reported $785.5 million of cash and $13.97 billion of debt on its balance sheet in the most recent quarter. As investors in high-quality companies, we primarily focus on two things: 1) that a company’s debt level isn’t too high and 2) that its interest payments are not excessively burdening the business.
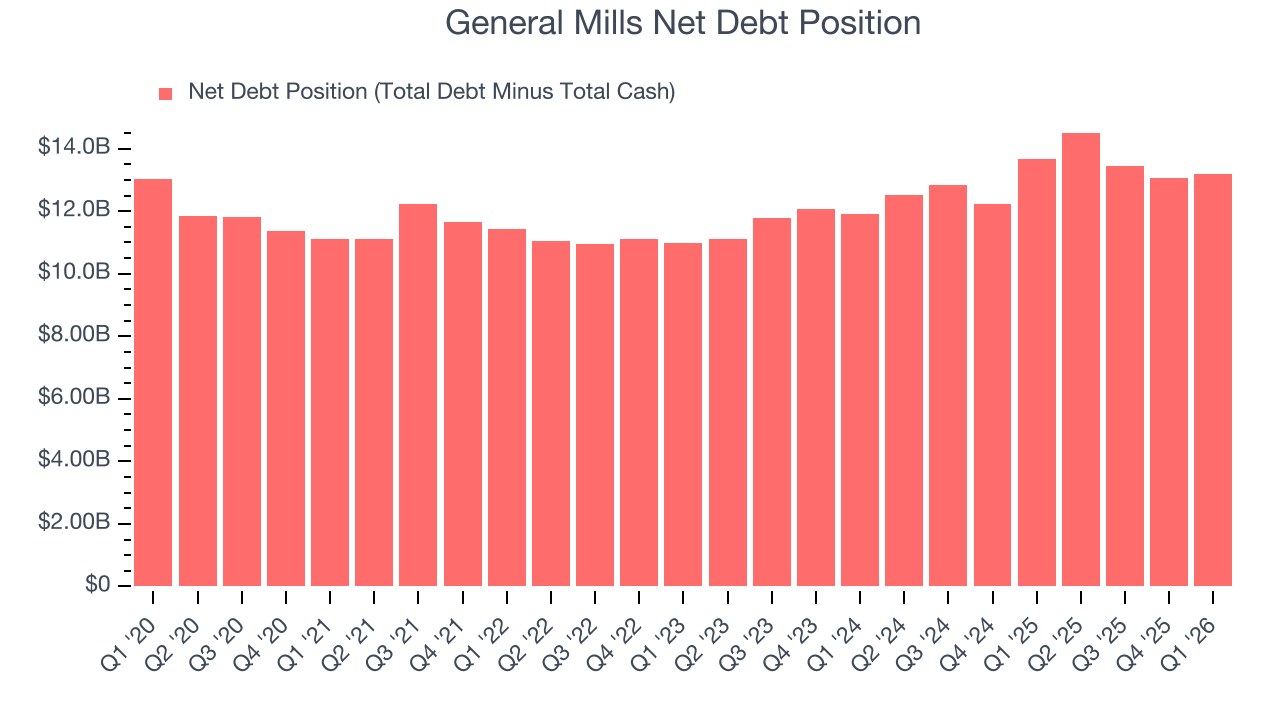
With $3.26 billion of EBITDA over the last 12 months, we view General Mills’s 4.0× net-debt-to-EBITDA ratio as safe. We also see its $270 million of annual interest expenses as appropriate. The company’s profits give it plenty of breathing room, allowing it to continue investing in growth initiatives.
13. Key Takeaways from General Mills’s Q1 Results
We struggled to find many positives in these results. Its revenue was just in line and its EPS fell short of Wall Street’s estimates. The stock remained flat at $38.56 immediately after reporting.
14. Is Now The Time To Buy General Mills?
Updated: March 18, 2026 at 7:26 AM EDT
The latest quarterly earnings matters, sure, but we actually think longer-term fundamentals and valuation matter more. Investors should consider all these pieces before deciding whether or not to invest in General Mills.
General Mills isn’t a terrible business, but it isn’t one of our picks. For starters, its revenue has declined over the last three years. While its unparalleled brand awareness makes it a household name consumers consistently turn to, the downside is its shrinking sales volumes suggest it’ll need to change its strategy to succeed. On top of that, its declining EPS over the last three years makes it a less attractive asset to the public markets.
General Mills’s P/E ratio based on the next 12 months is 11x. This valuation is reasonable, but the company’s shakier fundamentals present too much downside risk. We're fairly confident there are better stocks to buy right now.
Wall Street analysts have a consensus one-year price target of $47.16 on the company (compared to the current share price of $38.56).
Although the price target is bullish, readers should exercise caution because analysts tend to be overly optimistic. The firms they work for, often big banks, have relationships with companies that extend into fundraising, M&A advisory, and other rewarding business lines. As a result, they typically hesitate to say bad things for fear they will lose out. We at StockStory do not suffer from such conflicts of interest, so we’ll always tell it like it is.