
Mohawk Industries (MHK)
We wouldn’t buy Mohawk Industries. Its sales have underperformed and its low returns on capital show it has few growth opportunities.― StockStory Analyst Team
1. News

2. Summary
Why We Think Mohawk Industries Will Underperform
Established in 1878, Mohawk Industries (NYSE:MHK) is a leading producer of floor-covering products for both residential and commercial applications.
- Large revenue base makes it harder to increase sales quickly, and its annual revenue growth of 2.5% over the last five years was below our standards for the consumer discretionary sector
- Performance over the past five years shows its incremental sales were less profitable as its earnings per share were flat
- Poor expense management has led to an operating margin that is below the industry average


Mohawk Industries doesn’t fulfill our quality requirements. There are superior stocks for sale in the market.
Why There Are Better Opportunities Than Mohawk Industries


Mohawk Industries’s stock price of $96.17 implies a valuation ratio of 10.2x forward P/E. Yes, this valuation multiple is lower than that of other consumer discretionary peers, but we’ll remind you that you often get what you pay for.
Cheap stocks can look like a great deal at first glance, but they can be value traps. They often have less earnings power, meaning there is more reliance on a re-rating to generate good returns - an unlikely scenario for low-quality companies.
3. Mohawk Industries (MHK) Research Report: Q4 CY2025 Update
Flooring manufacturer Mohawk Industries (NYSE:MHK) beat Wall Street’s revenue expectations in Q4 CY2025, with sales up 2.4% year on year to $2.7 billion. Its non-GAAP profit of $2 per share was 1.1% above analysts’ consensus estimates.
Mohawk Industries (MHK) Q4 CY2025 Highlights:
- Revenue: $2.7 billion vs analyst estimates of $2.68 billion (2.4% year-on-year growth, 0.9% beat)
- Adjusted EPS: $2 vs analyst estimates of $1.98 (1.1% beat)
- Adjusted EBITDA: $301.2 million vs analyst estimates of $313.4 million (11.2% margin, 3.9% miss)
- Adjusted EPS guidance for Q1 CY2026 is $1.80 at the midpoint, below analyst estimates of $1.92
- Operating Margin: 2.5%, down from 4.6% in the same quarter last year
- Free Cash Flow Margin: 10%, up from 9% in the same quarter last year
- Market Capitalization: $8.34 billion
Company Overview
Established in 1878, Mohawk Industries (NYSE:MHK) is a leading producer of floor-covering products for both residential and commercial applications.
The company's product portfolio includes carpets, rugs, ceramic tile, laminate, wood, stone, and vinyl flooring, catering to diverse consumers and commercial needs.
To capture market share, the company has developed new technologies and materials for flooring, such as its SmartStrand carpet, which features built-in stain resistance, and its RevWood laminate, known for its durability and natural appearance. These features are designed to enhance product longevity.
Mohawk Industries’ strategy includes expansive acquisitions and partnerships. The company has acquired several key players in the flooring industry, such as Marazzi Group and IVC Group. These deals increased Mohawk's geographic footprint and ability to cater to varying market preferences and trends.
The company's distribution and sales strategy is another key factor. Mohawk Industries utilizes a multi-channel approach, selling through independent distributors, retailers, home centers, and its own retail showrooms. This broad distribution network enables the company to effectively reach a wide customer base, providing flexibility and convenience for its consumers.
4. Consumer Discretionary - Home Furnishings
The Consumer Discretionary sector, by definition, is made up of companies selling non-essential goods and services. When economic conditions deteriorate or tastes shift, consumers can easily cut back or eliminate these purchases. For long-term investors with five-year holding periods, this creates a structural challenge: the sector is inherently hit-driven, with low switching costs and fickle customers. As a result, only a handful of companies can reliably grow demand and compound earnings over long periods, which is why our bar is high and High Quality ratings are rare.
Home furnishings companies design, manufacture, and sell furniture, décor, bedding, and related household products for residential and commercial spaces. Tailwinds include e-commerce expansion enabling broader distribution, continued remote-work trends sustaining home improvement interest, and premiumization as consumers invest in living spaces. However, headwinds are considerable: demand is closely tied to housing market activity, and rising mortgage rates have slowed home sales—a key purchase trigger. Bulky products carry high shipping costs and complex logistics. Intense competition from low-cost imports and mass-market retailers compresses margins, while consumer spending on furnishings is among the first categories deferred during economic downturns.
Mohawk Industries' primary competitors include Shaw Industries (owned by Berkshire Hathaway NYSE:BRK.A), Armstrong Flooring (NYSE:AFI), Tarkett (EPA:TKTT), Interface (NASDAQ:TILE), and private company Mannington Mills.
5. Revenue Growth
A company’s long-term sales performance is one signal of its overall quality. Any business can experience short-term success, but top-performing ones enjoy sustained growth for years. Over the last five years, Mohawk Industries grew its sales at a weak 2.5% compounded annual growth rate. This was below our standards and is a poor baseline for our analysis.
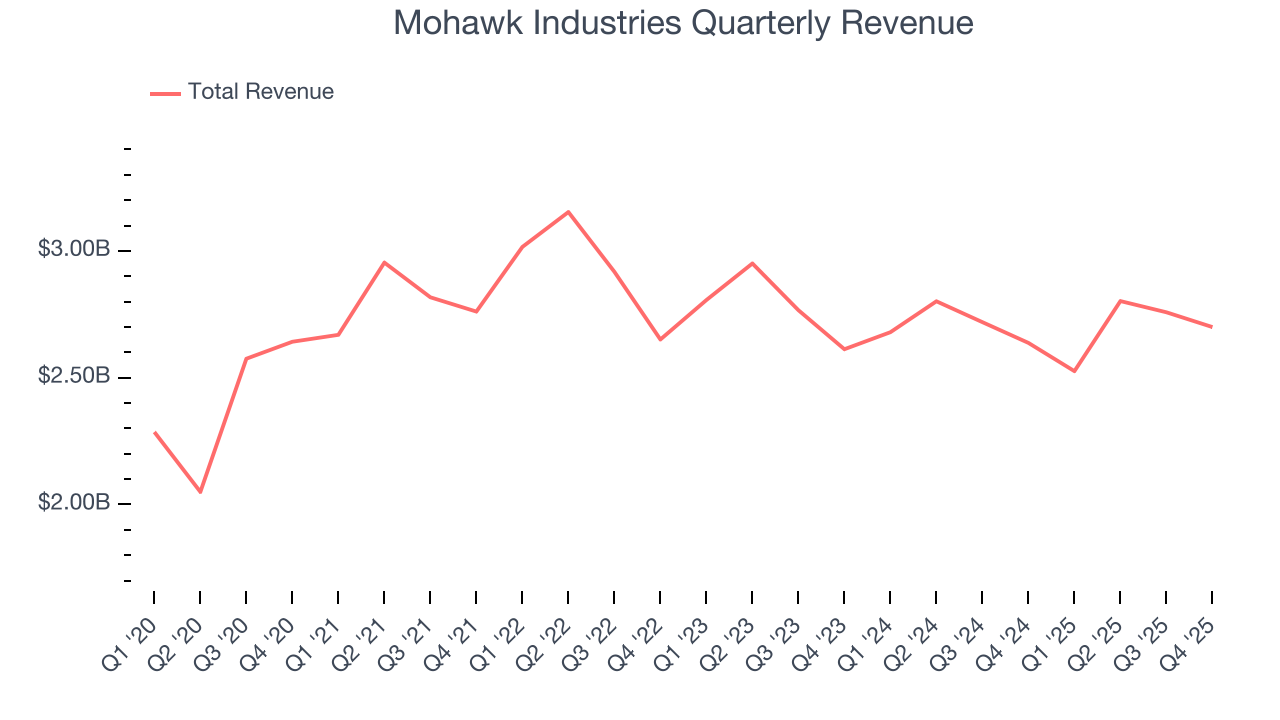
We at StockStory place the most emphasis on long-term growth, but within consumer discretionary, a stretched historical view may miss a company riding a successful new product or trend. Mohawk Industries’s performance shows it grew in the past but relinquished its gains over the last two years, as its revenue fell by 1.6% annually. 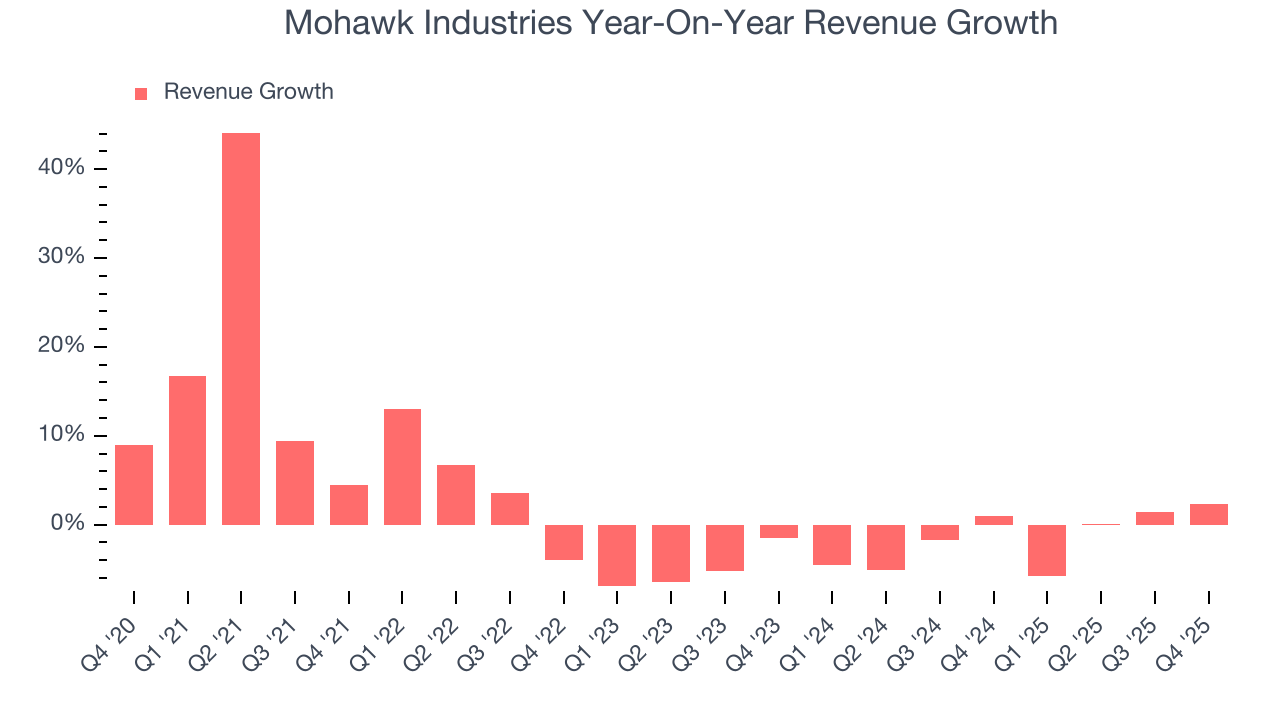
This quarter, Mohawk Industries reported modest year-on-year revenue growth of 2.4% but beat Wall Street’s estimates by 0.9%.
Looking ahead, sell-side analysts expect revenue to grow 1.9% over the next 12 months. Although this projection suggests its newer products and services will catalyze better top-line performance, it is still below the sector average.
6. Operating Margin
Mohawk Industries’s operating margin has been trending down over the last 12 months and averaged 5.5% over the last two years. The company’s profitability was mediocre for a consumer discretionary business and shows it couldn’t pass its higher operating expenses onto its customers.
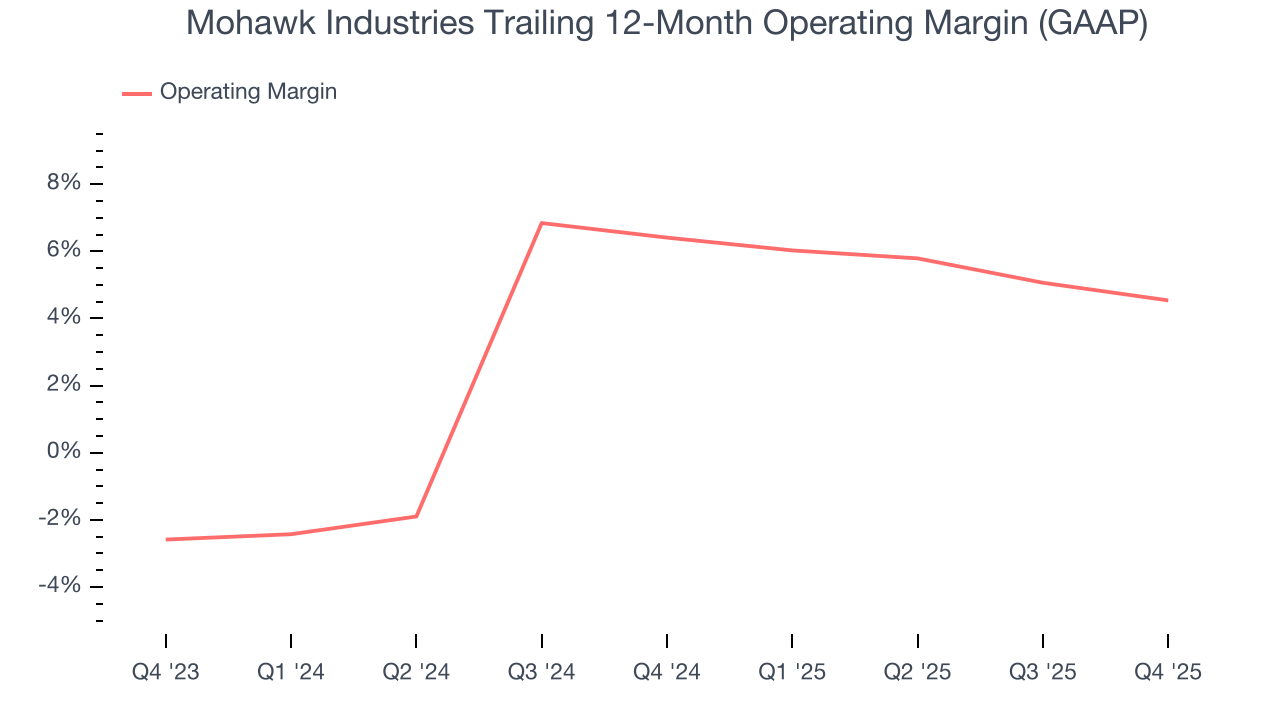
This quarter, Mohawk Industries generated an operating margin profit margin of 2.5%, down 2.1 percentage points year on year. This contraction shows it was less efficient because its expenses grew faster than its revenue.
7. Earnings Per Share
We track the long-term change in earnings per share (EPS) for the same reason as long-term revenue growth. Compared to revenue, however, EPS highlights whether a company’s growth is profitable.
Mohawk Industries’s flat EPS over the last five years was below its 2.5% annualized revenue growth. This tells us the company became less profitable on a per-share basis as it expanded due to non-fundamental factors such as interest expenses and taxes.
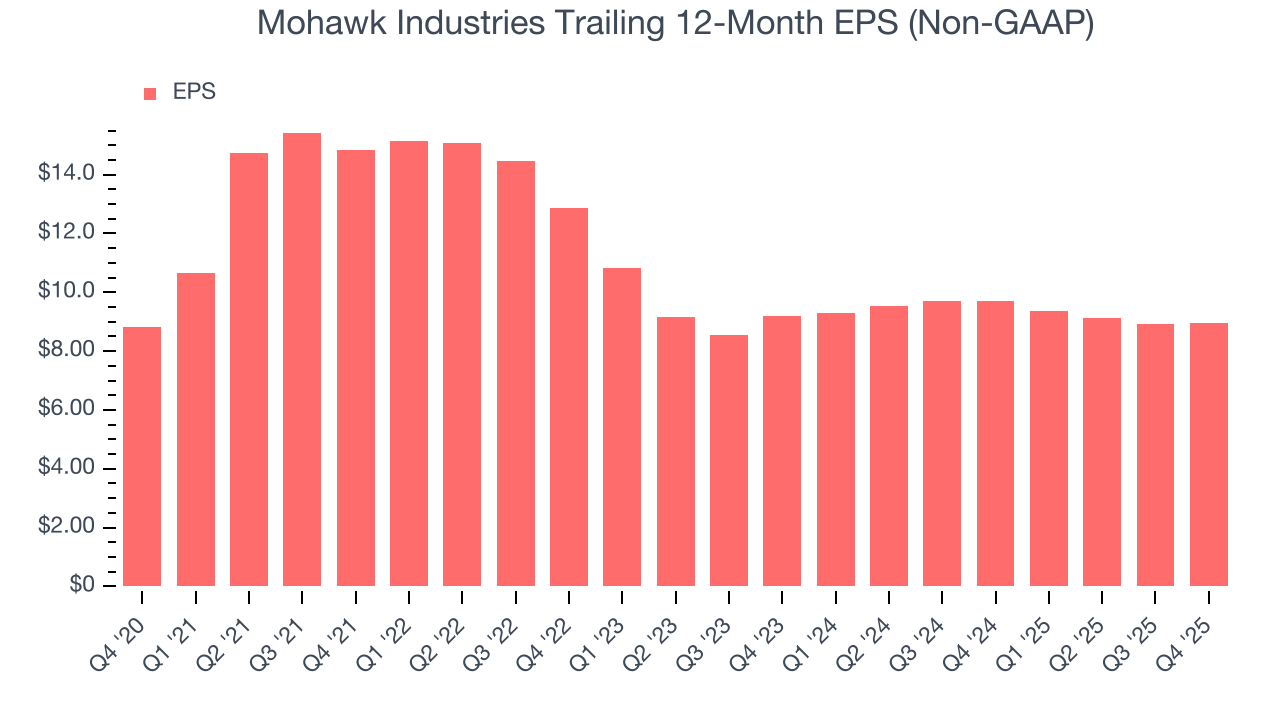
In Q4, Mohawk Industries reported adjusted EPS of $2, up from $1.95 in the same quarter last year. This print beat analysts’ estimates by 1.1%. Over the next 12 months, Wall Street expects Mohawk Industries’s full-year EPS of $8.96 to grow 9.6%.
8. Cash Is King
Although earnings are undoubtedly valuable for assessing company performance, we believe cash is king because you can’t use accounting profits to pay the bills.
Mohawk Industries has shown poor cash profitability over the last two years, giving the company limited opportunities to return capital to shareholders. Its free cash flow margin averaged 6%, lousy for a consumer discretionary business.
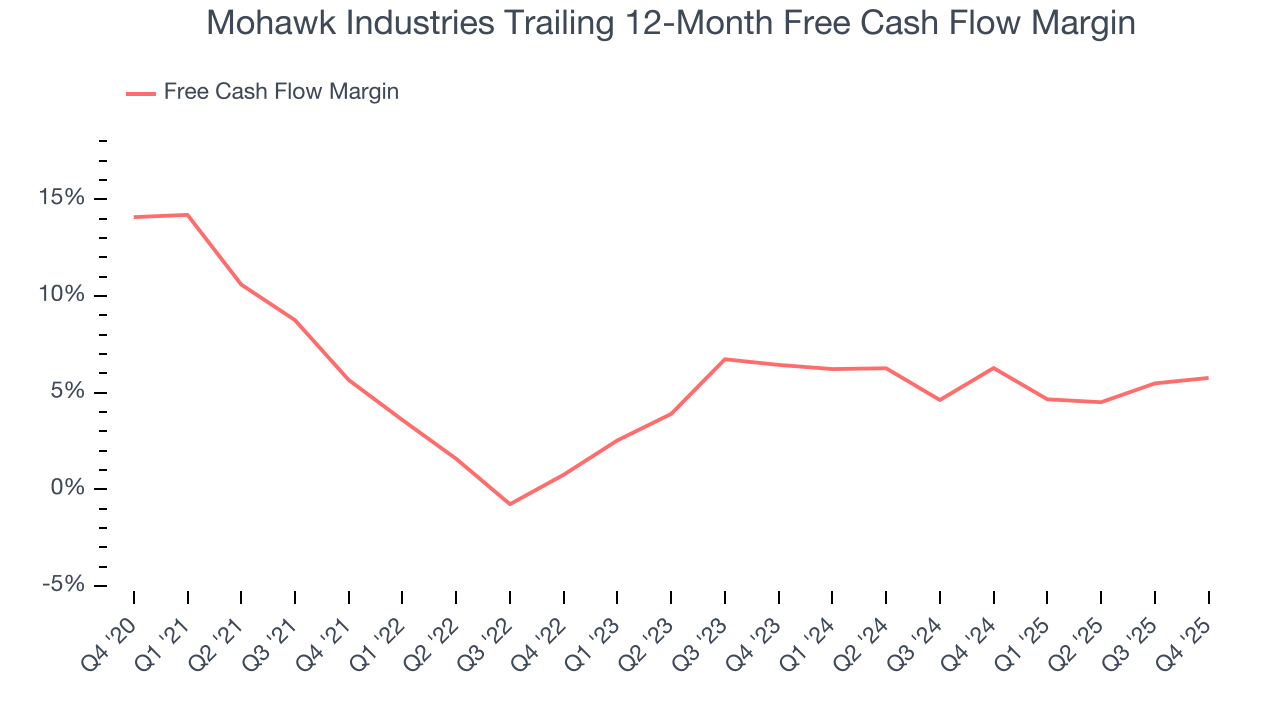
Mohawk Industries’s free cash flow clocked in at $270.2 million in Q4, equivalent to a 10% margin. This result was good as its margin was 1.1 percentage points higher than in the same quarter last year, but we wouldn’t read too much into the short term because investment needs can be seasonal, leading to temporary swings. Long-term trends are more important.
Over the next year, analysts’ consensus estimates show they’re expecting Mohawk Industries’s free cash flow margin of 5.8% for the last 12 months to remain the same.
9. Return on Invested Capital (ROIC)
EPS and free cash flow tell us whether a company was profitable while growing its revenue. But was it capital-efficient? Enter ROIC, a metric showing how much operating profit a company generates relative to the money it has raised (debt and equity).
Mohawk Industries historically did a mediocre job investing in profitable growth initiatives. Its five-year average ROIC was 3.3%, lower than the typical cost of capital (how much it costs to raise money) for consumer discretionary companies.
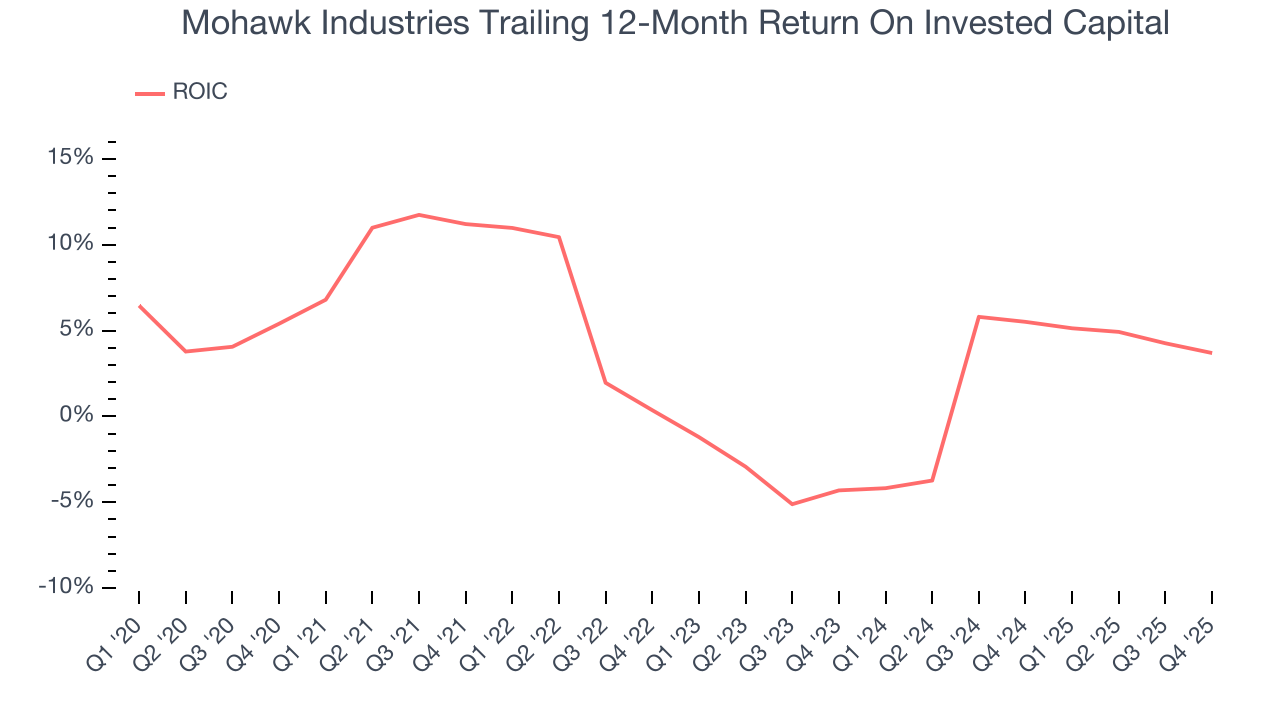
We like to invest in businesses with high returns, but the trend in a company’s ROIC is what often surprises the market and moves the stock price. Unfortunately, Mohawk Industries’s ROIC averaged 1.2 percentage point decreases each year over the last few years. Paired with its already low returns, these declines suggest its profitable growth opportunities are few and far between.
10. Balance Sheet Assessment
Mohawk Industries reported $856.1 million of cash and $2.46 billion of debt on its balance sheet in the most recent quarter. As investors in high-quality companies, we primarily focus on two things: 1) that a company’s debt level isn’t too high and 2) that its interest payments are not excessively burdening the business.
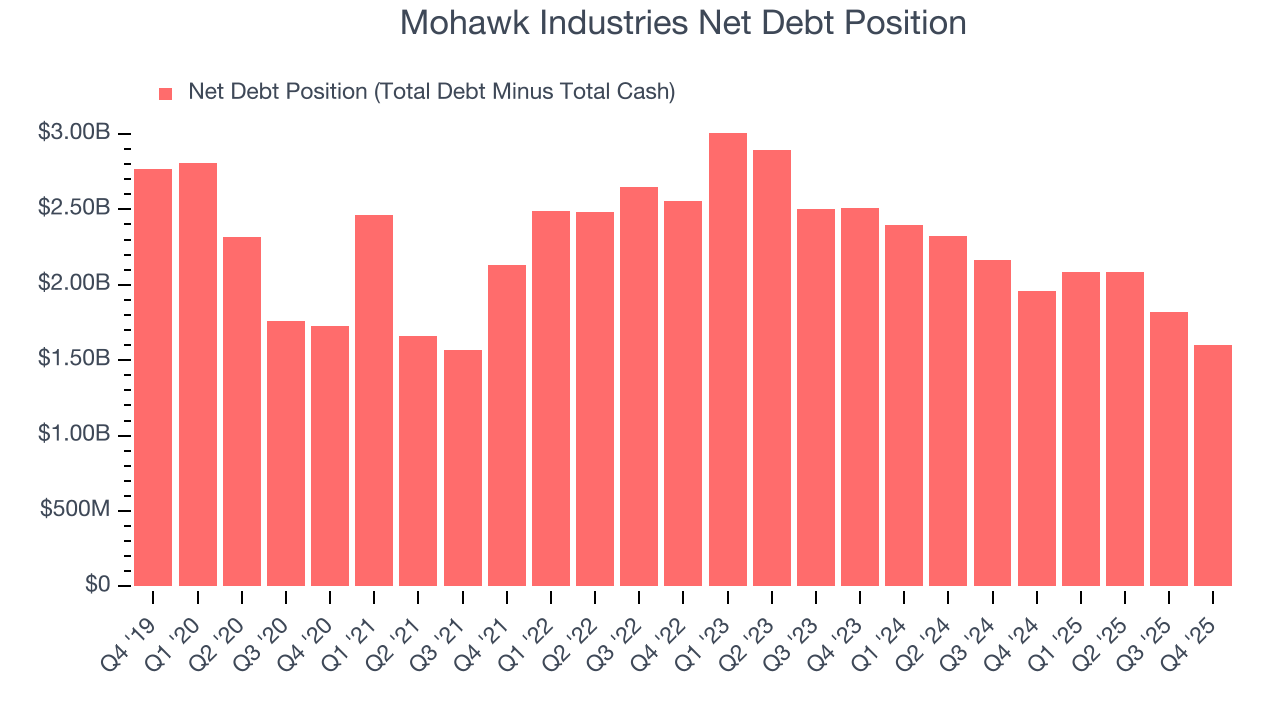
With $1.3 billion of EBITDA over the last 12 months, we view Mohawk Industries’s 1.2× net-debt-to-EBITDA ratio as safe. We also see its $15.4 million of annual interest expenses as appropriate. The company’s profits give it plenty of breathing room, allowing it to continue investing in growth initiatives.
11. Key Takeaways from Mohawk Industries’s Q4 Results
It was good to see Mohawk Industries narrowly top analysts’ revenue expectations this quarter. On the other hand, its EPS guidance for next quarter missed and its EBITDA fell short of Wall Street’s estimates. Overall, this was a weaker quarter. The stock traded up 3.1% to $137.54 immediately after reporting.
12. Is Now The Time To Buy Mohawk Industries?
Updated: March 20, 2026 at 10:12 PM EDT
Are you wondering whether to buy Mohawk Industries or pass? We urge investors to not only consider the latest earnings results but also longer-term business quality and valuation as well.
We see the value of companies helping consumers, but in the case of Mohawk Industries, we’re out. On top of that, Mohawk Industries’s Forecasted free cash flow margin for next year suggests the company will fail to improve its cash conversion, and its weak EPS growth over the last five years shows it’s failed to produce meaningful profits for shareholders.
Mohawk Industries’s P/E ratio based on the next 12 months is 10.2x. While this valuation is reasonable, we don’t see a big opportunity at the moment. There are better stocks to buy right now.
Wall Street analysts have a consensus one-year price target of $144 on the company (compared to the current share price of $96.17).
Although the price target is bullish, readers should exercise caution because analysts tend to be overly optimistic. The firms they work for, often big banks, have relationships with companies that extend into fundraising, M&A advisory, and other rewarding business lines. As a result, they typically hesitate to say bad things for fear they will lose out. We at StockStory do not suffer from such conflicts of interest, so we’ll always tell it like it is.