
RTX (RTX)
We’re cautious of RTX. Its sales have underperformed and its low returns on capital show it has few growth opportunities.― StockStory Analyst Team
1. News


2. Summary
Why RTX Is Not Exciting
Originally focused on refrigeration technology, Raytheon (NSYE:RTX) provides a a variety of products and services to the aerospace and defense industries.
- Underwhelming 4.5% return on capital reflects management’s difficulties in finding profitable growth opportunities
- Estimated sales growth of 5.6% for the next 12 months implies demand will slow from its two-year trend
- On the plus side, its performance over the past five years shows its incremental sales were more profitable, as its annual earnings per share growth of 12.4% outpaced its revenue gains


RTX falls short of our expectations. There are more promising alternatives.
Why There Are Better Opportunities Than RTX


At $204.94 per share, RTX trades at 29.7x forward P/E. This multiple is higher than that of industrials peers; it’s also rich for the top-line growth of the company. Not a great combination.
We’d rather invest in similarly-priced but higher-quality companies with more reliable earnings growth.
3. RTX (RTX) Research Report: Q4 CY2025 Update
Aerospace and defense company Raytheon (NYSE:RTX) beat Wall Street’s revenue expectations in Q4 CY2025, with sales up 12.1% year on year to $24.24 billion. The company expects the full year’s revenue to be around $92.5 billion, close to analysts’ estimates. Its non-GAAP profit of $1.55 per share was 5.3% above analysts’ consensus estimates.
RTX (RTX) Q4 CY2025 Highlights:
- Revenue: $24.24 billion vs analyst estimates of $22.65 billion (12.1% year-on-year growth, 7% beat)
- Adjusted EPS: $1.55 vs analyst estimates of $1.47 (5.3% beat)
- Adjusted EBITDA: $3.94 billion vs analyst estimates of $3.59 billion (16.2% margin, 9.6% beat)
- Adjusted EPS guidance for the upcoming financial year 2026 is $6.70 at the midpoint, in line with analyst estimates
- Operating Margin: 10.7%, in line with the same quarter last year
- Free Cash Flow Margin: 13.2%, up from 2.3% in the same quarter last year
- Organic Revenue rose 14% year on year (beat)
- Market Capitalization: $260.3 billion
Company Overview
Originally focused on refrigeration technology, Raytheon (NSYE:RTX) provides a a variety of products and services to the aerospace and defense industries.
Raytheon’s diverse product portfolio can be distilled into three core categories: defense (i.e., missiles), aerospace (i.e., engines and power units), and technology for space systems, cybersecurity, and advanced sensors.
Raytheon sells its products to government agencies around the globe, as well as parts and components to commercial airlines. Government agencies use Raytheon’s defense solutions such as radars and missile systems, while products such as traffic control and weather monitoring systems find utility in civilian and military use.
The company typically generates revenue from long-term contracts, secured through its direct sales teams or competitive bidding processes. Overseas, Raytheon conducts international sales through direct negotiations and government-to-government agreements. The company supplements the initial sale of its products with aftermarket services and long-term maintenance agreements.
4. Defense Contractors
Defense contractors typically require technical expertise and government clearance. Companies in this sector can also enjoy long-term contracts with government bodies, leading to more predictable revenues. Combined, these factors create high barriers to entry and can lead to limited competition. Lately, geopolitical tensions–whether it be Russia’s invasion of Ukraine or China’s aggression towards Taiwan–highlight the need for defense spending. On the other hand, demand for these products can ebb and flow with defense budgets and even who is president, as different administrations can have vastly different ideas of how to allocate federal funds.
Raytheon’s peers and competitors include Lockheed Martin (NYSE:LMT), Boeing (NYSE:BA), and Northrop Grumman (NYSE:NOC) among others.
5. Revenue Growth
A company’s long-term sales performance can indicate its overall quality. Any business can have short-term success, but a top-tier one grows for years. Regrettably, RTX’s sales grew at a mediocre 6.5% compounded annual growth rate over the last five years. This fell short of our benchmark for the industrials sector and is a poor baseline for our analysis.
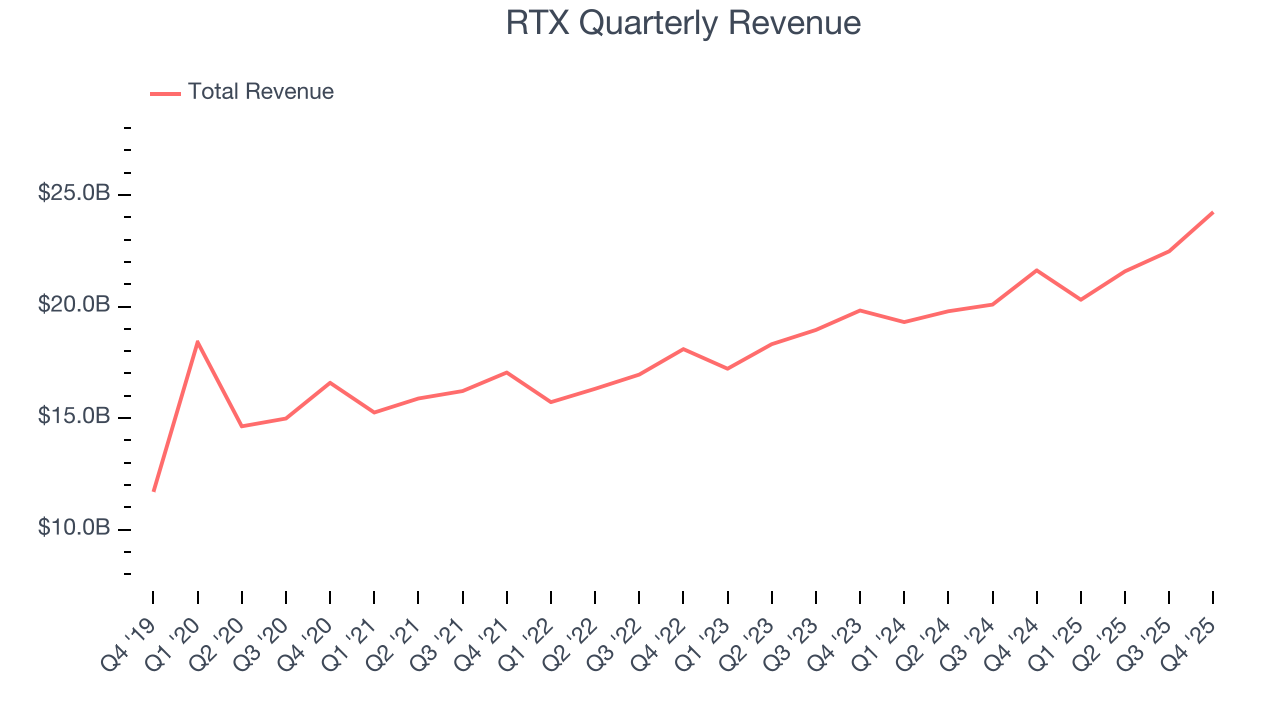
We at StockStory place the most emphasis on long-term growth, but within industrials, a half-decade historical view may miss cycles, industry trends, or a company capitalizing on catalysts such as a new contract win or a successful product line. RTX’s annualized revenue growth of 9.2% over the last two years is above its five-year trend, suggesting its demand recently accelerated. 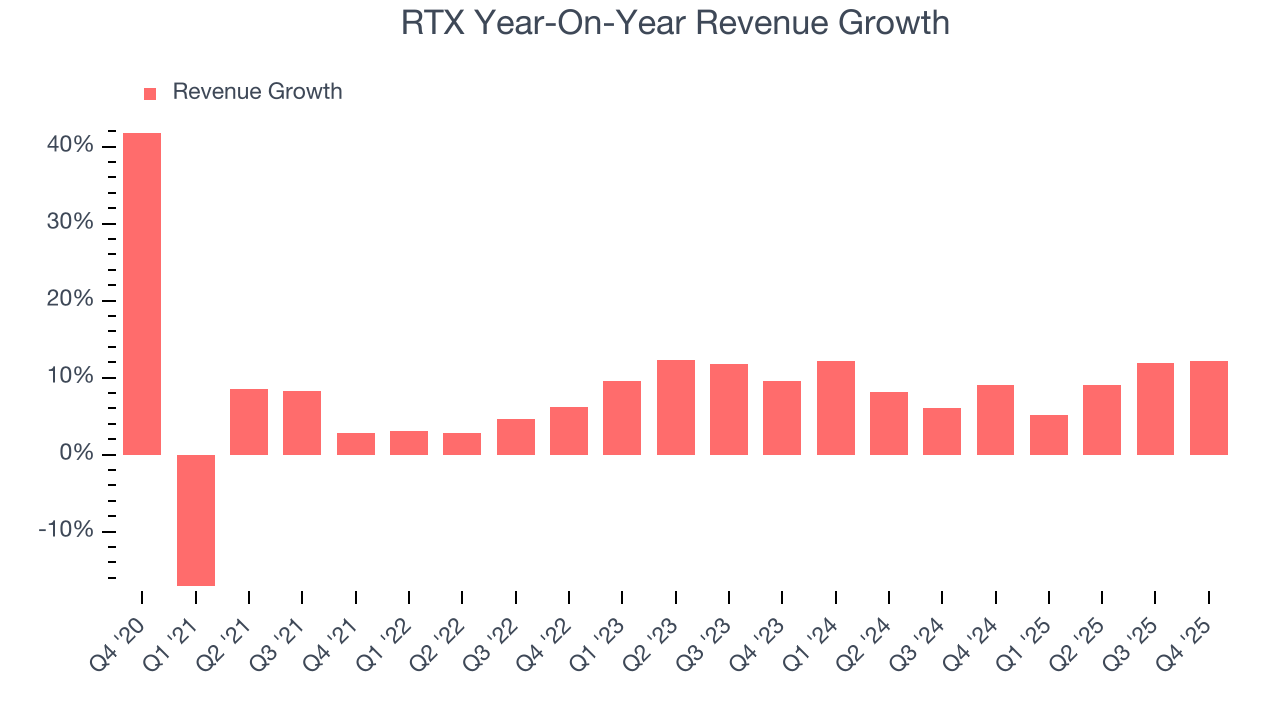
We can dig further into the company’s sales dynamics by analyzing its organic revenue, which strips out one-time events like acquisitions and currency fluctuations that don’t accurately reflect its fundamentals. Over the last two years, RTX’s organic revenue averaged 12.5% year-on-year growth. Because this number is better than its two-year revenue growth, we can see that some mixture of divestitures and foreign exchange rates dampened its headline results. 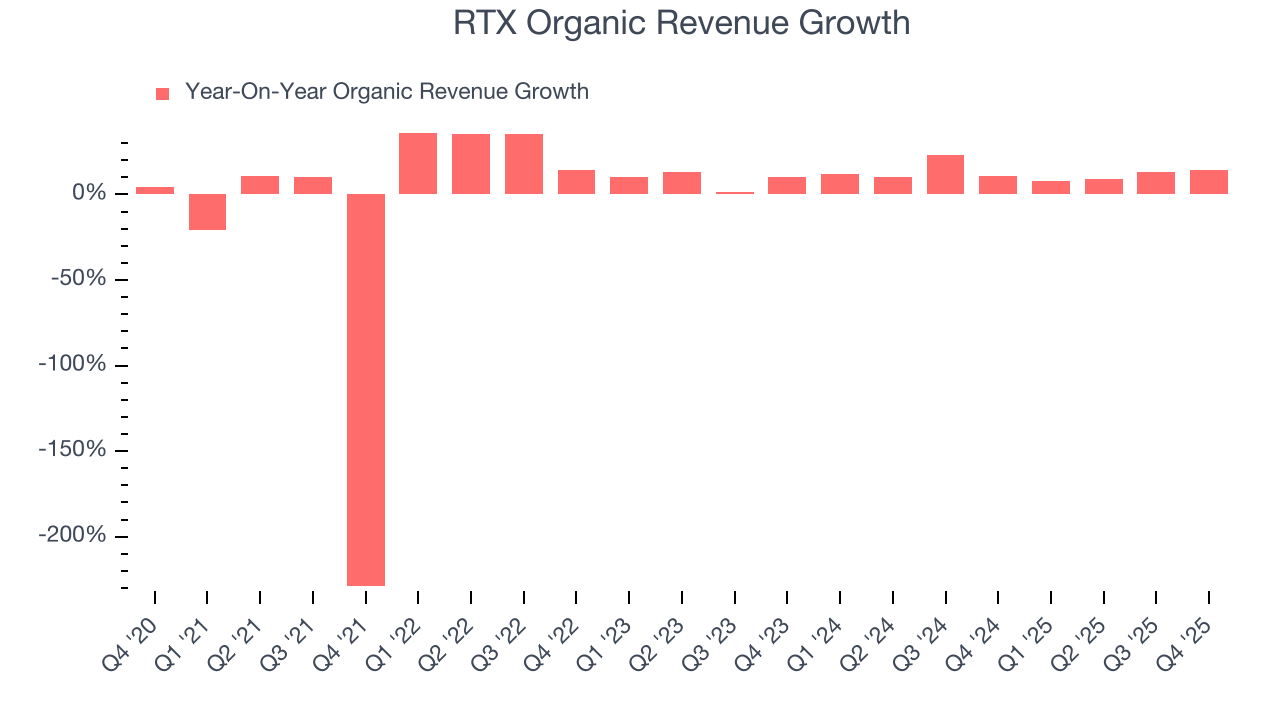
This quarter, RTX reported year-on-year revenue growth of 12.1%, and its $24.24 billion of revenue exceeded Wall Street’s estimates by 7%.
Looking ahead, sell-side analysts expect revenue to grow 4.6% over the next 12 months, a deceleration versus the last two years. This projection is underwhelming and suggests its products and services will face some demand challenges.
6. Operating Margin
Operating margin is a key measure of profitability. Think of it as net income - the bottom line - excluding the impact of taxes and interest on debt, which are less connected to business fundamentals.
RTX was profitable over the last five years but held back by its large cost base. Its average operating margin of 8% was weak for an industrials business.
On the plus side, RTX’s operating margin rose by 2.8 percentage points over the last five years, as its sales growth gave it operating leverage.
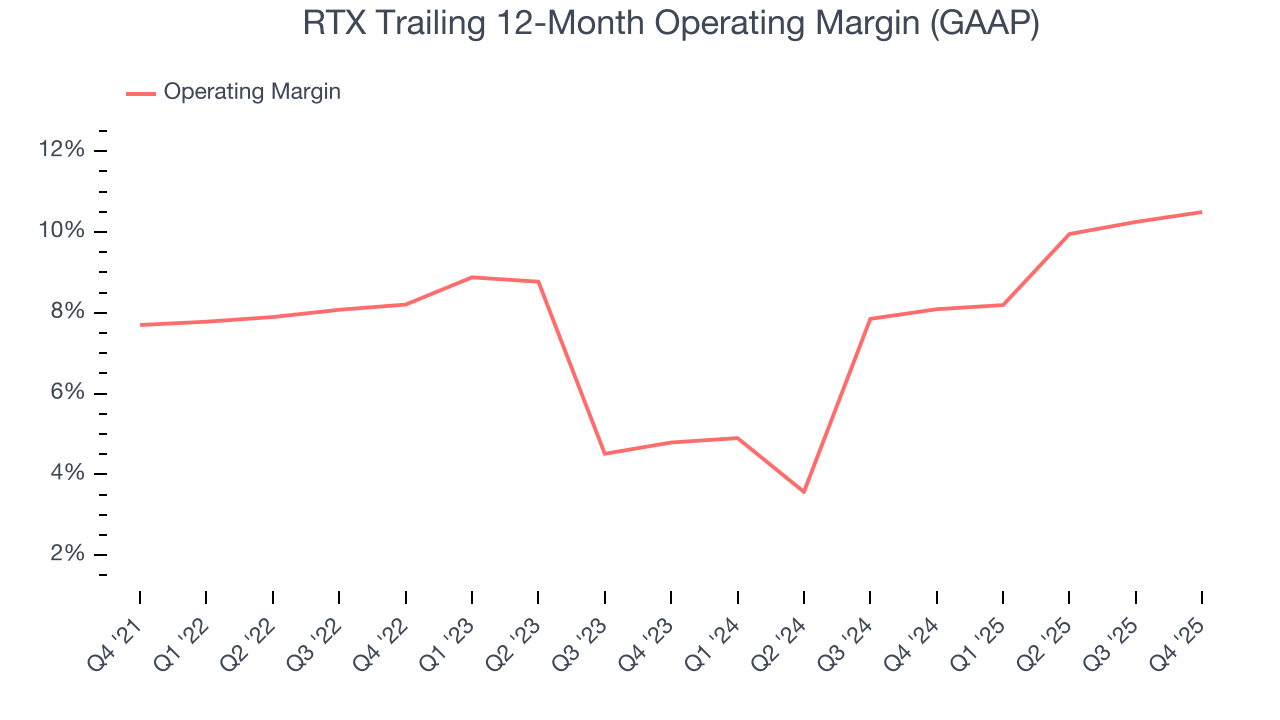
In Q4, RTX generated an operating margin profit margin of 10.7%, in line with the same quarter last year. This indicates the company’s overall cost structure has been relatively stable.
7. Earnings Per Share
Revenue trends explain a company’s historical growth, but the long-term change in earnings per share (EPS) points to the profitability of that growth – for example, a company could inflate its sales through excessive spending on advertising and promotions.
RTX’s EPS grew at a remarkable 14.2% compounded annual growth rate over the last five years, higher than its 6.5% annualized revenue growth. This tells us the company became more profitable on a per-share basis as it expanded.
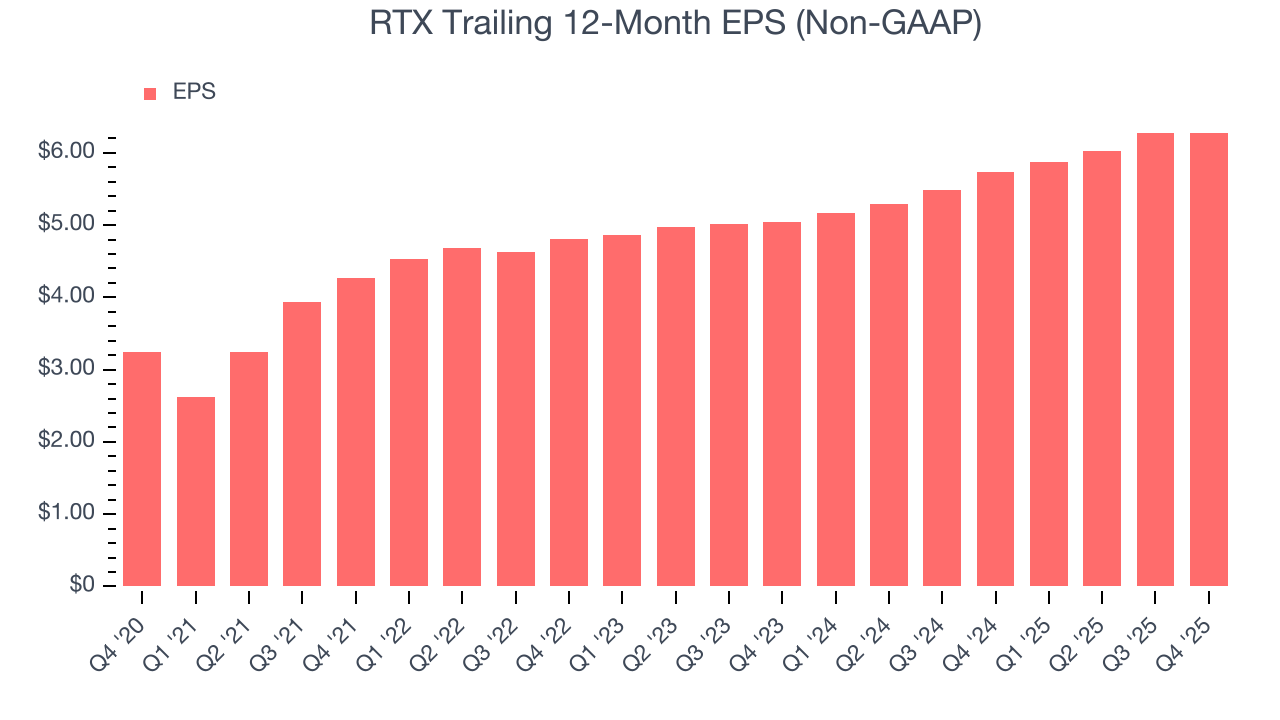
Diving into RTX’s quality of earnings can give us a better understanding of its performance. As we mentioned earlier, RTX’s operating margin was flat this quarter but expanded by 2.8 percentage points over the last five years. On top of that, its share count shrank by 10.1%. These are positive signs for shareholders because improving profitability and share buybacks turbocharge EPS growth relative to revenue growth. 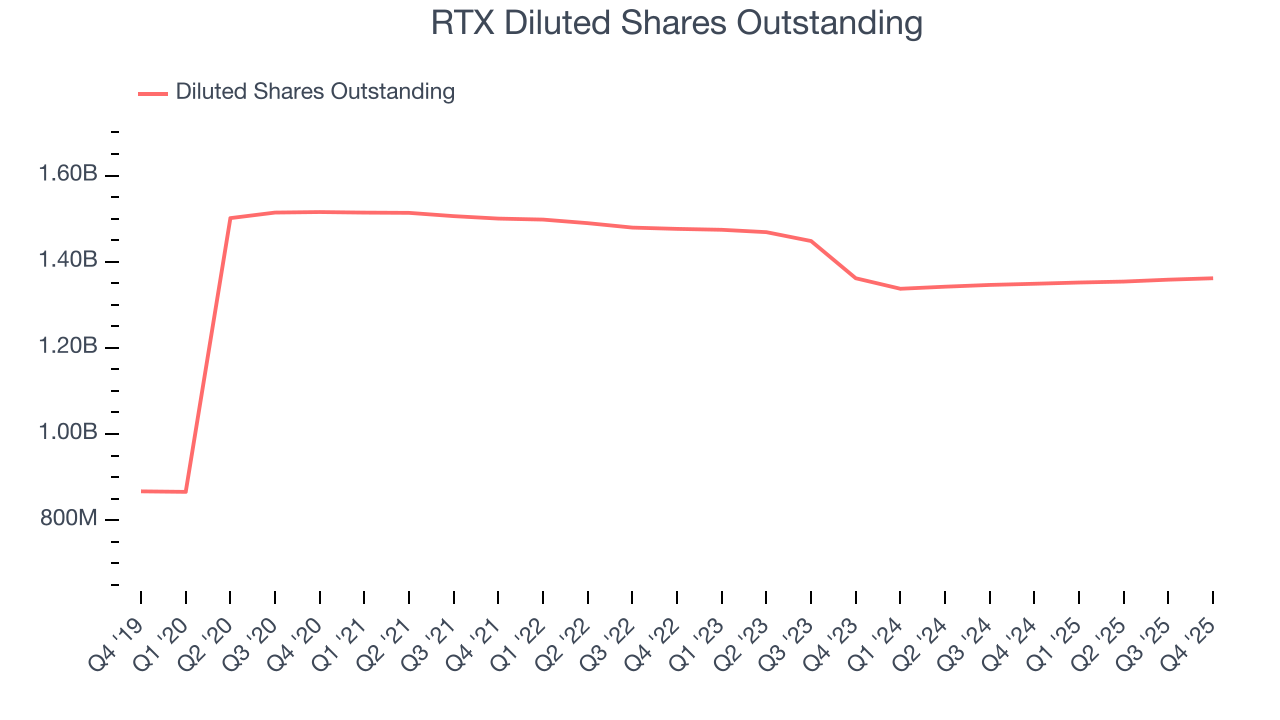
Like with revenue, we analyze EPS over a shorter period to see if we are missing a change in the business.
For RTX, its two-year annual EPS growth of 11.6% was lower than its five-year trend. We still think its growth was good and hope it can accelerate in the future.
In Q4, RTX reported adjusted EPS of $1.55, up from $1.54 in the same quarter last year. This print beat analysts’ estimates by 5.3%. Over the next 12 months, Wall Street expects RTX’s full-year EPS of $6.28 to grow 7.2%.
8. Cash Is King
Free cash flow isn't a prominently featured metric in company financials and earnings releases, but we think it's telling because it accounts for all operating and capital expenses, making it tough to manipulate. Cash is king.
RTX has shown decent cash profitability, giving it some flexibility to reinvest or return capital to investors. The company’s free cash flow margin averaged 7.4% over the last five years, slightly better than the broader industrials sector.
Taking a step back, we can see that RTX’s margin expanded by 1.2 percentage points during that time. This is encouraging because it gives the company more optionality.
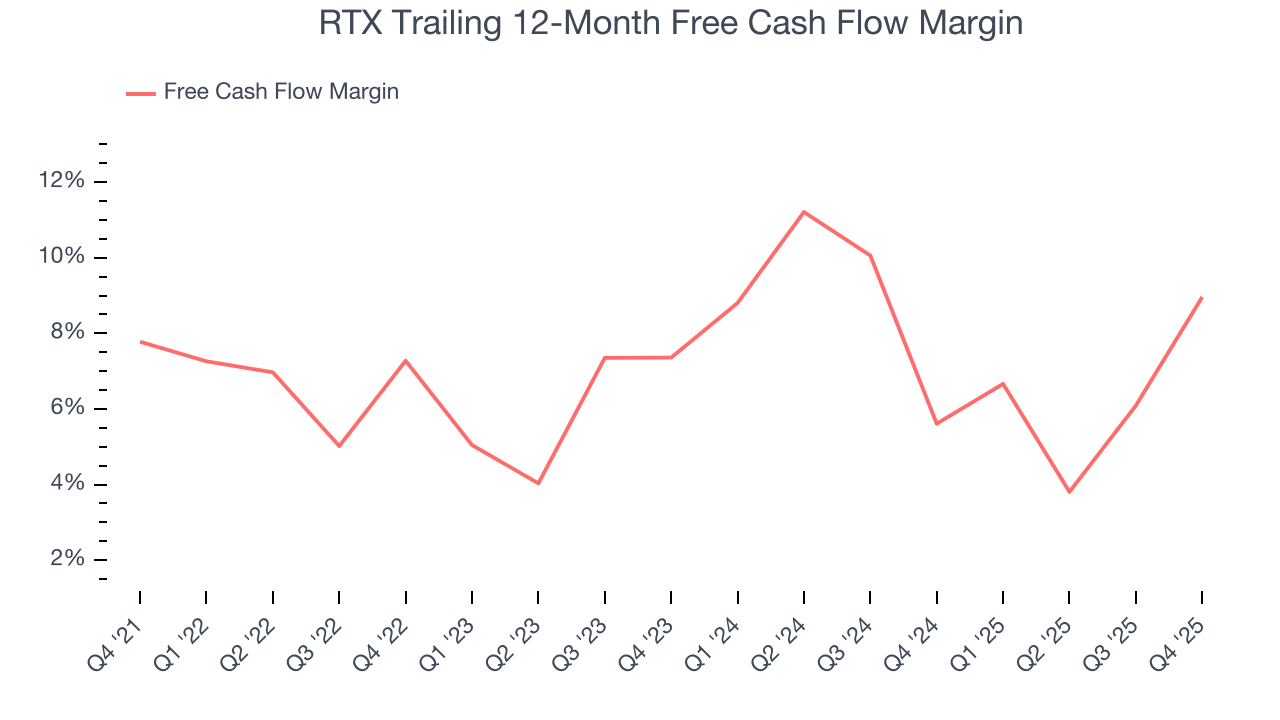
RTX’s free cash flow clocked in at $3.20 billion in Q4, equivalent to a 13.2% margin. This result was good as its margin was 10.9 percentage points higher than in the same quarter last year, building on its favorable historical trend.
9. Return on Invested Capital (ROIC)
EPS and free cash flow tell us whether a company was profitable while growing its revenue. But was it capital-efficient? Enter ROIC, a metric showing how much operating profit a company generates relative to the money it has raised (debt and equity).
RTX historically did a mediocre job investing in profitable growth initiatives. Its five-year average ROIC was 4.5%, lower than the typical cost of capital (how much it costs to raise money) for industrials companies.
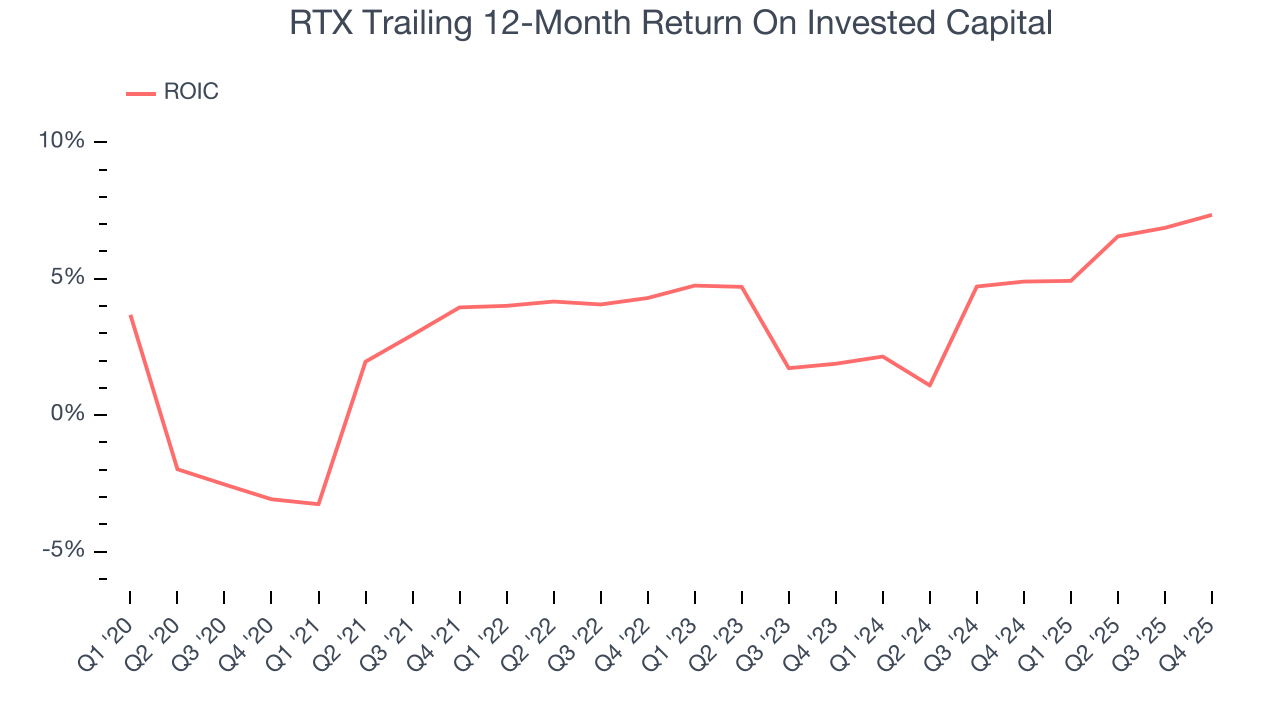
We like to invest in businesses with high returns, but the trend in a company’s ROIC is what often surprises the market and moves the stock price. On average, RTX’s ROIC increased by 2 percentage points annually over the last few years. This is a good sign, and if its returns keep rising, there’s a chance it could evolve into an investable business.
10. Balance Sheet Assessment
RTX reported $7.44 billion of cash and $39.51 billion of debt on its balance sheet in the most recent quarter. As investors in high-quality companies, we primarily focus on two things: 1) that a company’s debt level isn’t too high and 2) that its interest payments are not excessively burdening the business.
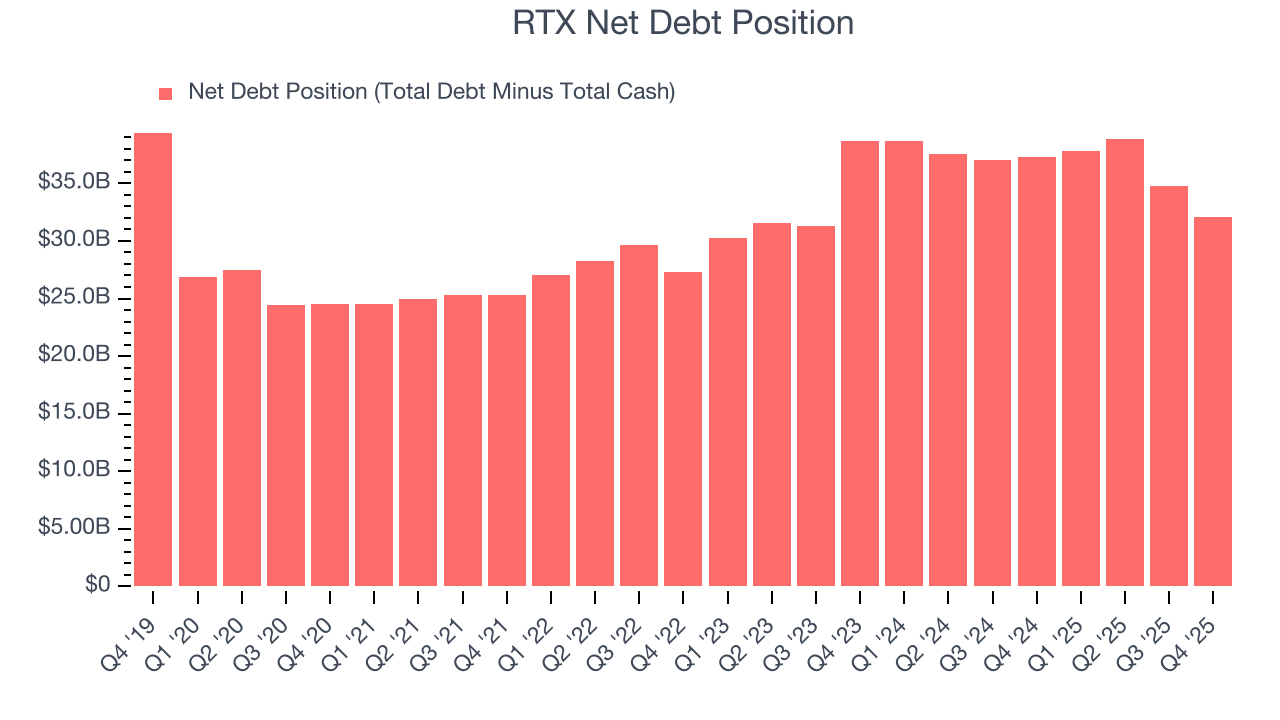
With $15.58 billion of EBITDA over the last 12 months, we view RTX’s 2.1× net-debt-to-EBITDA ratio as safe. We also see its $940 million of annual interest expenses as appropriate. The company’s profits give it plenty of breathing room, allowing it to continue investing in growth initiatives.
11. Key Takeaways from RTX’s Q4 Results
We were impressed by how significantly RTX blew past analysts’ organic revenue expectations this quarter. We were also excited its EBITDA outperformed Wall Street’s estimates by a wide margin. Zooming out, we think this quarter featured some important positives. The stock traded up 3.3% to $200.47 immediately after reporting.
12. Is Now The Time To Buy RTX?
Updated: March 15, 2026 at 11:53 PM EDT
Before making an investment decision, investors should account for RTX’s business fundamentals and valuation in addition to what happened in the latest quarter.
RTX isn’t a terrible business, but it isn’t one of our picks. First off, its revenue growth was mediocre over the last five years, and analysts don’t see anything changing over the next 12 months. And while RTX’s remarkable EPS growth over the last five years shows its profits are trickling down to shareholders, its relatively low ROIC suggests management has struggled to find compelling investment opportunities.
RTX’s P/E ratio based on the next 12 months is 29.7x. Investors with a higher risk tolerance might like the company, but we think the potential downside is too great. We're fairly confident there are better investments elsewhere.
Wall Street analysts have a consensus one-year price target of $217.16 on the company (compared to the current share price of $204.94).