
Teledyne (TDY)
We see potential in Teledyne. Its rare ability to win market share while pumping out profits is a feature its competitors envy.― StockStory Analyst Team
1. News


2. Summary
Why Teledyne Is Interesting
Playing a role in mapping the ocean floor as we know it today, Teledyne (NYSE:TDY) offers digital imaging and instrumentation products for various industries.
- Healthy operating margin shows it’s a well-run company with efficient processes, and its profits increased over the last five years as it scaled
- Robust free cash flow profile gives it the flexibility to invest in growth initiatives or return capital to shareholders, and its growing cash flow gives it even more resources to deploy
- On the flip side, its below-average returns on capital indicate management struggled to find compelling investment opportunities


Teledyne almost passes our quality test. This company has a place on your watchlist.


3. Teledyne (TDY) Research Report: Q4 CY2025 Update
Digital imaging and instrumentation provider Teledyne (NYSE:TDY) reported Q4 CY2025 results exceeding the market’s revenue expectations, with sales up 7.3% year on year to $1.61 billion. Its non-GAAP profit of $6.30 per share was 8% above analysts’ consensus estimates.
Teledyne (TDY) Q4 CY2025 Highlights:
- Revenue: $1.61 billion vs analyst estimates of $1.57 billion (7.3% year-on-year growth, 2.5% beat)
- Adjusted EPS: $6.30 vs analyst estimates of $5.83 (8% beat)
- Adjusted EBITDA: $423 million vs analyst estimates of $396.3 million (26.2% margin, 6.7% beat)
- Adjusted EPS guidance for the upcoming financial year 2026 is $23.65 at the midpoint, in line with analyst estimates
- Operating Margin: 20.4%, up from 15.8% in the same quarter last year
- Free Cash Flow Margin: 21%, similar to the same quarter last year
- Market Capitalization: $26.59 billion
Company Overview
Playing a role in mapping the ocean floor as we know it today, Teledyne (NYSE:TDY) offers digital imaging and instrumentation products for various industries.
Initially part of the conglomerate Allegheny Teledyne, Teledyne emerged as a separate entity in 1999. As a holding company, its initial; portfolio of 19 companies grew to encompass nearly 100 companies by 2011. While it once had diverse interests spanning insurance, dental appliances, specialty metals, and aerospace electronics, Teledyne now focuses on digital imaging and instrumentation.
Specifically, Teledyne specializes in industrial, scientific, and healthcare applications such as diagnosing medical conditions. Its products range from digital cameras and sensors to imaging software. In addition, the company focuses on precision instruments that help measure and analyze things like temperature or pressure. These tools are essential for research, quality control, and safety in the aerospace & defense and industrial markets.
Teledyne sells its products through its direct sales force and distributors. The company caters to and engages in long-term contracts with governments, big corporations, and research institutions. Specifically, its long-term supply agreements, government contracts, and project-based contracts ensure stability and predictability in revenue streams while offering volume discounts with a lower per-unit cost for the customer.
4. Inspection Instruments
Measurement and inspection instrument companies may enjoy more steady demand because products such as water meters are non-discretionary and mandated for replacement at predictable intervals. In the last decade, digitization and data collection have driven innovation in the space, leading to incremental sales. But like the broader industrials sector, measurement and inspection instrument companies are at the whim of economic cycles. Interest rates, for example, can greatly impact civil, commercial, and residential construction projects that drive demand.
Competitors offering similar products include L3Harris (NYSE:LHX) and Garmin (NASDAQ:GRMN).
5. Revenue Growth
A company’s long-term performance is an indicator of its overall quality. Any business can experience short-term success, but top-performing ones enjoy sustained growth for years. Luckily, Teledyne’s sales grew at an exceptional 14.7% compounded annual growth rate over the last five years. Its growth beat the average industrials company and shows its offerings resonate with customers.
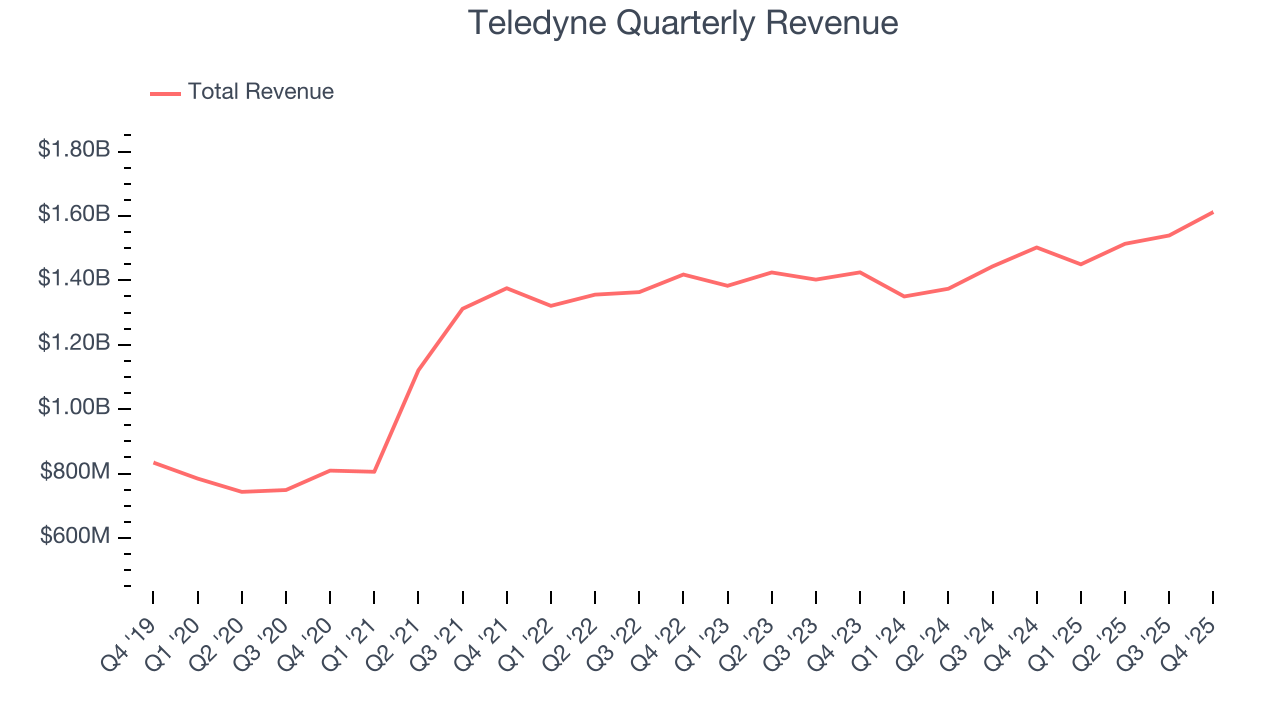
Long-term growth is the most important, but within industrials, a half-decade historical view may miss new industry trends or demand cycles. Teledyne’s recent performance shows its demand has slowed significantly as its annualized revenue growth of 4.2% over the last two years was well below its five-year trend. 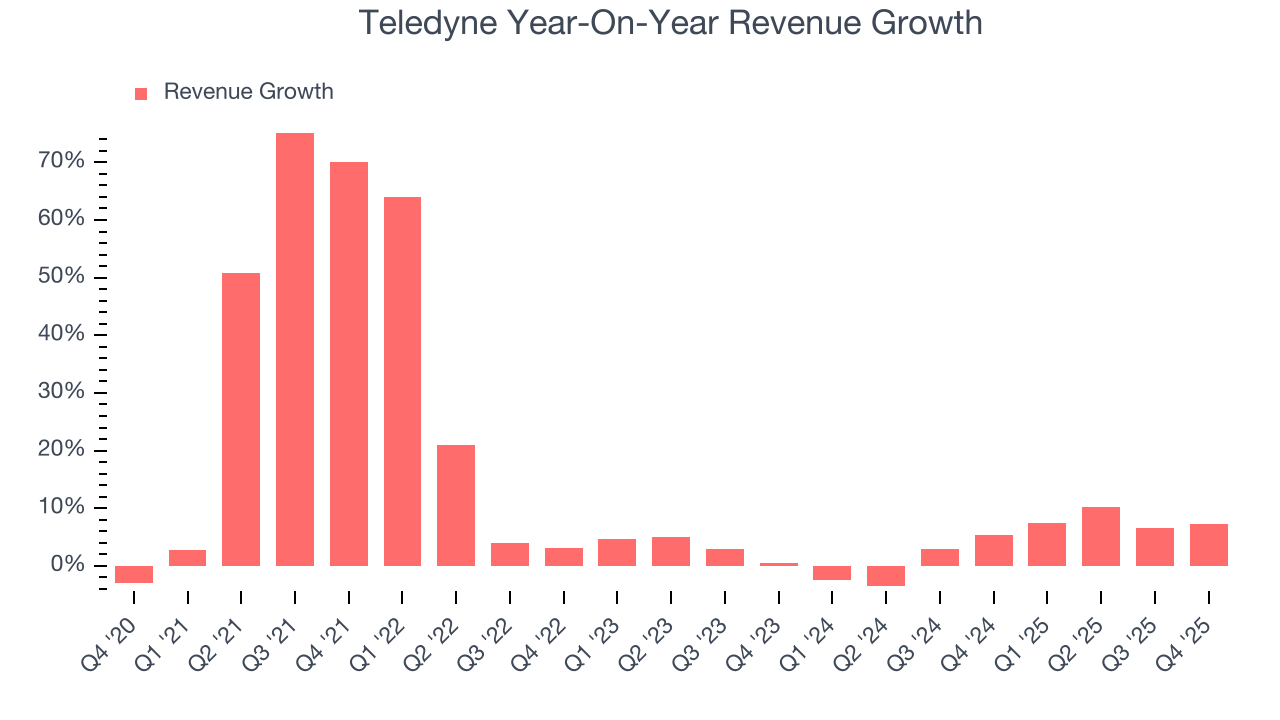
This quarter, Teledyne reported year-on-year revenue growth of 7.3%, and its $1.61 billion of revenue exceeded Wall Street’s estimates by 2.5%.
Looking ahead, sell-side analysts expect revenue to grow 4.1% over the next 12 months, similar to its two-year rate. This projection is underwhelming and suggests its newer products and services will not catalyze better top-line performance yet.
6. Gross Margin & Pricing Power
Teledyne has best-in-class unit economics for an industrials company, enabling it to invest in areas such as research and development. Its margin also signals it sells differentiated products, not commodities. As you can see below, it averaged an elite 42.7% gross margin over the last five years. Said differently, roughly $42.71 was left to spend on selling, marketing, R&D, and general administrative overhead for every $100 in revenue. 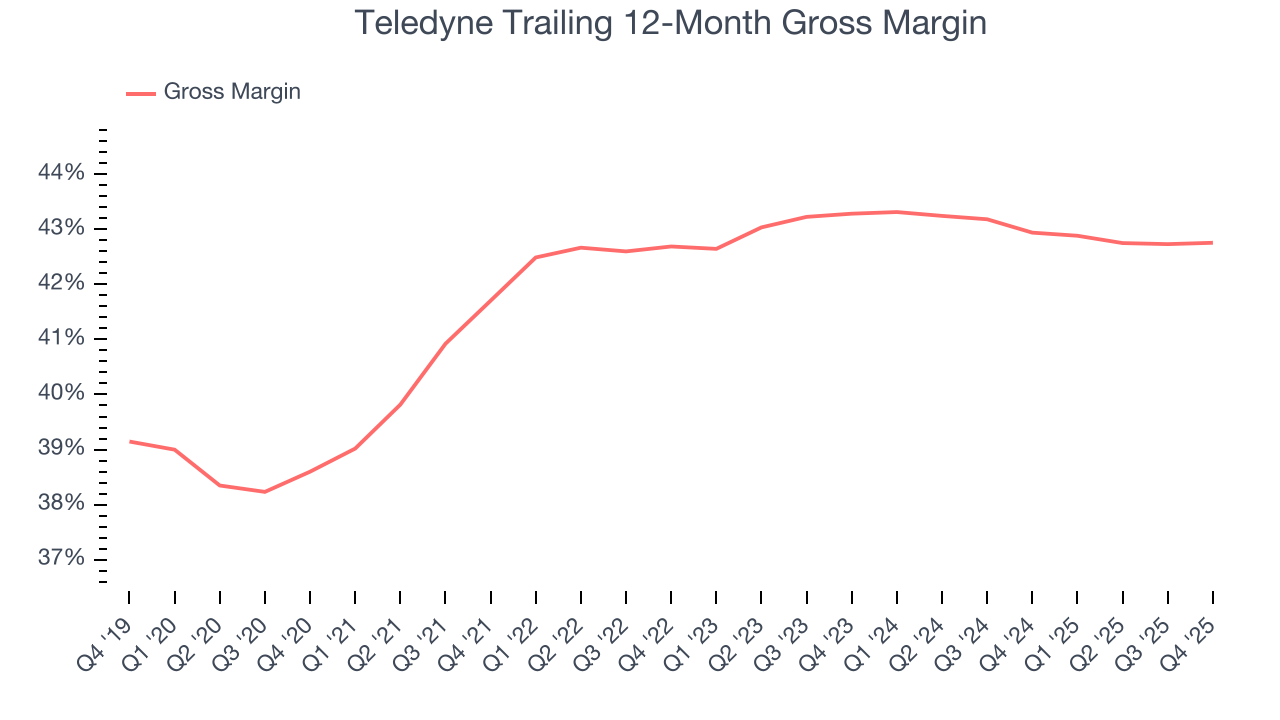
In Q4, Teledyne produced a 42.9% gross profit margin, in line with the same quarter last year. On a wider time horizon, the company’s full-year margin has remained steady over the past four quarters, suggesting its input costs (such as raw materials and manufacturing expenses) have been stable and it isn’t under pressure to lower prices.
7. Operating Margin
Operating margin is one of the best measures of profitability because it tells us how much money a company takes home after procuring and manufacturing its products, marketing and selling those products, and most importantly, keeping them relevant through research and development.
Teledyne has been a well-oiled machine over the last five years. It demonstrated elite profitability for an industrials business, boasting an average operating margin of 17.3%. This result isn’t surprising as its high gross margin gives it a favorable starting point.
Looking at the trend in its profitability, Teledyne’s operating margin rose by 5.3 percentage points over the last five years, as its sales growth gave it immense operating leverage.
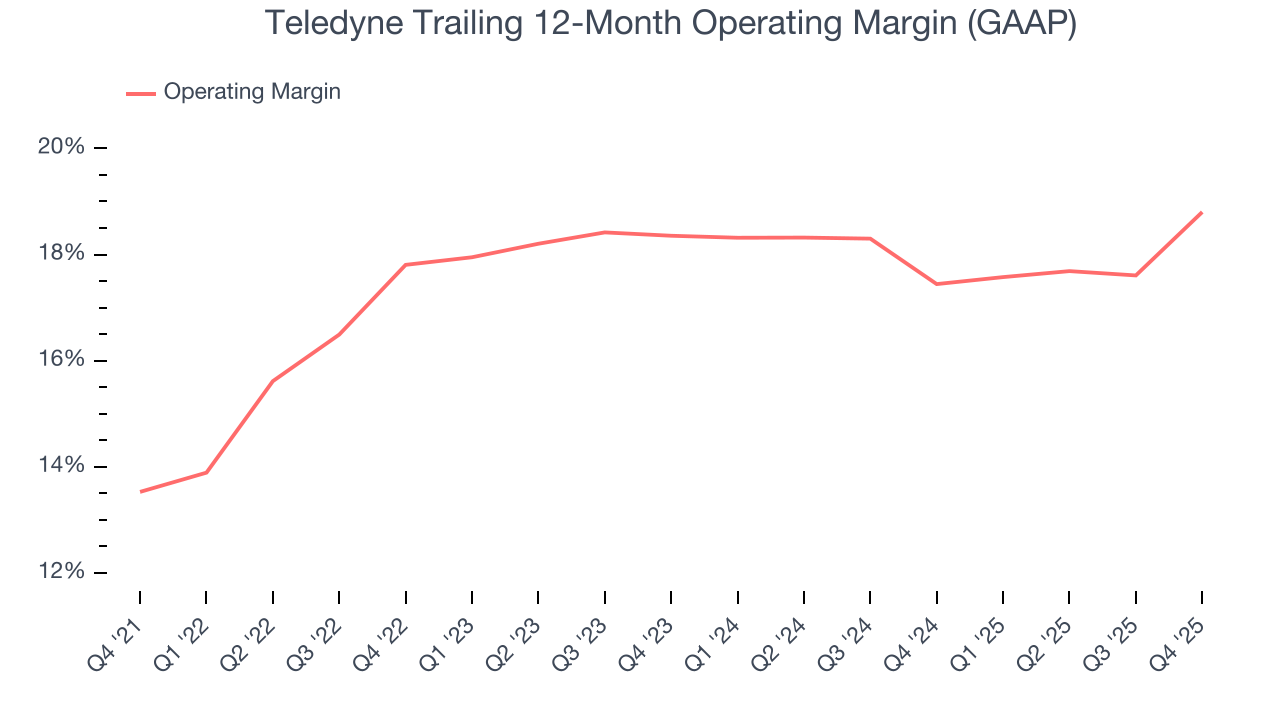
In Q4, Teledyne generated an operating margin profit margin of 20.4%, up 4.7 percentage points year on year. The increase was encouraging, and because its operating margin rose more than its gross margin, we can infer it was more efficient with expenses such as marketing, R&D, and administrative overhead.
8. Earnings Per Share
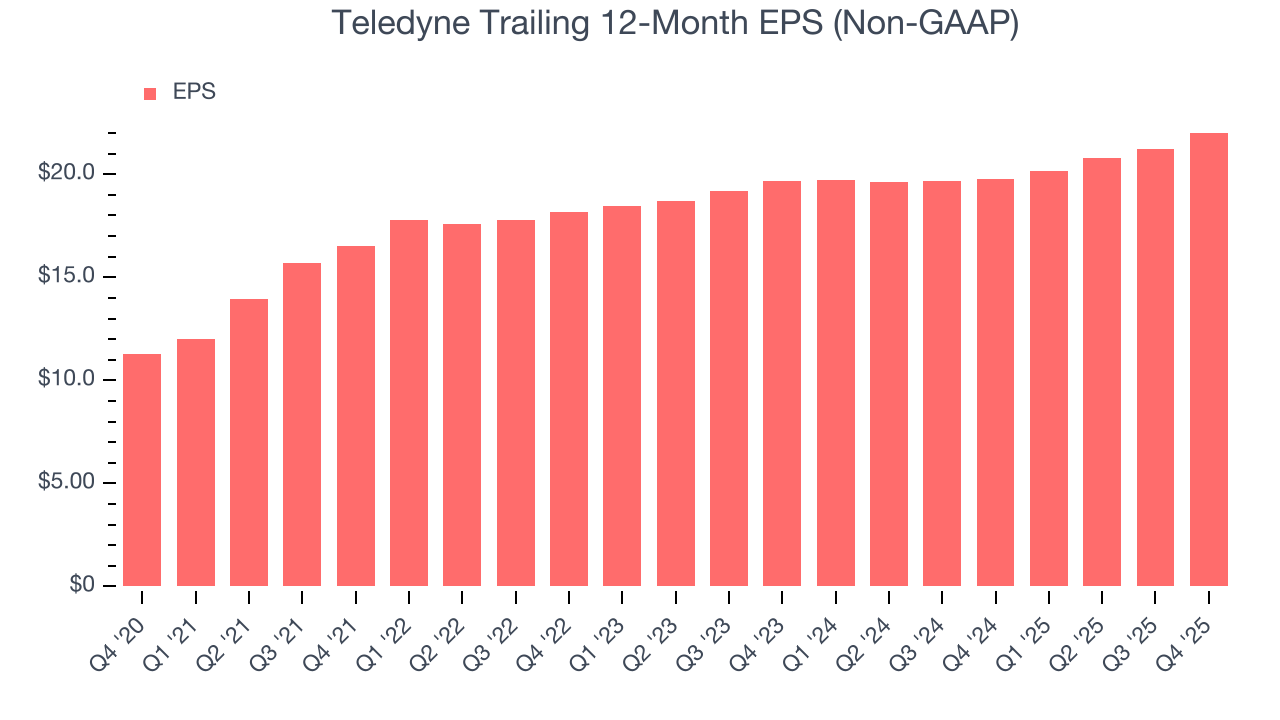
We track the long-term change in earnings per share (EPS) for the same reason as long-term revenue growth. Compared to revenue, however, EPS highlights whether a company’s growth is profitable.
Teledyne’s remarkable 14.4% annual EPS growth over the last five years aligns with its revenue performance. This tells us its incremental sales were profitable.
Like with revenue, we analyze EPS over a more recent period because it can provide insight into an emerging theme or development for the business.
For Teledyne, its two-year annual EPS growth of 5.8% was lower than its five-year trend. We hope its growth can accelerate in the future.
In Q4, Teledyne reported adjusted EPS of $6.30, up from $5.52 in the same quarter last year. This print beat analysts’ estimates by 8%. Over the next 12 months, Wall Street expects Teledyne’s full-year EPS of $22.02 to grow 6.9%.
9. Cash Is King
If you’ve followed StockStory for a while, you know we emphasize free cash flow. Why, you ask? We believe that in the end, cash is king, and you can’t use accounting profits to pay the bills.
Teledyne has shown terrific cash profitability, putting it in an advantageous position to invest in new products, return capital to investors, and consolidate the market during industry downturns. The company’s free cash flow margin was among the best in the industrials sector, averaging 14.6% over the last five years.
Taking a step back, we can see that Teledyne’s margin expanded by 1.9 percentage points during that time. This is encouraging because it gives the company more optionality.
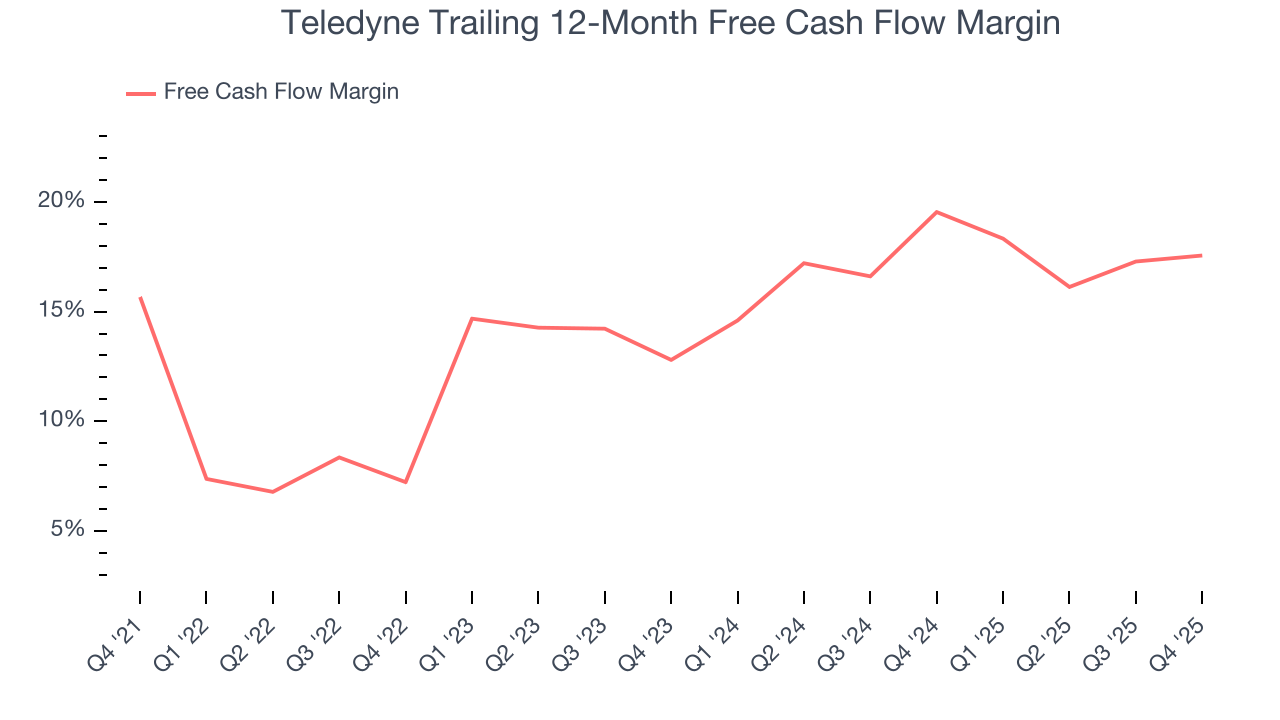
Teledyne’s free cash flow clocked in at $339.2 million in Q4, equivalent to a 21% margin. This cash profitability was in line with the comparable period last year and above its five-year average.
10. Return on Invested Capital (ROIC)
EPS and free cash flow tell us whether a company was profitable while growing its revenue. But was it capital-efficient? Enter ROIC, a metric showing how much operating profit a company generates relative to the money it has raised (debt and equity).
Teledyne historically did a mediocre job investing in profitable growth initiatives. Its five-year average ROIC was 6.5%, somewhat low compared to the best industrials companies that consistently pump out 20%+.
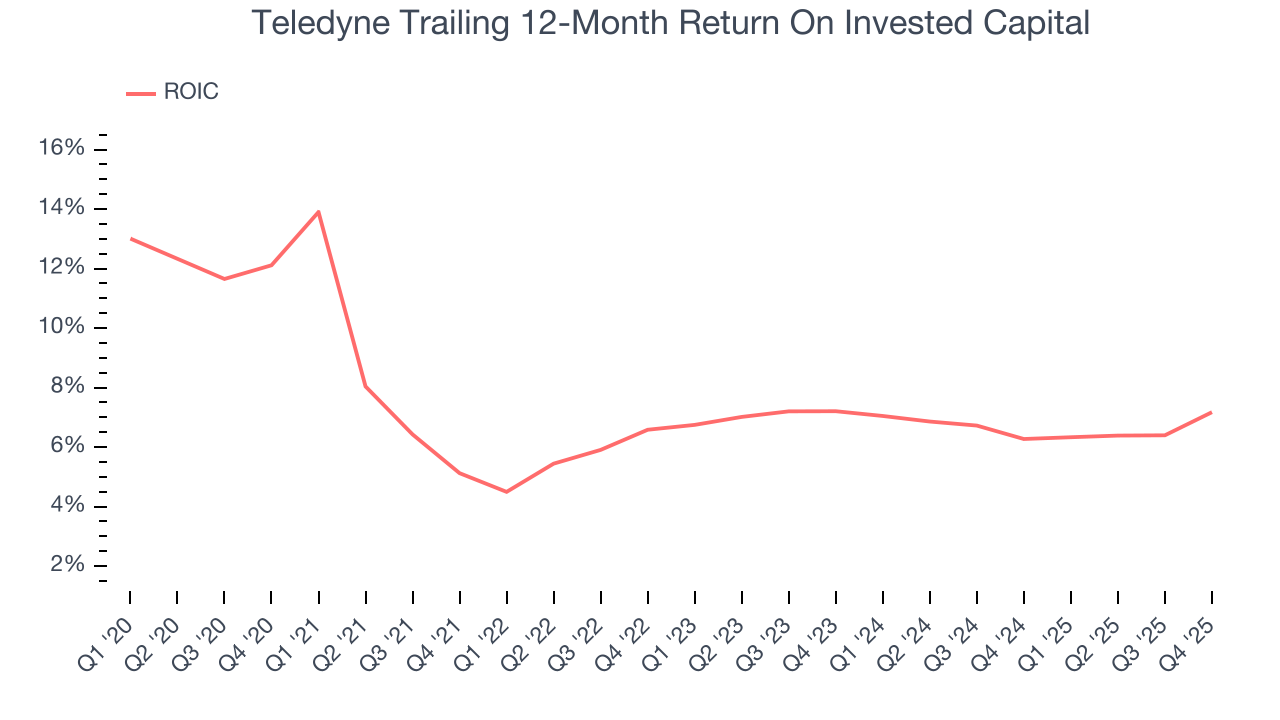
We like to invest in businesses with high returns, but the trend in a company’s ROIC is what often surprises the market and moves the stock price. Unfortunately, Teledyne’s ROIC has stayed the same over the last few years. If the company wants to become an investable business, it must improve its returns by generating more profitable growth.
11. Balance Sheet Assessment
Teledyne reported $352.4 million of cash and $2.48 billion of debt on its balance sheet in the most recent quarter. As investors in high-quality companies, we primarily focus on two things: 1) that a company’s debt level isn’t too high and 2) that its interest payments are not excessively burdening the business.
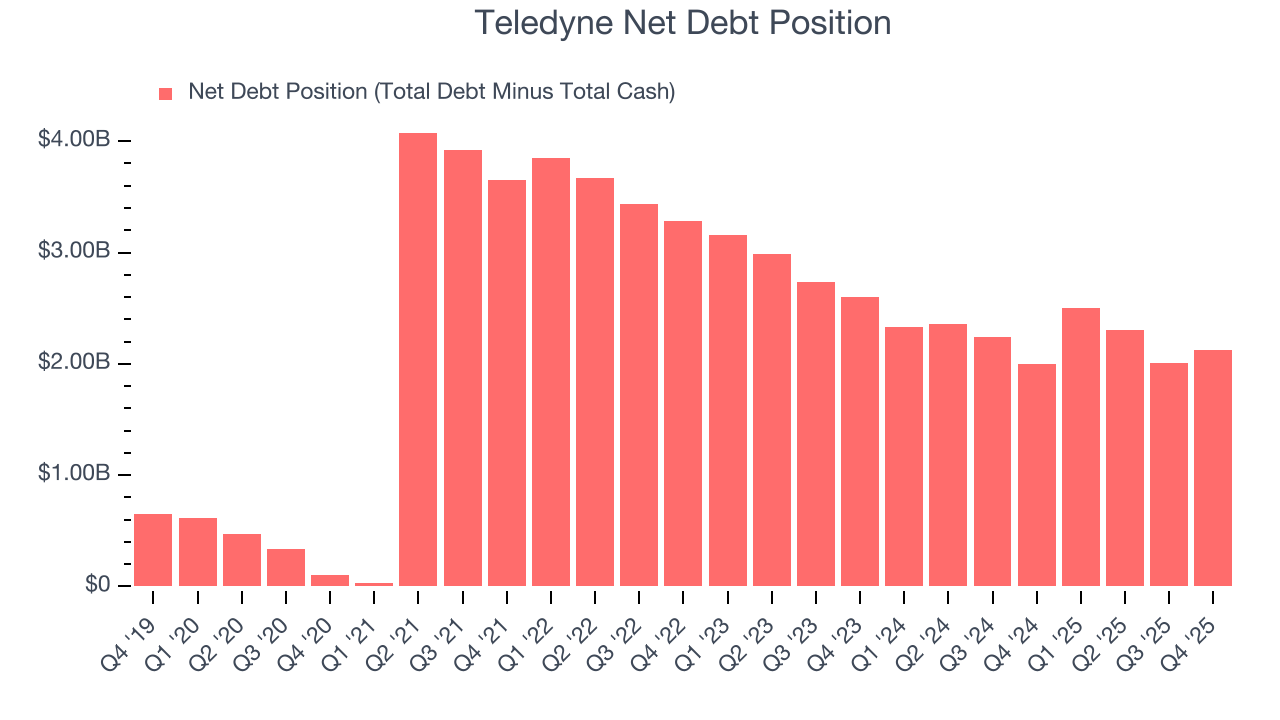
With $1.67 billion of EBITDA over the last 12 months, we view Teledyne’s 1.3× net-debt-to-EBITDA ratio as safe. We also see its $59.6 million of annual interest expenses as appropriate. The company’s profits give it plenty of breathing room, allowing it to continue investing in growth initiatives.
12. Key Takeaways from Teledyne’s Q4 Results
We enjoyed seeing Teledyne beat analysts’ EBITDA expectations this quarter. We were also glad its revenue outperformed Wall Street’s estimates. Overall, we think this was still a solid quarter with some key areas of upside. The stock remained flat at $568.96 immediately following the results.
13. Is Now The Time To Buy Teledyne?
Updated: March 19, 2026 at 11:11 PM EDT
When considering an investment in Teledyne, investors should account for its valuation and business qualities as well as what’s happened in the latest quarter.
We think Teledyne is a solid business. First off, its revenue growth was exceptional over the last five years. And while its relatively low ROIC suggests management has struggled to find compelling investment opportunities, its expanding operating margin shows the business has become more efficient. On top of that, its impressive operating margins show it has a highly efficient business model.
Teledyne’s P/E ratio based on the next 12 months is 26.6x. This valuation tells us that a lot of optimism is priced in. Teledyne is a good one to add to your watchlist - there are companies featuring superior fundamentals at the moment.
Wall Street analysts have a consensus one-year price target of $699.69 on the company (compared to the current share price of $635.12).