
Amkor (AMKR)
We’re cautious of Amkor. Its underwhelming revenue growth and failure to generate meaningful free cash flow is a concerning trend.― StockStory Analyst Team
1. News


2. Summary
Why We Think Amkor Will Underperform
Operating through a largely Asian facility footprint, Amkor Technologies (NASDAQ:AMKR) provides outsourced packaging and testing for semiconductors.
- Competitive supply chain dynamics and steep production costs are reflected in its low gross margin of 14.4%
- Weak free cash flow margin of 4.1% has deteriorated further over the last five years as its investments increased
- A consolation is that its acceptable returns on capital suggest management generated shareholder value by investing in profitable projects


Amkor doesn’t meet our quality criteria. You should search for better opportunities.
Why There Are Better Opportunities Than Amkor


At $48.00 per share, Amkor trades at 27.3x forward P/E. This multiple is lower than most semiconductor companies, but for good reason.
Cheap stocks can look like a great deal at first glance, but they can be value traps. They often have less earnings power, meaning there is more reliance on a re-rating to generate good returns - an unlikely scenario for low-quality companies.
3. Amkor (AMKR) Research Report: Q4 CY2025 Update
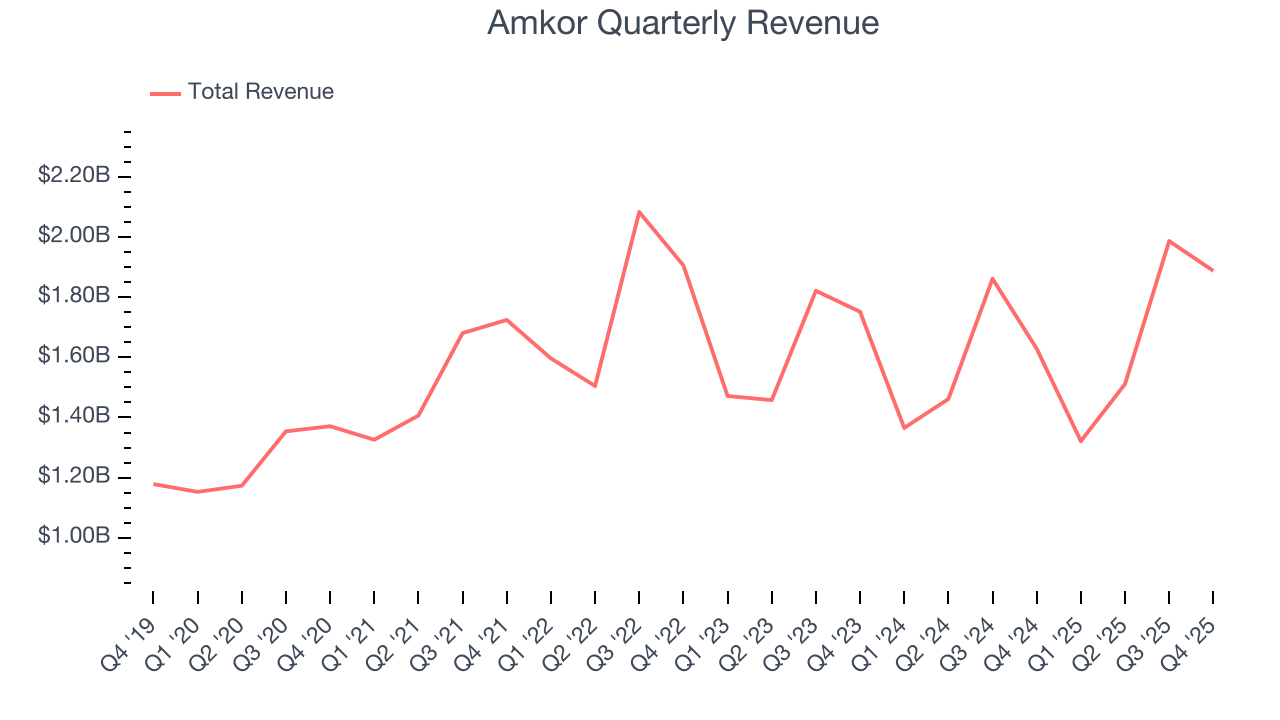
Semiconductor packaging and testing company Amkor Technology (NASDAQ:AMKR) reported Q4 CY2025 results exceeding the market’s revenue expectations, with sales up 15.9% year on year to $1.89 billion. On top of that, next quarter’s revenue guidance ($1.65 billion at the midpoint) was surprisingly good and 7% above what analysts were expecting. Its GAAP profit of $0.69 per share was 56.9% above analysts’ consensus estimates.
Amkor (AMKR) Q4 CY2025 Highlights:
- Revenue: $1.89 billion vs analyst estimates of $1.83 billion (15.9% year-on-year growth, 3% beat)
- EPS (GAAP): $0.69 vs analyst estimates of $0.44 (56.9% beat)
- Adjusted EBITDA: $369 million vs analyst estimates of $317.2 million (19.5% margin, 16.3% beat)
- Revenue Guidance for Q1 CY2026 is $1.65 billion at the midpoint, above analyst estimates of $1.54 billion
- EPS (GAAP) guidance for Q1 CY2026 is $0.23 at the midpoint, missing analyst estimates by 1.5%
- Operating Margin: 9.8%, up from 8.3% in the same quarter last year
- Free Cash Flow Margin: 1.1%, down from 15.5% in the same quarter last year
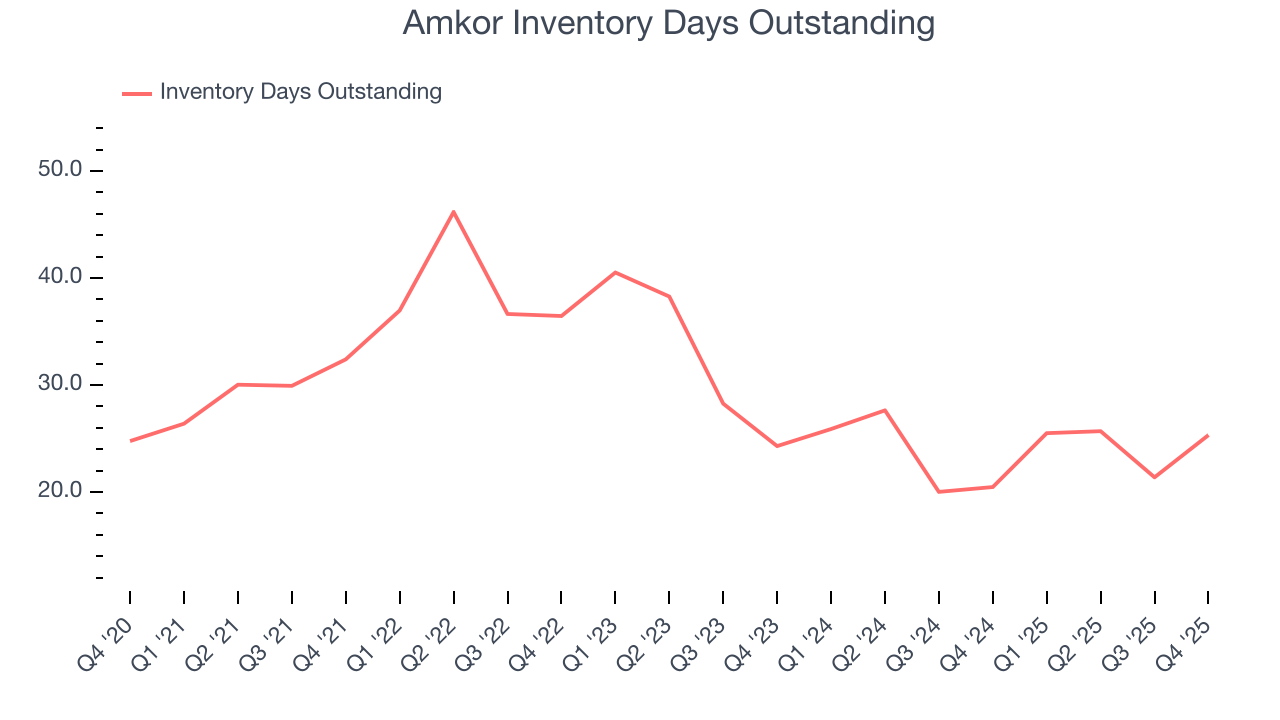
- Inventory Days Outstanding: 25, up from 21 in the previous quarter
- Market Capitalization: $12.2 billion
Company Overview
Operating through a largely Asian facility footprint, Amkor Technologies (NASDAQ:AMKR) provides outsourced packaging and testing for semiconductors.
Semiconductor manufacturing begins with a silicon wafer upon which circuit patterns are transferred. The fabricated material (the die) is then separated (dicing), typically using automation and precision tools such as lasers. Packaging comes next and serves three key purposes: connects the chip to an external environment (e.g. a circuit board), protects the chips against physical damage, and dissipates excess heat.
Amkor’s customers are semiconductor foundries (manufacturers), fabless semiconductor companies (designers who outsource manufacturing), and original equipment manufacturers (OEMs). The company’s packaging aims to meet customers’ requirements for size, electrical and mechanical performance, and interconnect technology (wiring systems to connect chips). For example, one of Amkor’s key packaging offerings is the ‘Flip-Chip Chip Scale Package’, where the package is no larger than the chip. This supports increasingly small form factors found in smartphones, tablets and other mobile devices. In addition to packaging, Amkor also offers testing services to ensure that semiconductors are defect-free and meet specifications before being deployed or sold.
Other companies offering outsourced semiconductor packaging and testing services include ASE Technology (TWSE:3711), Powertech Technology (TWSE:6239), and Siliconware Technology.
4. Revenue Growth
A company’s top-line performance can indicate its business quality. Rapid growth can signal it’s benefiting from an innovative new product or burgeoning market trend. Amkor’s annualized revenue growth rate of 1.6% over the last two years was mediocre for a semiconductor business. Semiconductors are a cyclical industry, and long-term investors should be prepared for periods of high growth followed by periods of revenue contractions.
Long-term growth is the most important, but short-term results matter for semiconductors because the rapid pace of technological innovation (Moore's Law) could make yesterday's hit product obsolete today. Amkor’s recent performance shows its demand has slowed as its annualized revenue growth of 1.6% over the last two years was below its five-year trend. 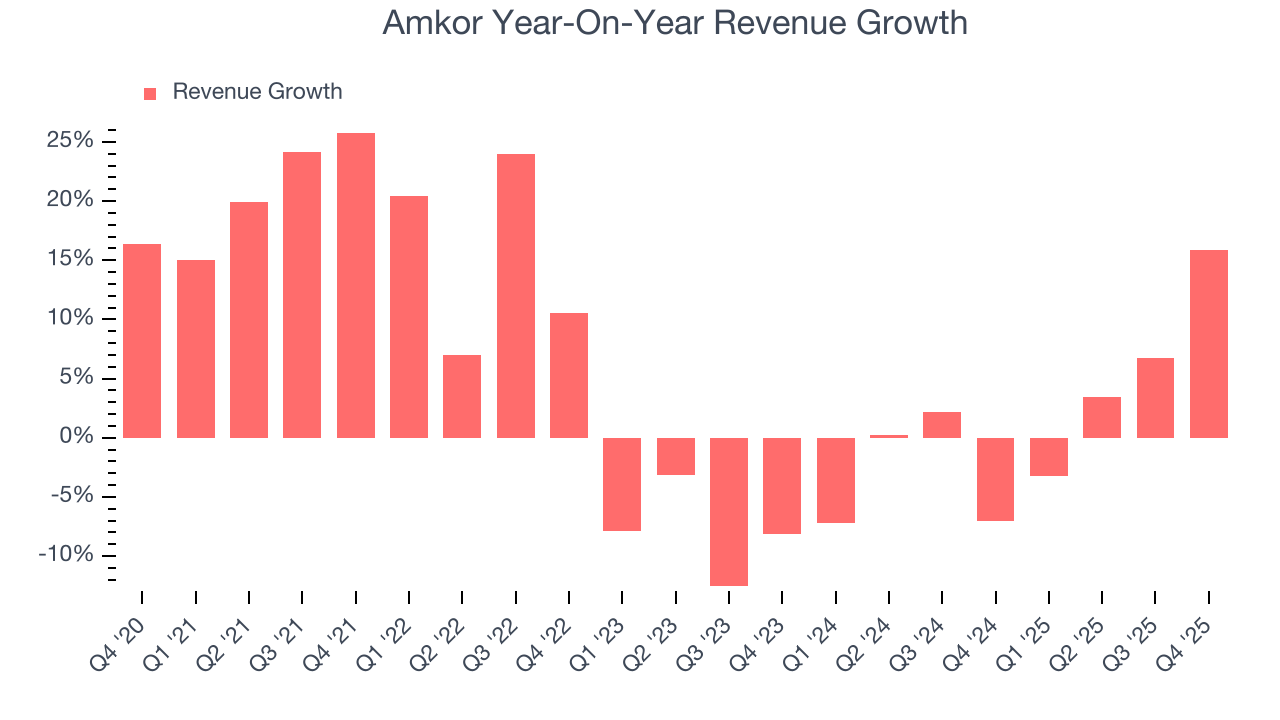
This quarter, Amkor reported year-on-year revenue growth of 15.9%, and its $1.89 billion of revenue exceeded Wall Street’s estimates by 3%. Beyond the beat, we believe the company is still in the early days of an upcycle as this was the third consecutive quarter of growth - a typical upcycle tends to last 8-10 quarters. Company management is currently guiding for a 24.9% year-on-year increase in sales next quarter.
Looking further ahead, sell-side analysts expect revenue to grow 7.8% over the next 12 months. Although this projection implies its newer products and services will spur better top-line performance, it is still below the sector average.
5. Product Demand & Outstanding Inventory
Days Inventory Outstanding (DIO) is an important metric for chipmakers, as it reflects a business’ capital intensity and the cyclical nature of semiconductor supply and demand. In a tight supply environment, inventories tend to be stable, allowing chipmakers to exert pricing power. Steadily increasing DIO can be a warning sign that demand is weak, and if inventories continue to rise, the company may have to downsize production.
This quarter, Amkor’s DIO came in at 25, which is 5 days below its five-year average. These numbers show that despite the recent increase, there’s no indication of an excessive inventory buildup.
6. Gross Margin & Pricing Power
Gross profit margin is a key metric to track because it shows how much money a semiconductor company gets to keep after paying for its raw materials, manufacturing, and other input costs.
Amkor’s gross margin is one of the worst in the semiconductor industry, signaling it operates in a competitive market and lacks pricing power. As you can see below, it averaged a 14.4% gross margin over the last two years. Said differently, Amkor had to pay a chunky $85.63 to its suppliers for every $100 in revenue. 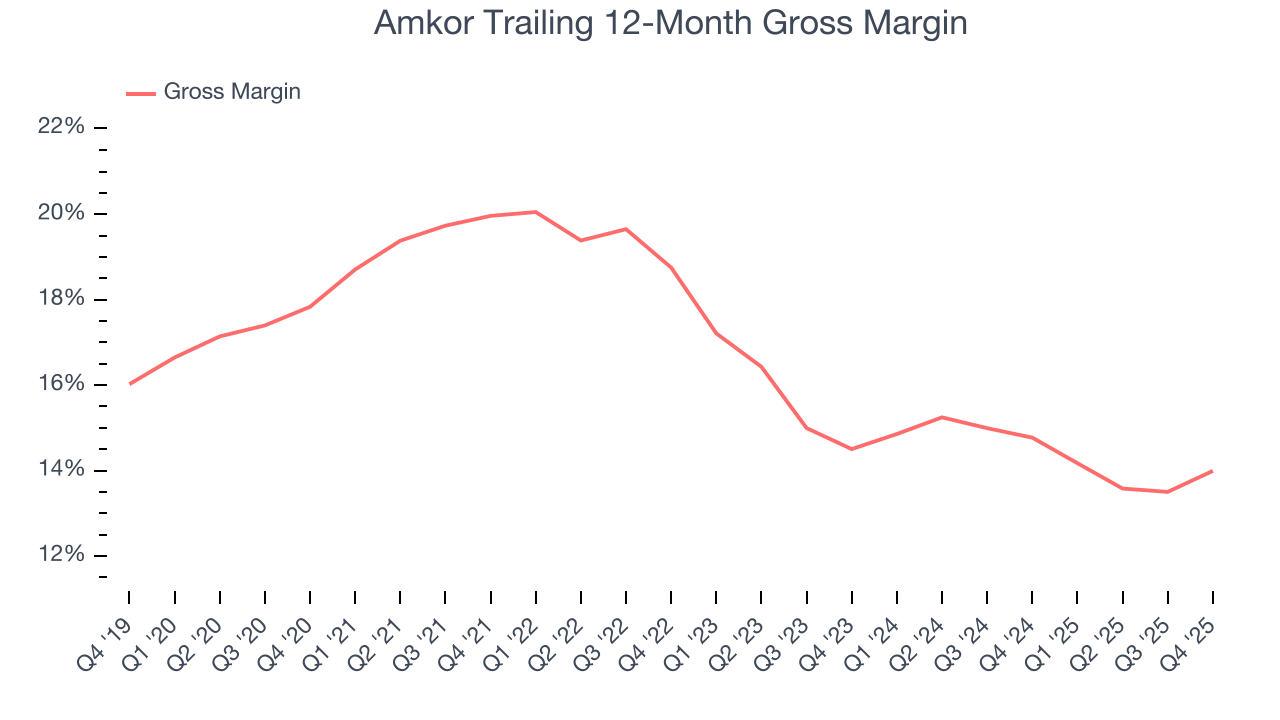
Amkor produced a 16.7% gross profit margin in Q4, marking a 1.5 percentage point increase from 15.1% in the same quarter last year. Zooming out, the company’s full-year margin has remained steady over the past 12 months, suggesting its input costs (such as raw materials and manufacturing expenses) have been stable and it isn’t under pressure to lower prices.
7. Operating Margin
Operating margin is a key measure of profitability. Think of it as net income - the bottom line - excluding the impact of taxes and interest on debt, which are less connected to business fundamentals.
Amkor’s operating margin might fluctuated slightly over the last 12 months but has remained more or less the same, averaging 7% over the last two years. This profitability was mediocre for a semiconductor business and caused by its suboptimal cost structureand low gross margin.
Analyzing the trend in its profitability, Amkor’s operating margin decreased by 5.5 percentage points over the last five years. This raises questions about the company’s expense base because its revenue growth should have given it leverage on its fixed costs, resulting in better economies of scale and profitability. Amkor’s performance was poor no matter how you look at it - it shows that costs were rising and it couldn’t pass them onto its customers.
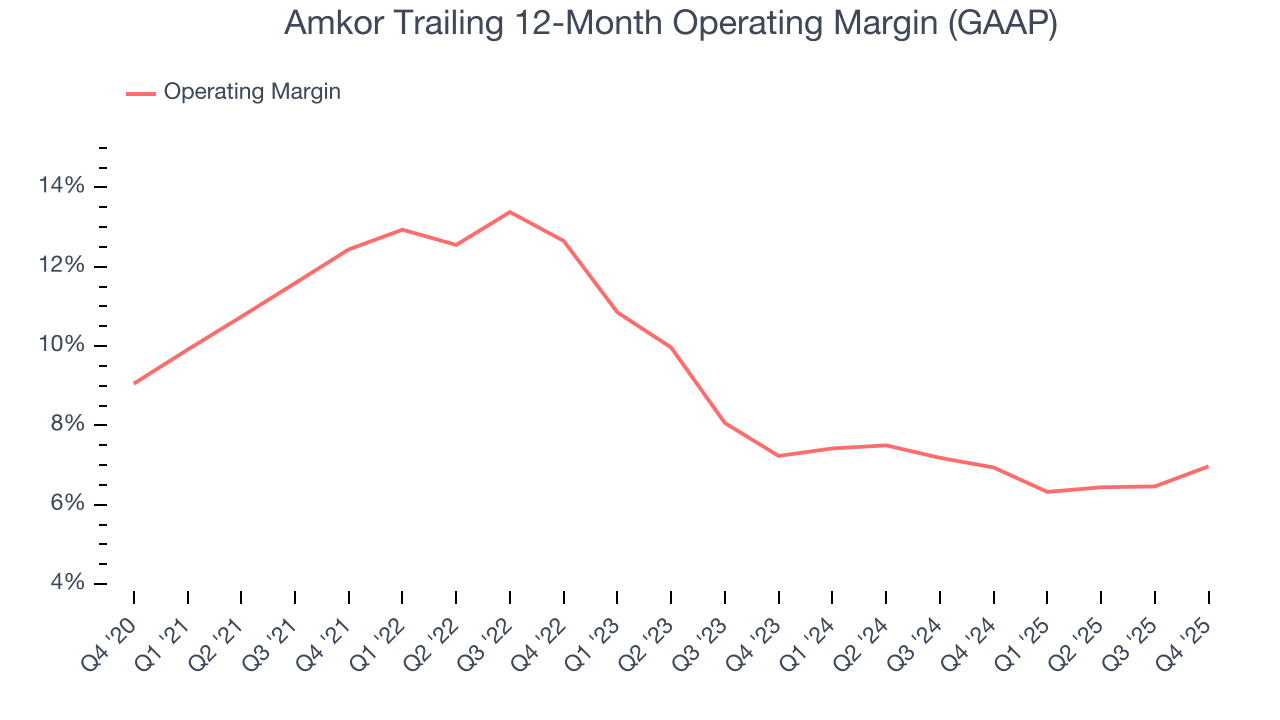
This quarter, Amkor generated an operating margin profit margin of 9.8%, up 1.5 percentage points year on year. The increase was encouraging, and because its operating margin rose more than its gross margin, we can infer it was more efficient with expenses such as marketing, R&D, and administrative overhead.
8. Earnings Per Share
We track the long-term change in earnings per share (EPS) for the same reason as long-term revenue growth. Compared to revenue, however, EPS highlights whether a company’s growth is profitable.
Amkor’s EPS grew at an unimpressive 1.5% compounded annual growth rate over the last five years, lower than its 5.8% annualized revenue growth. This tells us the company became less profitable on a per-share basis as it expanded.
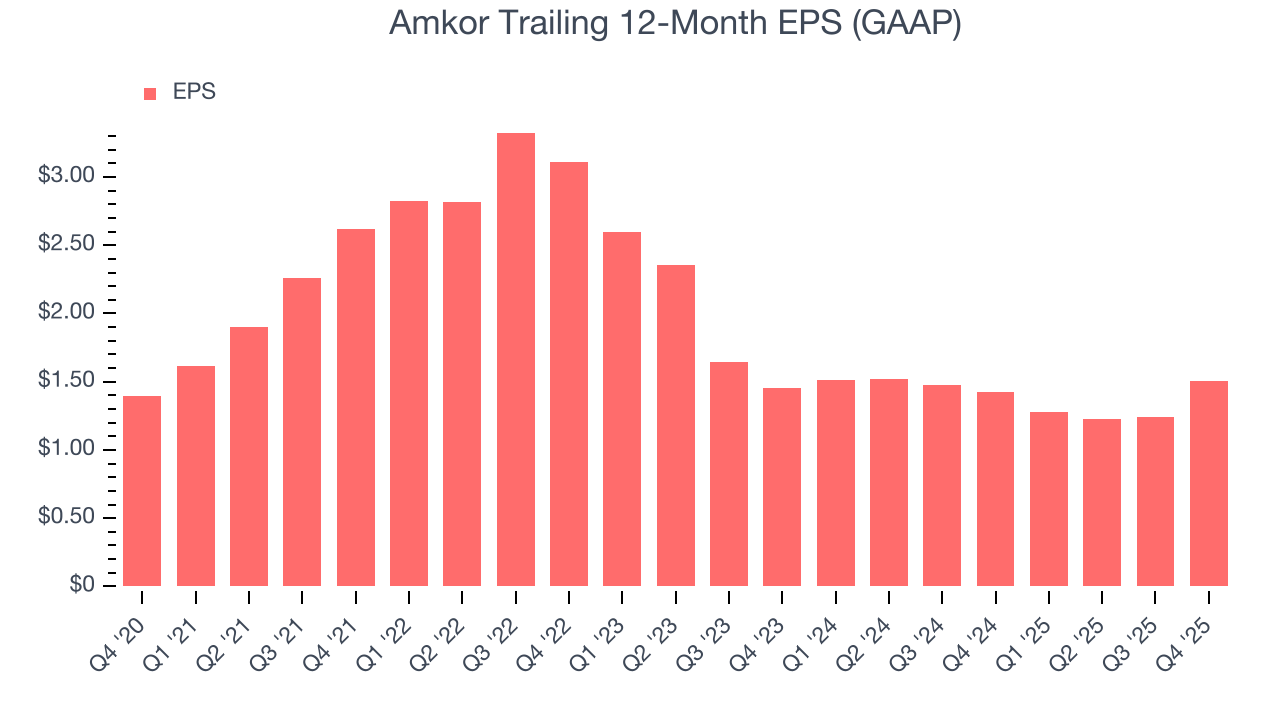
Diving into the nuances of Amkor’s earnings can give us a better understanding of its performance. As we mentioned earlier, Amkor’s operating margin expanded this quarter but declined by 5.5 percentage points over the last five years. Its share count also grew by 2.4%, meaning the company not only became less efficient with its operating expenses but also diluted its shareholders. 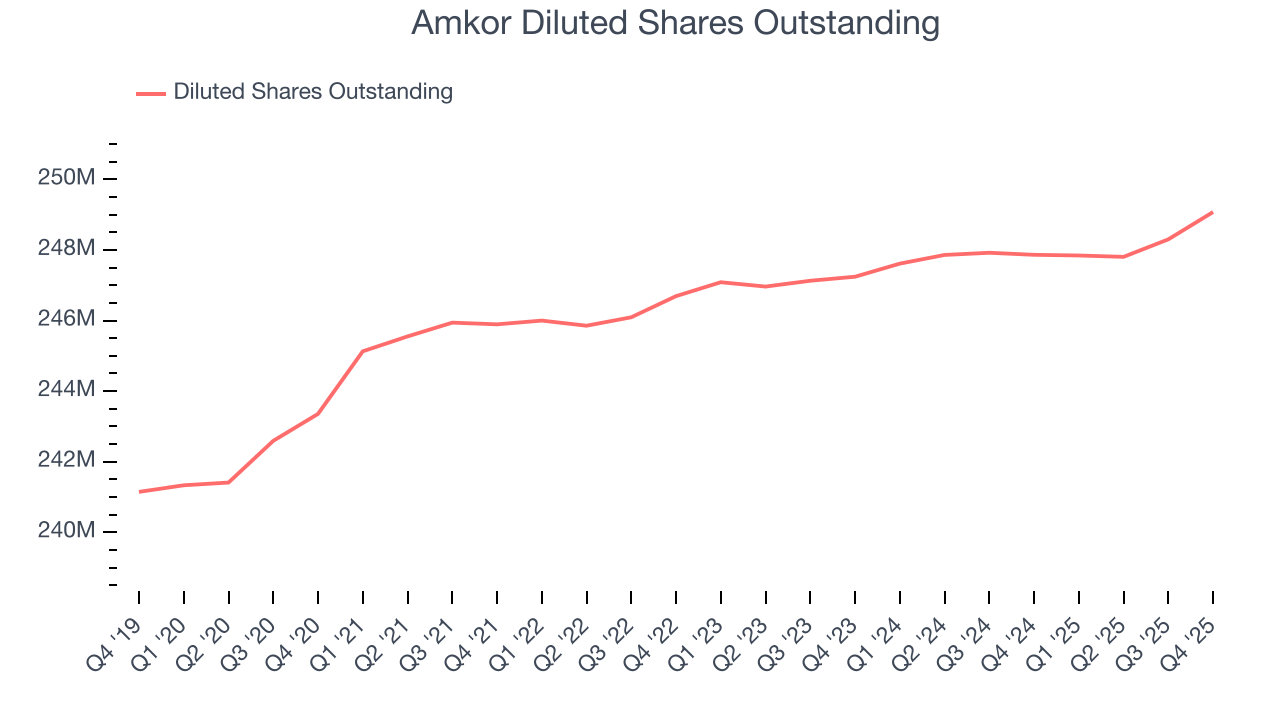
In Q4, Amkor reported EPS of $0.69, up from $0.43 in the same quarter last year. This print easily cleared analysts’ estimates, and shareholders should be content with the results. Over the next 12 months, Wall Street expects Amkor’s full-year EPS of $1.50 to grow 8.4%.
9. Cash Is King
If you’ve followed StockStory for a while, you know we emphasize free cash flow. Why, you ask? We believe that in the end, cash is king, and you can’t use accounting profits to pay the bills.
Amkor has shown poor cash profitability over the last two years, giving the company limited opportunities to return capital to shareholders. Its free cash flow margin averaged 2.7%, lousy for a semiconductor business.
Taking a step back, we can see that Amkor’s margin dropped by 5.6 percentage points over the last five years. Almost any movement in the wrong direction is undesirable because of its already low cash conversion. If the trend continues, it could signal it’s in the middle of a big investment cycle.
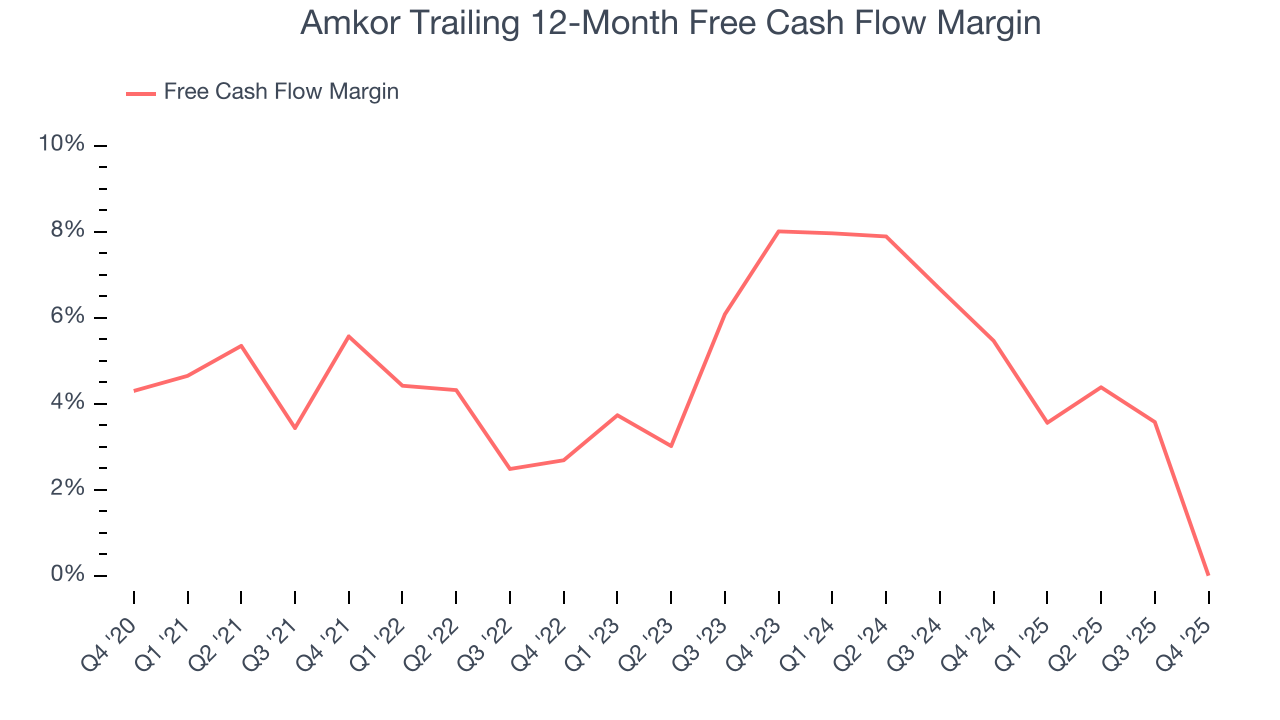
Amkor’s free cash flow clocked in at $21.6 million in Q4, equivalent to a 1.1% margin. The company’s cash profitability regressed as it was 14.3 percentage points lower than in the same quarter last year, suggesting its historical struggles have dragged on.
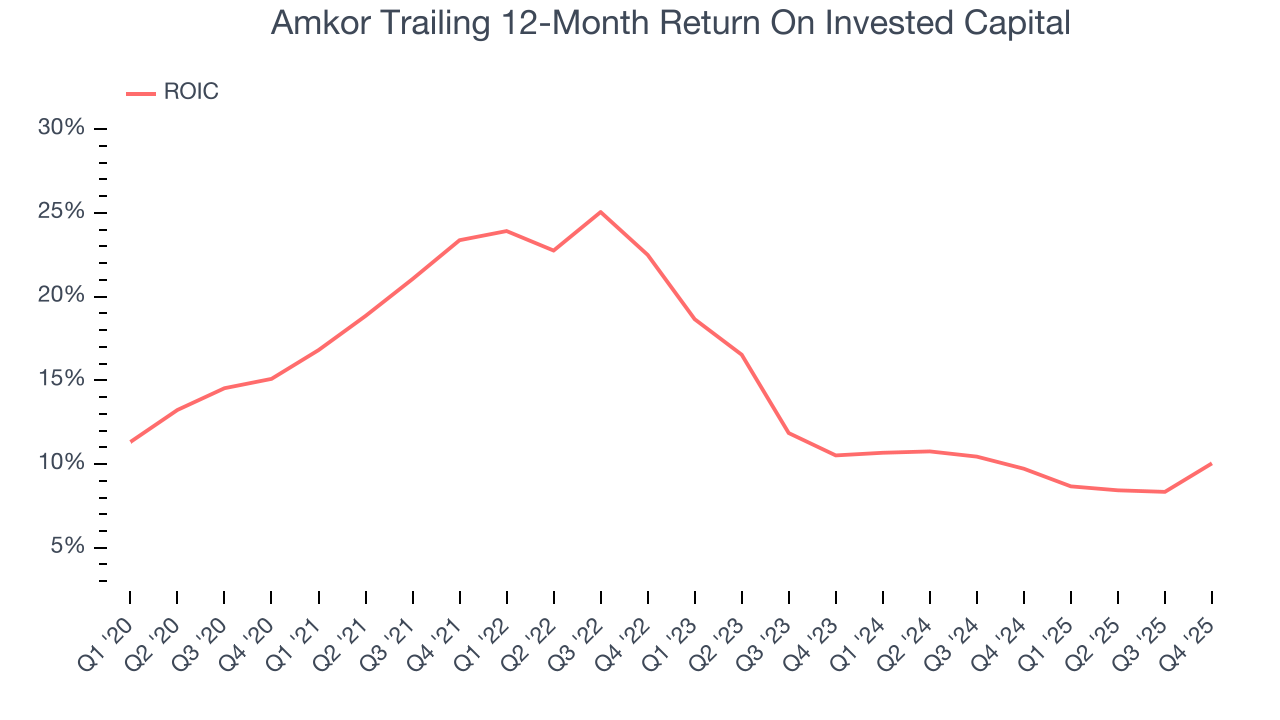
10. Return on Invested Capital (ROIC)
EPS and free cash flow tell us whether a company was profitable while growing its revenue. But was it capital-efficient? A company’s ROIC explains this by showing how much operating profit it makes compared to the money it has raised (debt and equity).
Amkor’s management team makes decent investment decisions and generates value for shareholders. Its five-year average ROIC was 15.2%, slightly better than typical semiconductor business.
11. Balance Sheet Assessment
One of the best ways to mitigate bankruptcy risk is to hold more cash than debt.
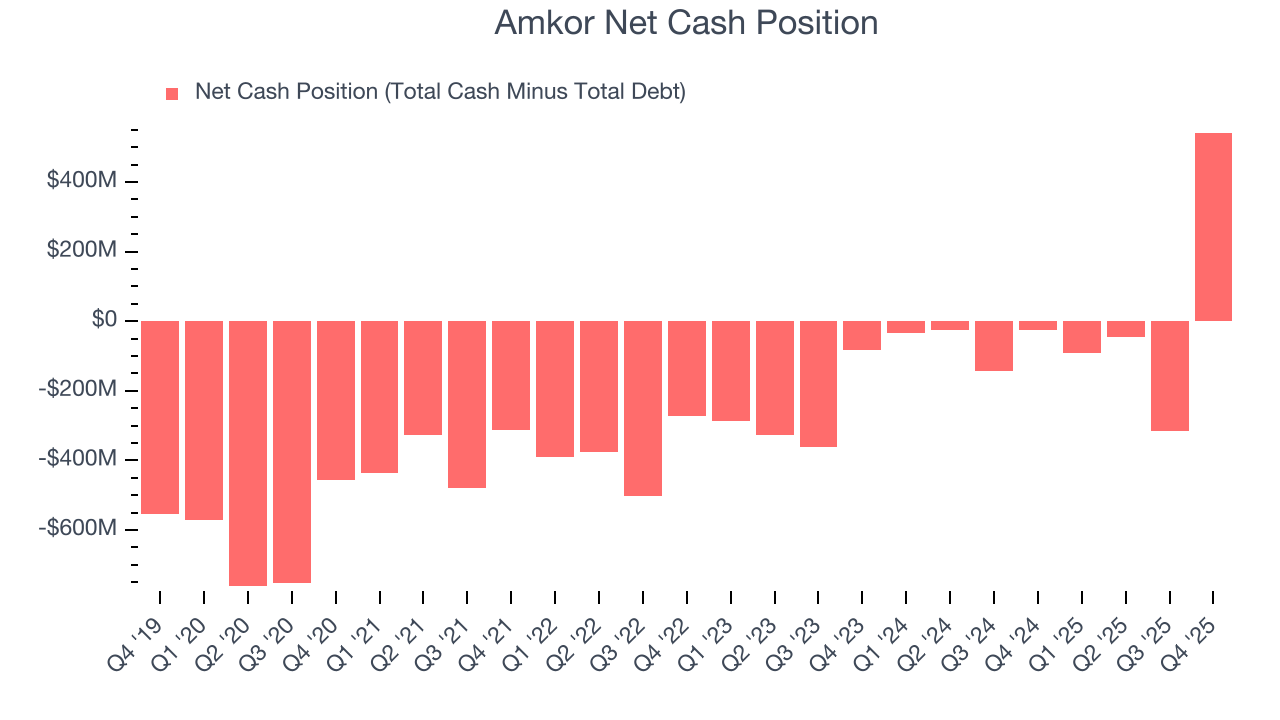
Amkor is a profitable, well-capitalized company with $2.06 billion of cash and $1.52 billion of debt on its balance sheet. This $542.2 million net cash position is 4.2% of its market cap and gives it the freedom to borrow money, return capital to shareholders, or invest in growth initiatives. Leverage is not an issue here.
12. Key Takeaways from Amkor’s Q4 Results
It was good to see Amkor beat analysts’ EPS expectations this quarter. We were also glad its revenue guidance for next quarter exceeded Wall Street’s estimates. On the other hand, its inventory levels materially increased. Zooming out, we think this quarter featured some important positives. The stock traded up 1.8% to $53.54 immediately after reporting.
13. Is Now The Time To Buy Amkor?
Updated: March 19, 2026 at 10:25 PM EDT
When considering an investment in Amkor, investors should account for its valuation and business qualities as well as what’s happened in the latest quarter.
Amkor’s business quality ultimately falls short of our standards. Although its revenue growth was mediocre over the last five years and is expected to accelerate over the next 12 months, its low free cash flow margins give it little breathing room. On top of that, the company’s low gross margins indicate some combination of pricing pressures or rising production costs.
Amkor’s P/E ratio based on the next 12 months is 27.3x. Beauty is in the eye of the beholder, but we don’t really see a big opportunity at the moment. We're fairly confident there are better stocks to buy right now.
Wall Street analysts have a consensus one-year price target of $56.25 on the company (compared to the current share price of $48.00).
Although the price target is bullish, readers should exercise caution because analysts tend to be overly optimistic. The firms they work for, often big banks, have relationships with companies that extend into fundraising, M&A advisory, and other rewarding business lines. As a result, they typically hesitate to say bad things for fear they will lose out. We at StockStory do not suffer from such conflicts of interest, so we’ll always tell it like it is.