
ArcBest (ARCB)
ArcBest is in for a bumpy ride. Its poor sales growth and falling returns on capital suggest its growth opportunities are shrinking.― StockStory Analyst Team
1. News


2. Summary
Why We Think ArcBest Will Underperform
Historically owning furniture, banking, and other subsidiaries, ArcBest (NASDAQ:ARCB) offers full-truckload, less-than-truckload, and intermodal deliveries of freight.
- Sales tumbled by 4.8% annually over the last two years, showing market trends are working against its favor during this cycle
- Sales were less profitable over the last two years as its earnings per share fell by 31.7% annually, worse than its revenue declines
- Gross margin of 9.6% reflects its high production costs


ArcBest doesn’t fulfill our quality requirements. We’d search for superior opportunities elsewhere.
Why There Are Better Opportunities Than ArcBest


ArcBest’s stock price of $85.02 implies a valuation ratio of 18.6x forward P/E. ArcBest’s multiple may seem like a great deal among industrials peers, but we think there are valid reasons why it’s this cheap.
It’s better to pay up for high-quality businesses with higher long-term earnings potential rather than to buy lower-quality stocks because they appear cheap. These challenged businesses often don’t re-rate, a phenomenon known as a “value trap”.
3. ArcBest (ARCB) Research Report: Q4 CY2025 Update
Freight Delivery Company ArcBest (NASDAQ:ARCB) beat Wall Street’s revenue expectations in Q4 CY2025, but sales fell by 2.9% year on year to $972.7 million. Its non-GAAP profit of $0.36 per share was 13.8% below analysts’ consensus estimates.
ArcBest (ARCB) Q4 CY2025 Highlights:
- Revenue: $972.7 million vs analyst estimates of $967.7 million (2.9% year-on-year decline, 0.5% beat)
- Adjusted EPS: $0.36 vs analyst expectations of $0.42 (13.8% miss)
- Adjusted EBITDA: $51.52 million vs analyst estimates of $55.15 million (5.3% margin, 6.6% miss)
- Operating Margin: -0.8%, down from 3.8% in the same quarter last year
- Free Cash Flow Margin: 3.8%, up from 0.4% in the same quarter last year
- Sales Volumes rose 2.4% year on year (-1.1% in the same quarter last year)
- Market Capitalization: $1.92 billion
Company Overview
Historically owning furniture, banking, and other subsidiaries, ArcBest (NASDAQ:ARCB) offers full-truckload, less-than-truckload, and intermodal deliveries of freight.
ArcBest, formerly known as OK Transfer, was founded in 1923 as a local freight hauler making deliveries in Arkansas. The company was able to expand its operations and improve its existing services by making various acquisitions. Specifically, the acquisition of Panther Premium Logistics in 2012 improved its capabilities in expedited freight and Bear Transportation Services in 2014 enhanced its full truckload offerings. Through these acquisitions and continuous investment, the company offers full-truck load, less-than-truckload, and intermodal deliveries.
ArcBest provides delivery services and manages the movement of products from distribution centers to retail stores or directly to customers’ homes. Its offerings include full truckload deliveries, where entire truck trailers are dedicated to a single customer's shipment. This encompasses dry van services for standard cargo like boxed goods and equipment, as well as refrigerated services ensuring temperature control for perishable items during transport. Additionally, it offers less-than-truckload services, consolidating smaller shipments from multiple customers.
For its international deliveries, ArcBest partners with shipping lines and air freight carriers. It offers ocean and air freight services for both less-than-container load (LCL) and full-container load (FCL) shipments and also manages the logistics of cross-border transportation to and from these ports. Additionally, its transportation management services work with customers to figure out what challenges each customer faces in their supply chain and then create a plan to solve them, taking a fee along the way.
The majority of ArcBest’s deliveries are made through third-party carriers and it engages in contractual agreements up to multiple years with these carriers. In addition, it engages in contractual agreements with its customers that typically span multiple years. It also offers volume discounts to customers who commit to shipping larger quantities, providing cost savings as the volume of goods transported increases.
4. Ground Transportation
The growth of e-commerce and global trade continues to drive demand for shipping services, especially last-mile delivery, presenting opportunities for ground transportation companies. The industry continues to invest in data, analytics, and autonomous fleets to optimize efficiency and find the most cost-effective routes. Despite the essential services this industry provides, ground transportation companies are still at the whim of economic cycles. Consumer spending, for example, can greatly impact the demand for these companies’ offerings while fuel costs can influence profit margins.
Competitors offering similar products include C.H. Robinson (NASDAQ:CHRW), FedEx (NYSE:FDX), and J.B. Hunt (NASDAQ:JBHT).
5. Revenue Growth
Reviewing a company’s long-term sales performance reveals insights into its quality. Even a bad business can shine for one or two quarters, but a top-tier one grows for years. Over the last five years, ArcBest grew its sales at a mediocre 6.4% compounded annual growth rate. This was below our standard for the industrials sector and is a poor baseline for our analysis.
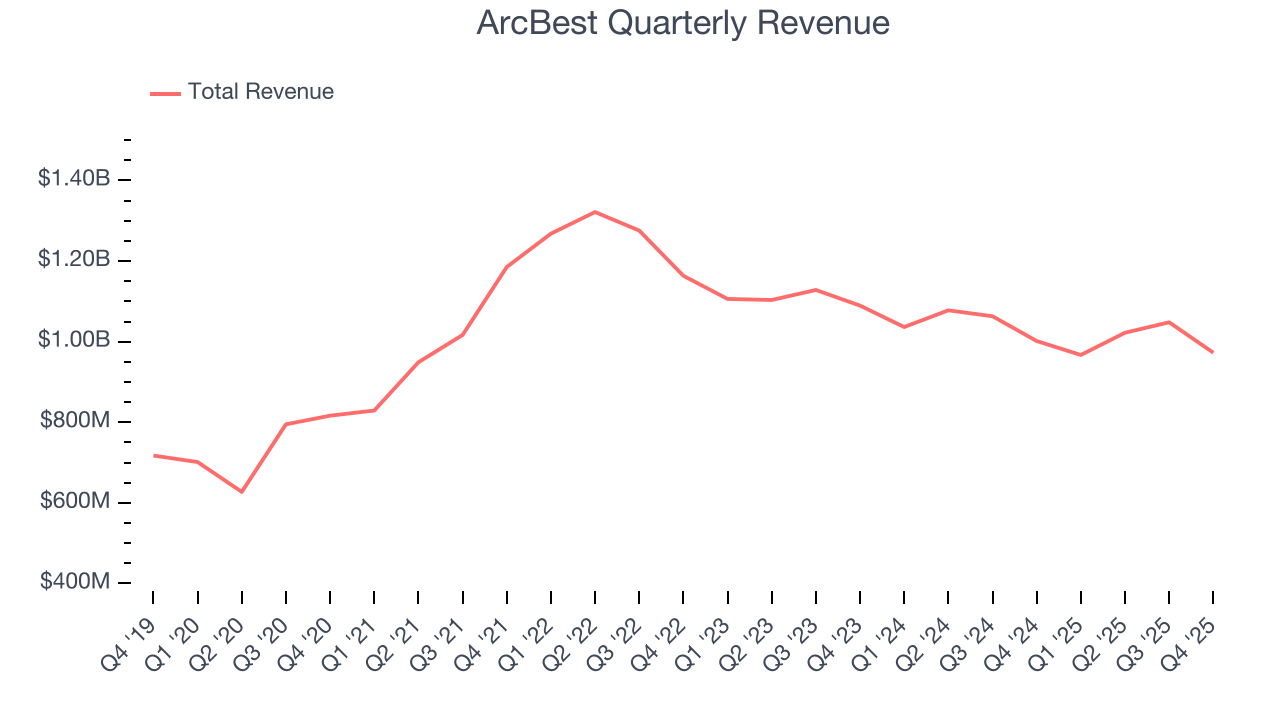
We at StockStory place the most emphasis on long-term growth, but within industrials, a half-decade historical view may miss cycles, industry trends, or a company capitalizing on catalysts such as a new contract win or a successful product line. ArcBest’s performance shows it grew in the past but relinquished its gains over the last two years, as its revenue fell by 4.8% annually. 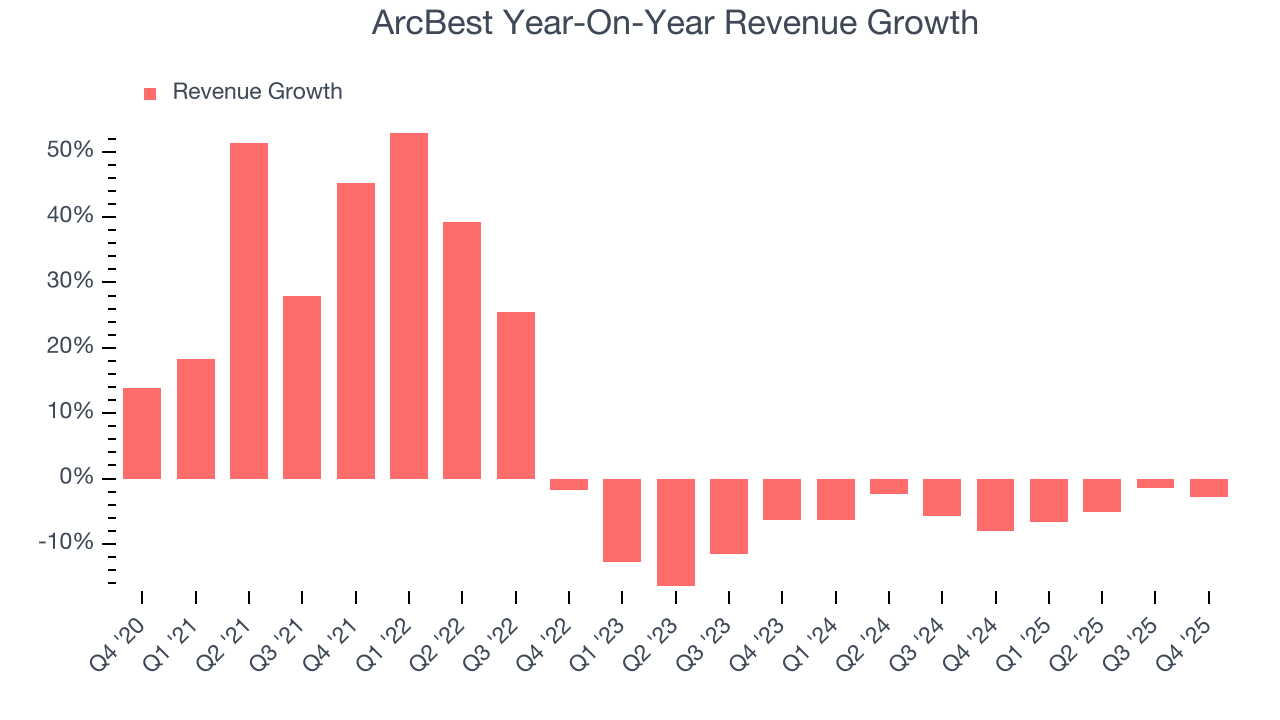
We can better understand the company’s revenue dynamics by analyzing its number of units sold, which reached 20,163 in the latest quarter. Over the last two years, ArcBest’s units sold were flat. Because this number is better than its revenue growth, we can see the company’s average selling price decreased. 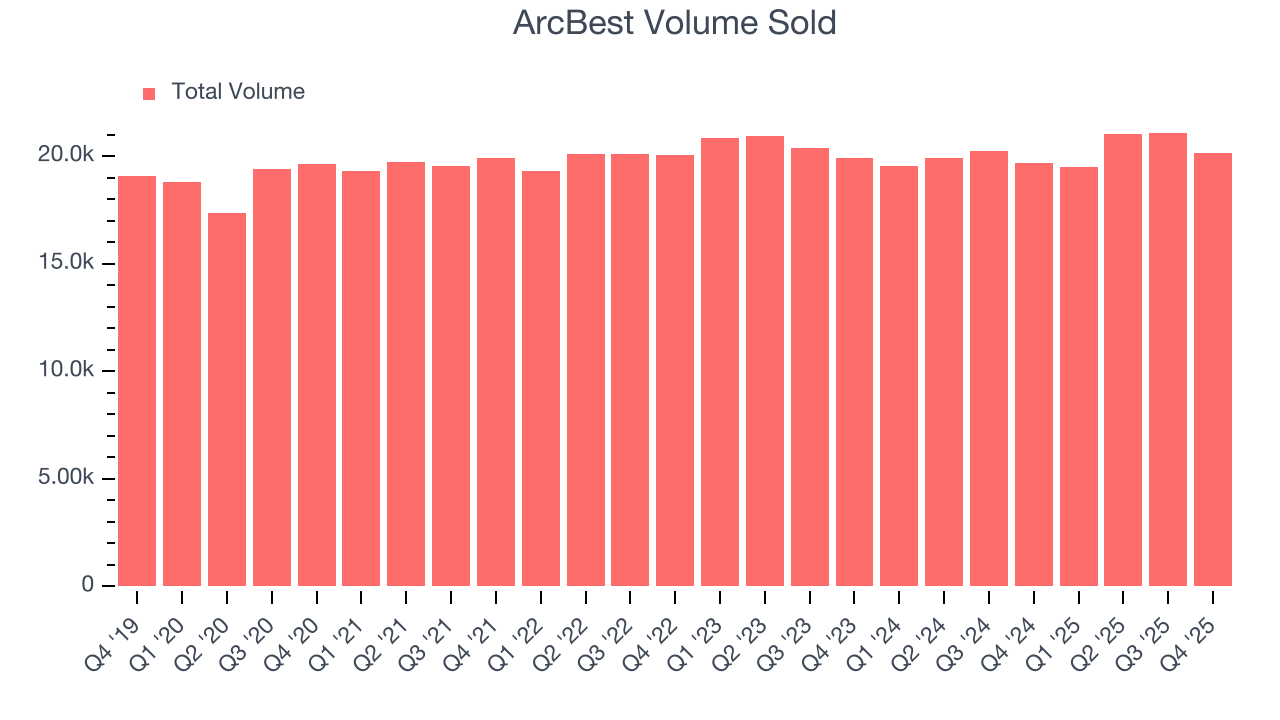
This quarter, ArcBest’s revenue fell by 2.9% year on year to $972.7 million but beat Wall Street’s estimates by 0.5%.
Looking ahead, sell-side analysts expect revenue to grow 3.1% over the next 12 months. While this projection suggests its newer products and services will catalyze better top-line performance, it is still below average for the sector.
6. Gross Margin & Pricing Power
Gross profit margin is a critical metric to track because it sheds light on its pricing power, complexity of products, and ability to procure raw materials, equipment, and labor.
ArcBest has bad unit economics for an industrials business, signaling it operates in a competitive market. As you can see below, it averaged a 9.7% gross margin over the last five years. That means ArcBest paid its suppliers a lot of money ($90.29 for every $100 in revenue) to run its business. 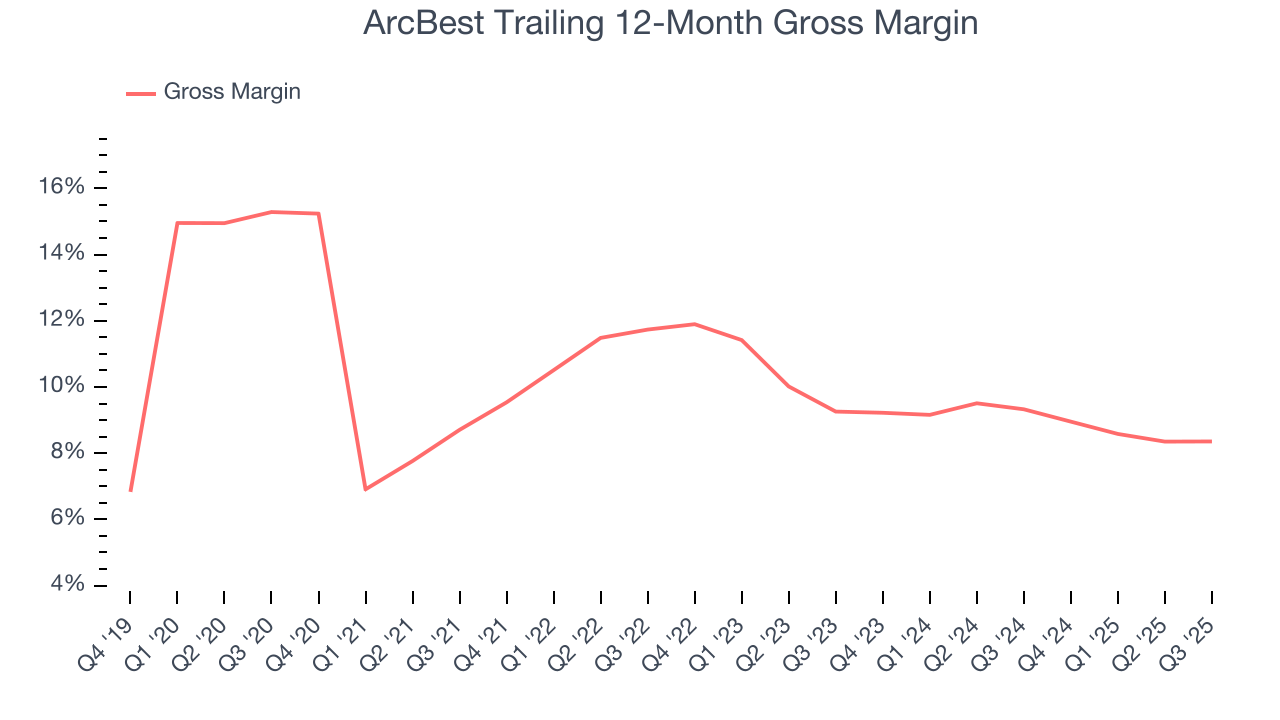
7. Operating Margin
ArcBest was profitable over the last five years but held back by its large cost base. Its average operating margin of 5.5% was weak for an industrials business. This result isn’t too surprising given its low gross margin as a starting point.
Analyzing the trend in its profitability, ArcBest’s operating margin decreased by 4.8 percentage points over the last five years. This raises questions about the company’s expense base because its revenue growth should have given it leverage on its fixed costs, resulting in better economies of scale and profitability. ArcBest’s performance was poor no matter how you look at it - it shows that costs were rising and it couldn’t pass them onto its customers.
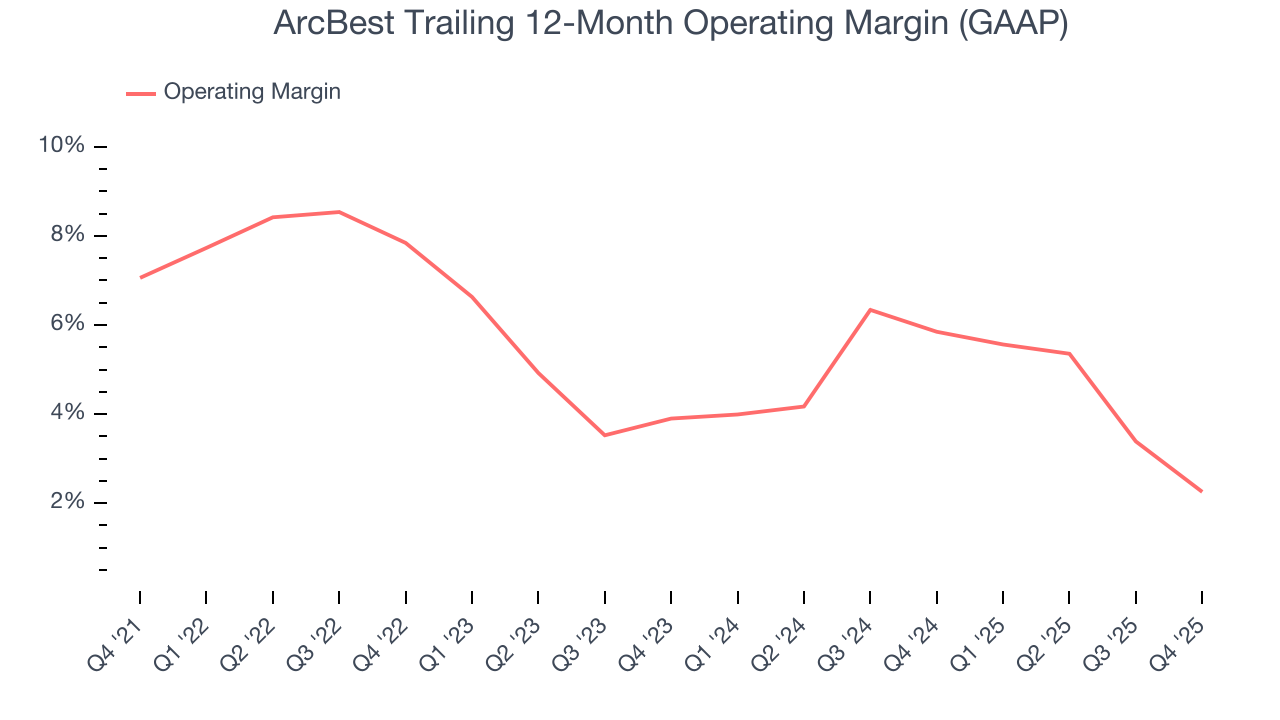
In Q4, ArcBest’s breakeven margin was down 4.7 percentage points year on year. The contraction shows it was less efficient because its expenses increased relative to its revenue.
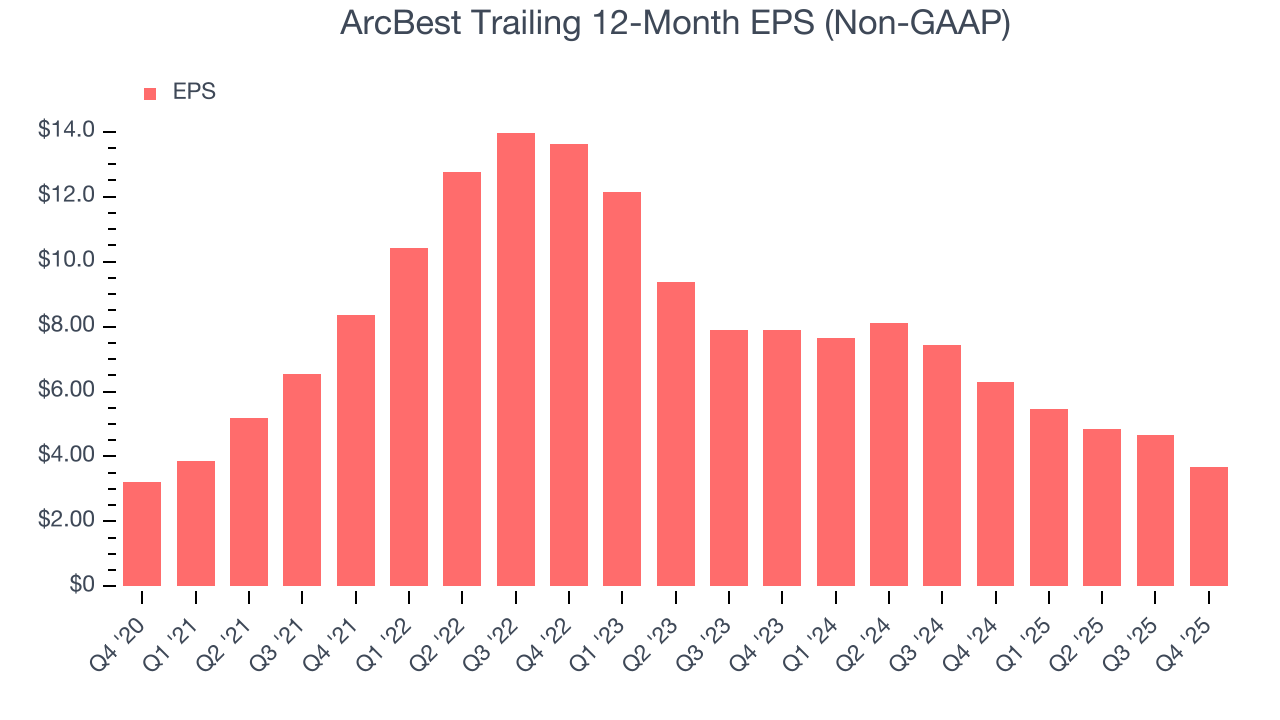
8. Earnings Per Share
We track the long-term change in earnings per share (EPS) for the same reason as long-term revenue growth. Compared to revenue, however, EPS highlights whether a company’s growth is profitable.
ArcBest’s EPS grew at a weak 2.8% compounded annual growth rate over the last five years, lower than its 6.4% annualized revenue growth. This tells us the company became less profitable on a per-share basis as it expanded due to non-fundamental factors such as interest expenses and taxes.
Diving into the nuances of ArcBest’s earnings can give us a better understanding of its performance. As we mentioned earlier, ArcBest’s operating margin declined by 4.8 percentage points over the last five years. This was the most relevant factor (aside from the revenue impact) behind its lower earnings; interest expenses and taxes can also affect EPS but don’t tell us as much about a company’s fundamentals.
Like with revenue, we analyze EPS over a shorter period to see if we are missing a change in the business.
For ArcBest, its two-year annual EPS declines of 31.7% show it’s continued to underperform. These results were bad no matter how you slice the data.
In Q4, ArcBest reported adjusted EPS of $0.36, down from $1.33 in the same quarter last year. This print missed analysts’ estimates. Over the next 12 months, Wall Street expects ArcBest’s full-year EPS of $3.69 to grow 30.2%.
9. Cash Is King
Free cash flow isn't a prominently featured metric in company financials and earnings releases, but we think it's telling because it accounts for all operating and capital expenses, making it tough to manipulate. Cash is king.
ArcBest has shown weak cash profitability over the last five years, giving the company limited opportunities to return capital to shareholders. Its free cash flow margin averaged 4%, subpar for an industrials business.
Taking a step back, we can see that ArcBest’s margin dropped by 3.8 percentage points during that time. This along with its unexciting margin put the company in a tough spot, and shareholders are likely hoping it can reverse course. If the trend continues, it could signal it’s in the middle of an investment cycle.
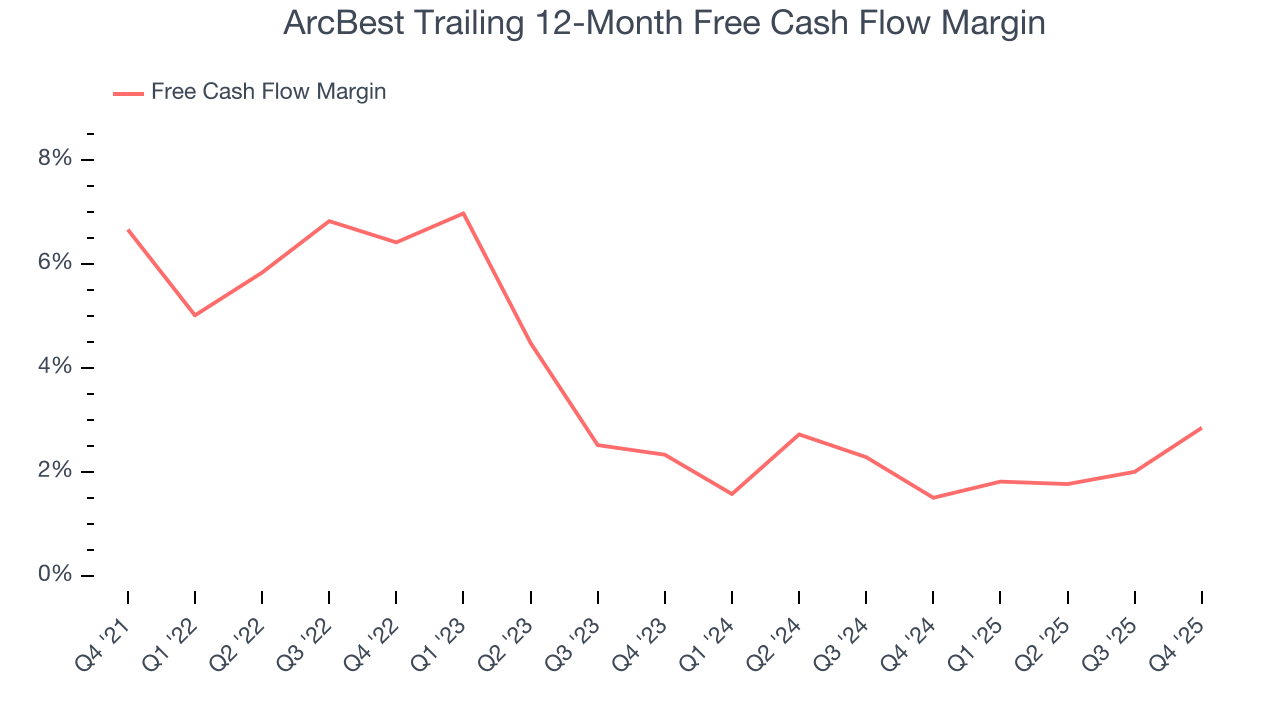
ArcBest’s free cash flow clocked in at $36.89 million in Q4, equivalent to a 3.8% margin. This result was good as its margin was 3.4 percentage points higher than in the same quarter last year, but we wouldn’t put too much weight on the short term because investment needs can be seasonal, causing temporary swings. Long-term trends carry greater meaning.
10. Return on Invested Capital (ROIC)
EPS and free cash flow tell us whether a company was profitable while growing its revenue. But was it capital-efficient? Enter ROIC, a metric showing how much operating profit a company generates relative to the money it has raised (debt and equity).
Although ArcBest hasn’t been the highest-quality company lately because of its poor bottom-line (EPS) performance, it historically found a few growth initiatives that worked out well. Its five-year average ROIC was 15.6%, impressive for an industrials business.
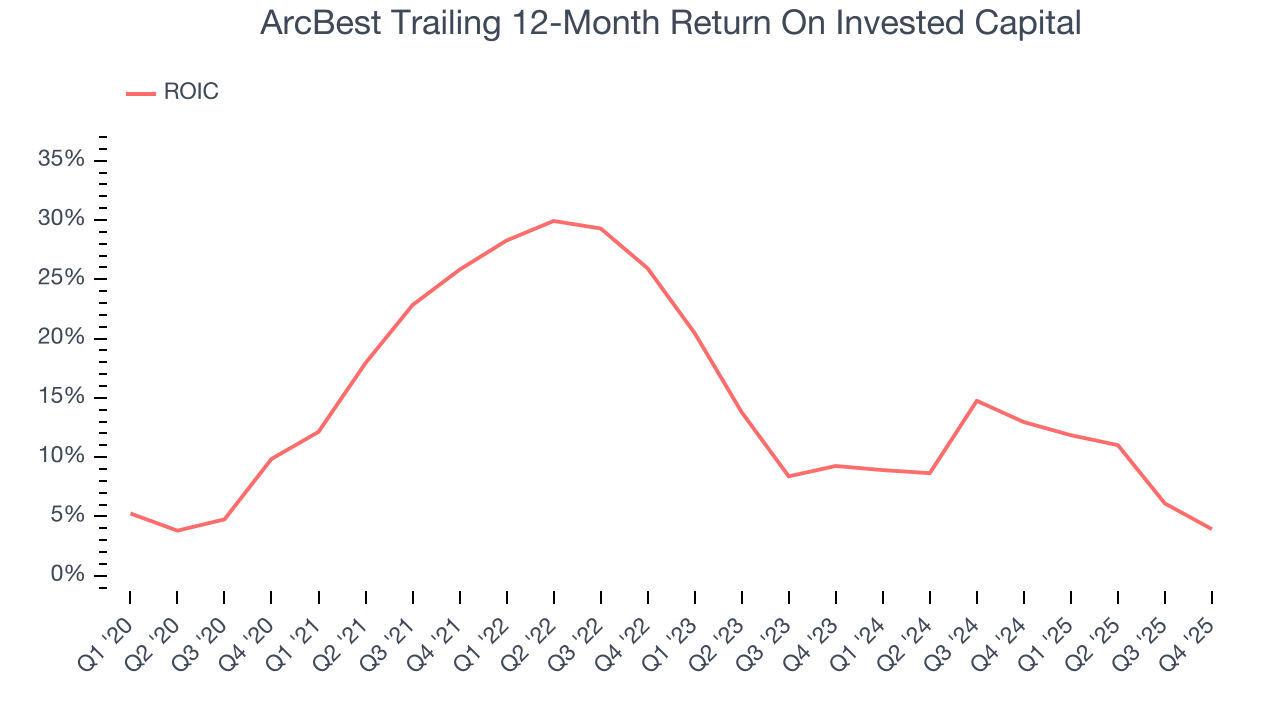
We like to invest in businesses with high returns, but the trend in a company’s ROIC is what often surprises the market and moves the stock price. Over the last few years, ArcBest’s ROIC has unfortunately decreased significantly. We like what management has done in the past, but its declining returns are perhaps a symptom of fewer profitable growth opportunities.
11. Balance Sheet Assessment
ArcBest reported $124.2 million of cash and $464.6 million of debt on its balance sheet in the most recent quarter. As investors in high-quality companies, we primarily focus on two things: 1) that a company’s debt level isn’t too high and 2) that its interest payments are not excessively burdening the business.
With $285.8 million of EBITDA over the last 12 months, we view ArcBest’s 1.2× net-debt-to-EBITDA ratio as safe. We also see its $3.37 million of annual interest expenses as appropriate. The company’s profits give it plenty of breathing room, allowing it to continue investing in growth initiatives.
12. Key Takeaways from ArcBest’s Q4 Results
It was good to see ArcBest narrowly top analysts’ revenue expectations this quarter. On the other hand, its EBITDA missed and its EPS fell short of Wall Street’s estimates. Overall, this quarter could have been better. The stock remained flat at $85.30 immediately following the results.
13. Is Now The Time To Buy ArcBest?
Updated: March 15, 2026 at 11:22 PM EDT
The latest quarterly earnings matters, sure, but we actually think longer-term fundamentals and valuation matter more. Investors should consider all these pieces before deciding whether or not to invest in ArcBest.
We cheer for all companies making their customers lives easier, but in the case of ArcBest, we’ll be cheering from the sidelines. To kick things off, its revenue growth was mediocre over the last five years, and analysts expect its demand to deteriorate over the next 12 months. While its projected EPS for the next year implies the company’s fundamentals will improve, the downside is its diminishing returns show management's prior bets haven't worked out. On top of that, its low gross margins indicate some combination of competitive pressures and high production costs.
ArcBest’s P/E ratio based on the next 12 months is 18.6x. While this valuation is reasonable, we don’t see a big opportunity at the moment. There are better investments elsewhere.
Wall Street analysts have a consensus one-year price target of $100.25 on the company (compared to the current share price of $85.02).
Although the price target is bullish, readers should exercise caution because analysts tend to be overly optimistic. The firms they work for, often big banks, have relationships with companies that extend into fundraising, M&A advisory, and other rewarding business lines. As a result, they typically hesitate to say bad things for fear they will lose out. We at StockStory do not suffer from such conflicts of interest, so we’ll always tell it like it is.