
Banner Bank (BANR)
We’re wary of Banner Bank. Its sluggish sales growth shows demand is soft, a worrisome sign for investors in high-quality stocks.― StockStory Analyst Team
1. News
2. Summary
Why We Think Banner Bank Will Underperform
Founded in 1890 in Walla Walla, Washington, and evolving through more than a century of economic cycles, Banner Corporation (NASDAQ:BANR) operates Banner Bank, providing commercial banking services, loans, and financial products to individuals and businesses across Washington, Oregon, California, Idaho, and Utah.
- Annual net interest income growth of 4.1% over the last five years was below our standards for the banking sector
- 2.8% annual revenue growth over the last five years was slower than its banking peers
- One positive is that its sound unit economics and 3.9% net interest margin allow for higher marketing budgets versus competitors


Banner Bank is in the penalty box. We’re redirecting our focus to better businesses.
Why There Are Better Opportunities Than Banner Bank


Banner Bank is trading at $61.32 per share, or 1x forward P/B. This multiple is lower than most banking companies, but for good reason.
We’d rather pay up for companies with elite fundamentals than get a bargain on weak ones. Cheap stocks can be value traps, and as their performance deteriorates, they will stay cheap or get even cheaper.
3. Banner Bank (BANR) Research Report: Q4 CY2025 Update
Regional banking company Banner Corporation (NASDAQ:BANR) fell short of the markets revenue expectations in Q4 CY2025 as sales rose 2.6% year on year to $167.7 million. Its GAAP profit of $1.49 per share was 2.6% above analysts’ consensus estimates.
Banner Bank (BANR) Q4 CY2025 Highlights:
- Net Interest Income: $152.4 million vs analyst estimates of $152.1 million (8.5% year-on-year growth, in line)
- Net Interest Margin: 3.9% vs analyst estimates of 4% (4.2 basis point miss)
- Revenue: $167.7 million vs analyst estimates of $173 million (2.6% year-on-year growth, 3.1% miss)
- Efficiency Ratio: 62.1% vs analyst estimates of 59.2% (291.7 basis point miss)
- EPS (GAAP): $1.49 vs analyst estimates of $1.45 (2.6% beat)
- Tangible Book Value per Share: $46.09 vs analyst estimates of $45.80 (13.6% year-on-year growth, 0.6% beat)
- Market Capitalization: $2.19 billion
Company Overview
Founded in 1890 in Walla Walla, Washington, and evolving through more than a century of economic cycles, Banner Corporation (NASDAQ:BANR) operates Banner Bank, providing commercial banking services, loans, and financial products to individuals and businesses across Washington, Oregon, California, Idaho, and Utah.
Banner Bank serves as a traditional financial institution with a regional focus, operating branches throughout Washington, Oregon, California, Idaho, and a loan production office in Utah. The bank's lending activities span multiple sectors, with particular emphasis on commercial real estate and business loans, including those for small and medium-sized enterprises and agricultural businesses in its service areas.
The bank's loan portfolio is deliberately diversified across product types and geographic locations, featuring commercial real estate loans (both owner-occupied and investment properties), construction and land development loans, residential mortgages, and agricultural financing. For example, a local developer might secure a construction loan to build a multi-unit apartment complex, while a family farm operation could obtain agricultural financing for equipment purchases or seasonal operating expenses.
Banner generates revenue primarily through interest income on loans, fees from deposit accounts and treasury management services, and mortgage banking operations. The bank originates residential mortgages both for its portfolio and for sale in secondary markets, allowing it to earn fee income while managing interest rate risk. Banner also offers various consumer products including home equity lines of credit, auto loans, and personal loans.
The bank's deposit gathering strategy focuses on core deposits—non-interest-bearing checking accounts and interest-bearing transaction and savings accounts—which provide a stable funding base. Banner complements its traditional branch network with digital banking capabilities, including online and mobile banking services, to meet evolving customer preferences and expand its market reach beyond physical locations.
4. Regional Banks
Regional banks, financial institutions operating within specific geographic areas, serve as intermediaries between local depositors and borrowers. They benefit from rising interest rates that improve net interest margins (the difference between loan yields and deposit costs), digital transformation reducing operational expenses, and local economic growth driving loan demand. However, these banks face headwinds from fintech competition, deposit outflows to higher-yielding alternatives, credit deterioration (increasing loan defaults) during economic slowdowns, and regulatory compliance costs. Recent concerns about regional bank stability following high-profile failures and significant commercial real estate exposure present additional challenges.
Banner Corporation competes with other regional banks operating in the Pacific Northwest and Intermountain West, including Washington Federal (NASDAQ:WAFD), Columbia Banking System (NASDAQ:COLB), and Umpqua Holdings (now part of Columbia), as well as larger national institutions like Bank of America (NYSE:BAC), Wells Fargo (NYSE:WFC), and U.S. Bancorp (NYSE:USB).
5. Sales Growth
Two primary revenue streams drive bank earnings. While net interest income, which is earned by charging higher rates on loans than paid on deposits, forms the foundation, fee-based services across banking, credit, wealth management, and trading operations provide additional income. Over the last five years, Banner Bank grew its revenue at a sluggish 2.6% compounded annual growth rate. This fell short of our benchmarks and is a tough starting point for our analysis.
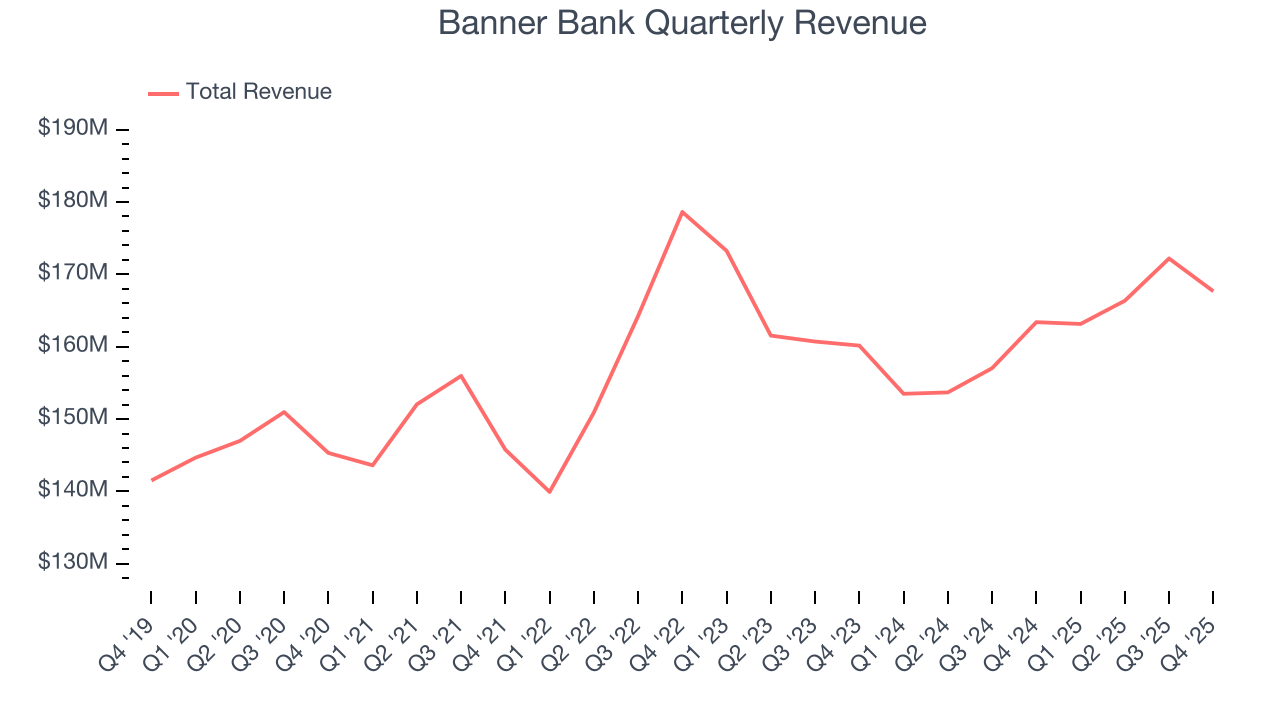
Long-term growth is the most important, but within financials, a half-decade historical view may miss recent interest rate changes and market returns. Banner Bank’s recent performance shows its demand has slowed as its annualized revenue growth of 1% over the last two years was below its five-year trend. 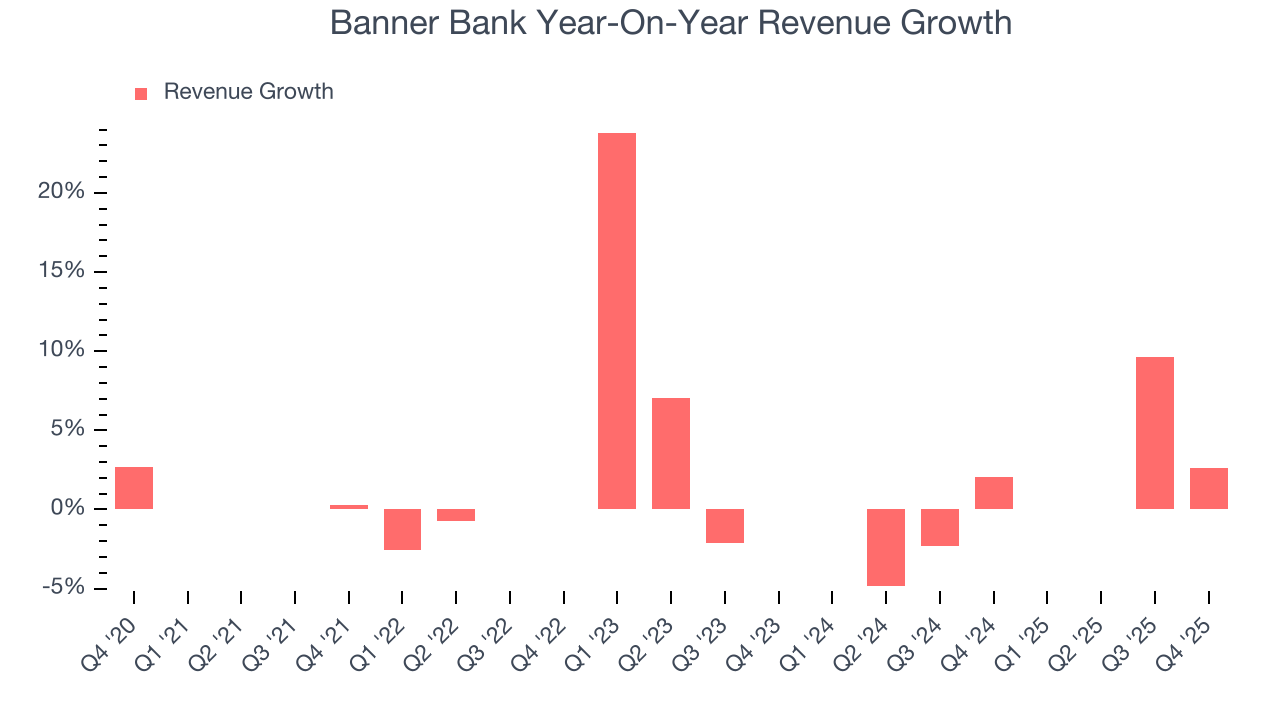 Note: Quarters not shown were determined to be outliers, impacted by outsized investment gains/losses that are not indicative of the recurring fundamentals of the business.
This quarter, Banner Bank’s revenue grew by 2.6% year on year to $167.7 million, falling short of Wall Street’s estimates.
Net interest income made up 86.5% of the company’s total revenue during the last five years, meaning Banner Bank barely relies on non-interest income to drive its overall growth.
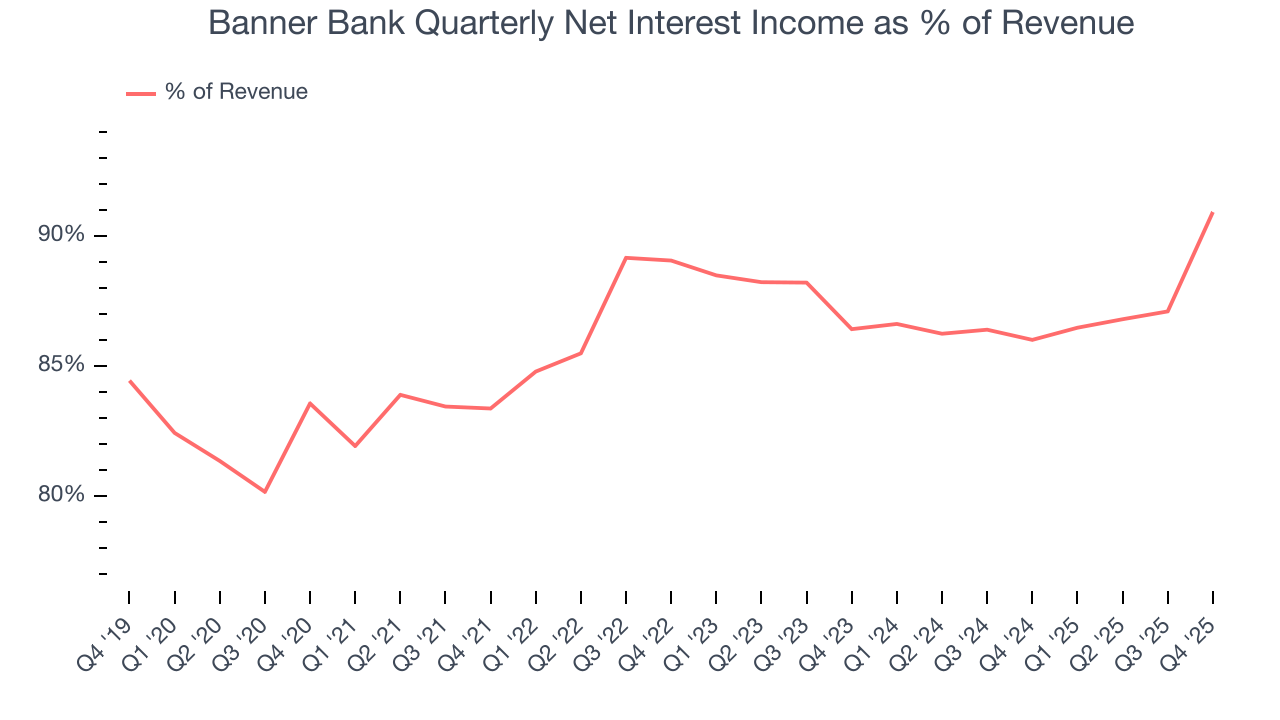
Net interest income commands greater market attention due to its reliability and consistency, whereas non-interest income is often seen as lower-quality revenue that lacks the same dependable characteristics.
6. Efficiency Ratio
The underlying profitability of top-line growth determines the actual bottom-line impact. Banking institutions measure this dynamic using the efficiency ratio, which is calculated by dividing non-interest expenses like personnel, facilities, technology, and marketing by total revenue.
Investors focus on efficiency ratio changes rather than absolute levels, understanding that expense structures vary by revenue mix. Counterintuitively, lower efficiency ratios indicate better performance since they represent lower costs relative to revenue.
Over the last five years, Banner Bank’s efficiency ratio has increased by 1.2 percentage points, hitting 60.8% for the past 12 months. Said differently, the company’s expenses have increased at a faster rate than revenue, which usually raises questions unless the company is in high-growth mode and reinvesting its profits into attractive ventures.
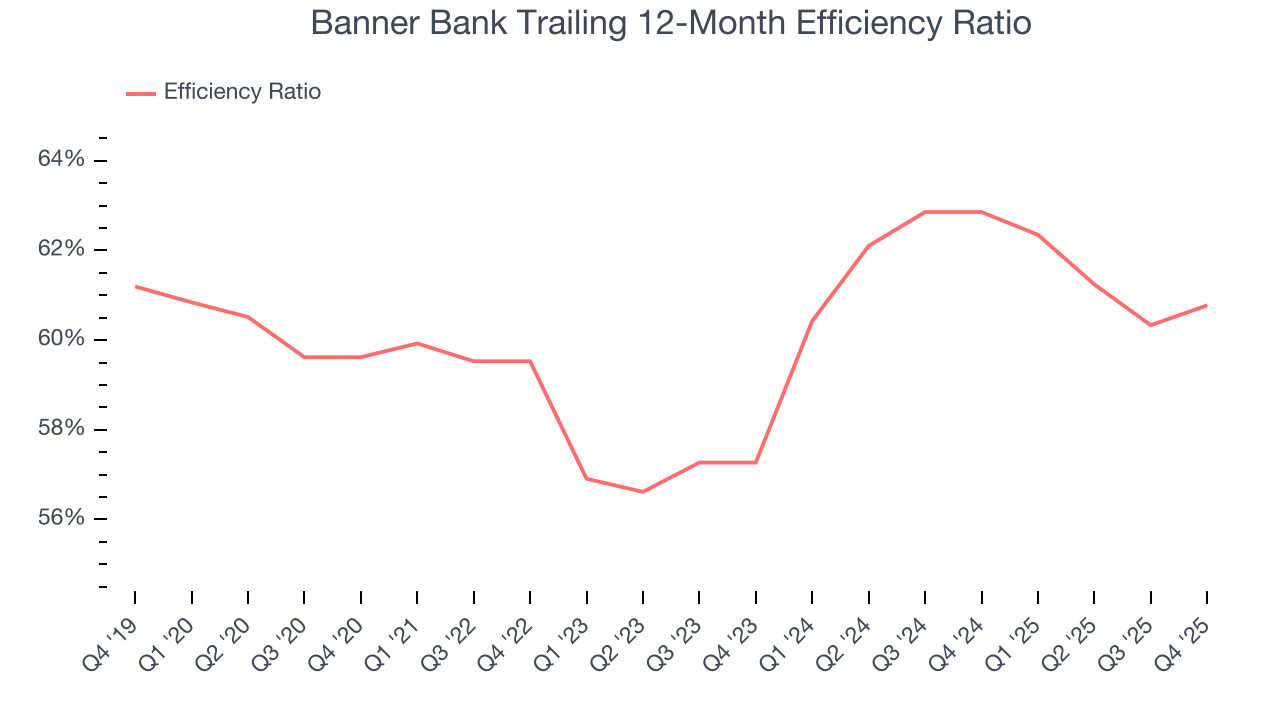
Banner Bank’s efficiency ratio came in at 62.1% this quarter, falling short of analysts’ expectations by 291.7 basis points (100 basis points = 1 percentage point).
For the next 12 months, Wall Street expects Banner Bank to rein in some of its expenses as it anticipates an efficiency ratio of 59.3%.
7. Earnings Per Share
We track the long-term change in earnings per share (EPS) for the same reason as long-term revenue growth. Compared to revenue, however, EPS highlights whether a company’s growth is profitable.
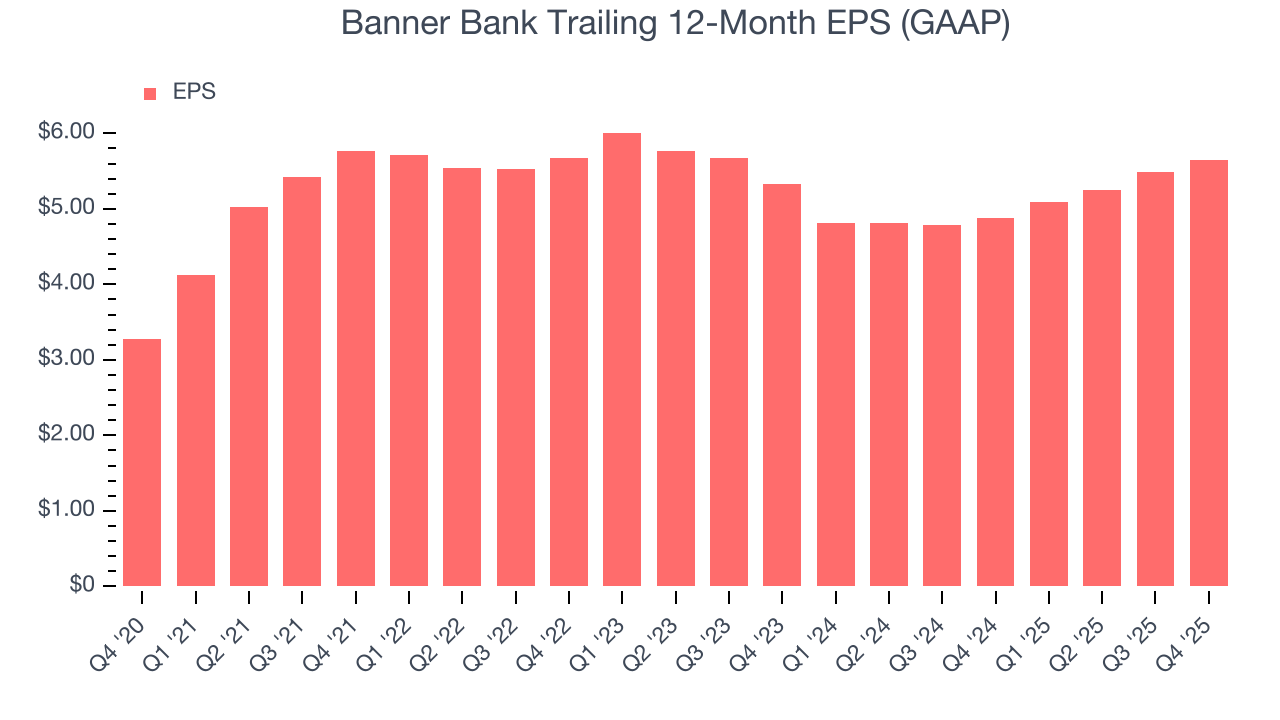
Banner Bank’s EPS grew at a decent 11.5% compounded annual growth rate over the last five years, higher than its 2.6% annualized revenue growth. This tells us the company became more profitable on a per-share basis as it expanded.
Diving into Banner Bank’s quality of earnings can give us a better understanding of its performance. A five-year view shows that Banner Bank has repurchased its stock, shrinking its share count by 2.9%. This tells us its EPS outperformed its revenue not because of increased operational efficiency but financial engineering, as buybacks boost per share earnings. 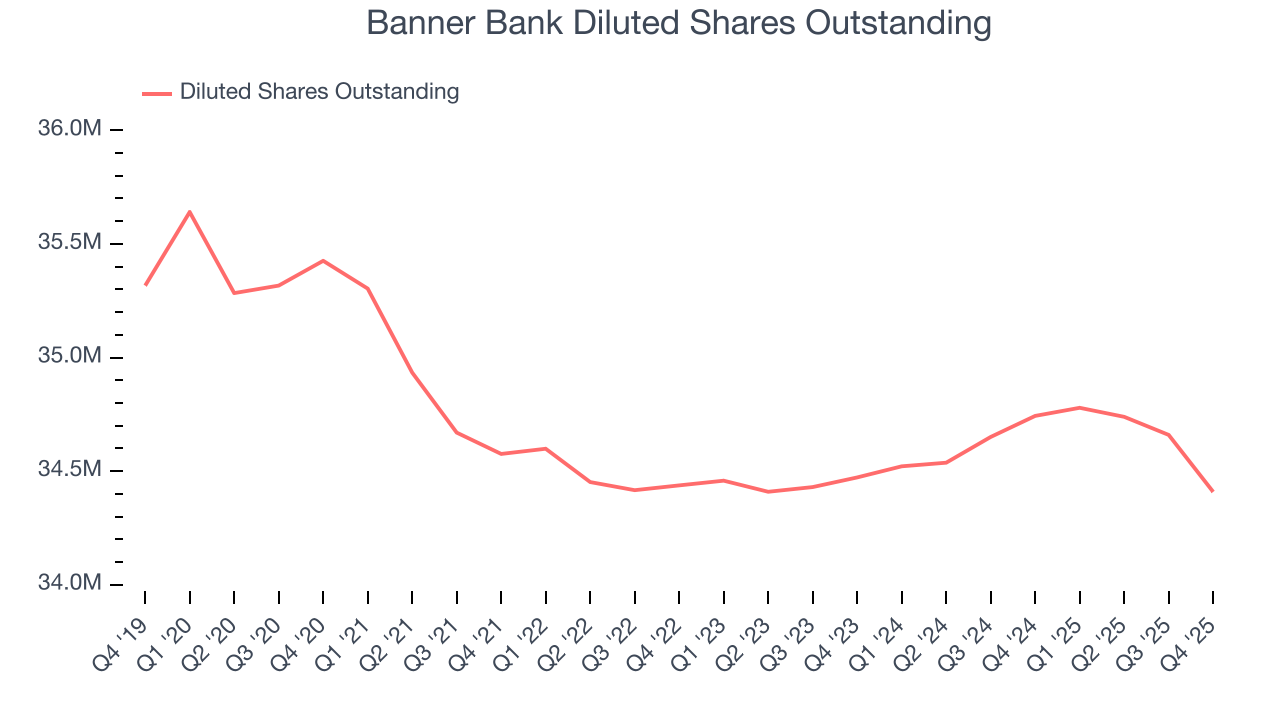
Like with revenue, we analyze EPS over a shorter period to see if we are missing a change in the business.
For Banner Bank, its two-year annual EPS growth of 2.9% was lower than its five-year trend. We hope its growth can accelerate in the future.
In Q4, Banner Bank reported EPS of $1.49, up from $1.34 in the same quarter last year. This print beat analysts’ estimates by 2.6%. Over the next 12 months, Wall Street expects Banner Bank’s full-year EPS of $5.64 to grow 5.3%.
8. Tangible Book Value Per Share (TBVPS)
The balance sheet drives banking profitability since earnings flow from the spread between borrowing and lending rates. As such, valuations for these companies concentrate on capital strength and sustainable equity accumulation potential.
This explains why tangible book value per share (TBVPS) stands as the premier banking metric. TBVPS strips away questionable intangible assets, revealing concrete per-share net worth that investors can trust. EPS can become murky due to acquisition impacts or accounting flexibility around loan provisions, and TBVPS resists financial engineering manipulation.
Banner Bank’s TBVPS grew at a mediocre 5% annual clip over the last five years. However, TBVPS growth has accelerated recently, growing by 11.5% annually over the last two years from $37.09 to $46.09 per share.
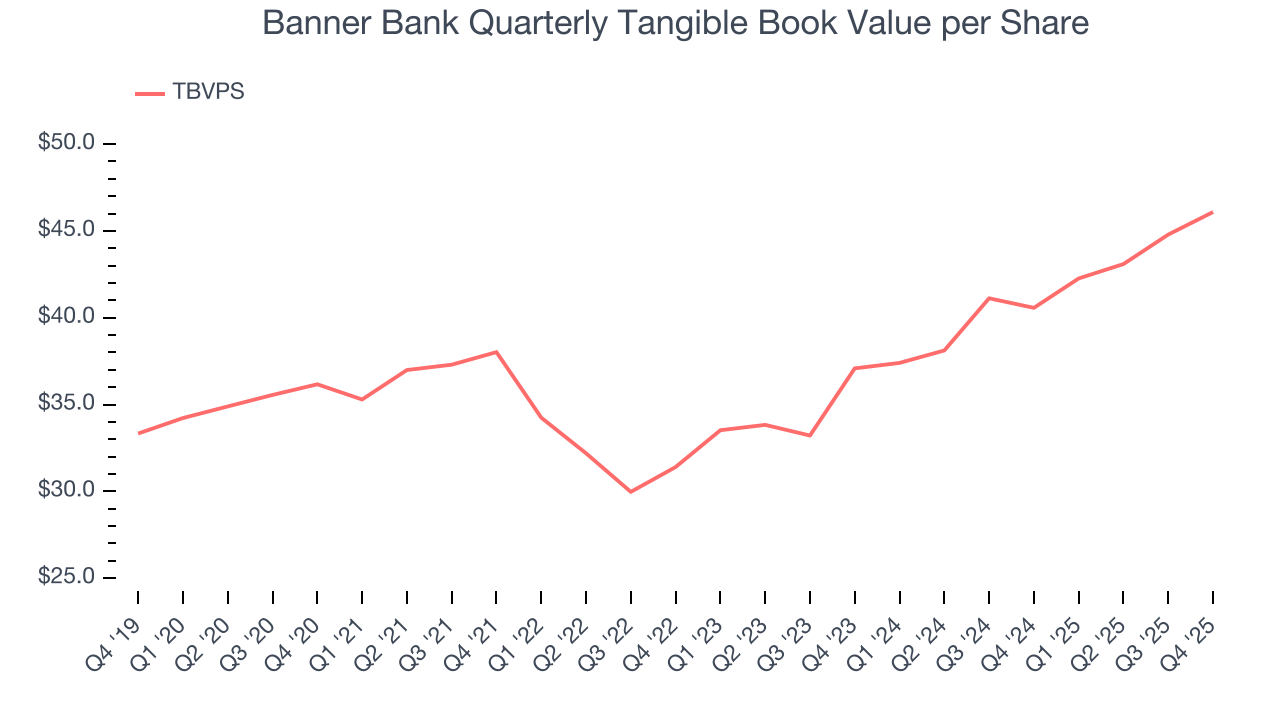
Over the next 12 months, Consensus estimates call for Banner Bank’s TBVPS to grow by 8.9% to $50.19, paltry growth rate.
9. Balance Sheet Assessment
Leverage is core to a financial firm’s business model (loans funded by deposits). To ensure economic stability and avoid a repeat of the 2008 GFC, regulators require certain levels of capital and liquidity, focusing on the Tier 1 capital ratio.
Tier 1 capital is the highest-quality capital that a firm holds, consisting primarily of common stock and retained earnings, but also physical gold. It serves as the primary cushion against losses and is the first line of defense in times of financial distress.
This capital is divided by risk-weighted assets to derive the Tier 1 capital ratio. Risk-weighted means that cash and US treasury securities are assigned little risk while unsecured consumer loans and equity investments get much higher risk weights, for example.
New regulation after the 2008 financial crisis requires that all firms must maintain a Tier 1 capital ratio greater than 4.5%. On top of this, there are additional buffers based on scale, risk profile, and other regulatory classifications, so that at the end of the day, firms generally must maintain a 7-10% ratio at minimum.
Over the last two years, Banner Bank has averaged a Tier 1 capital ratio of 12.5%, which is considered safe and well capitalized in the event that macro or market conditions suddenly deteriorate.
10. Return on Equity
Return on equity (ROE) reveals the profit generated per dollar of shareholder equity, which represents a key source of bank funding. Banks maintaining elevated ROE levels tend to accelerate wealth creation for shareholders via earnings retention, buybacks, and distributions.
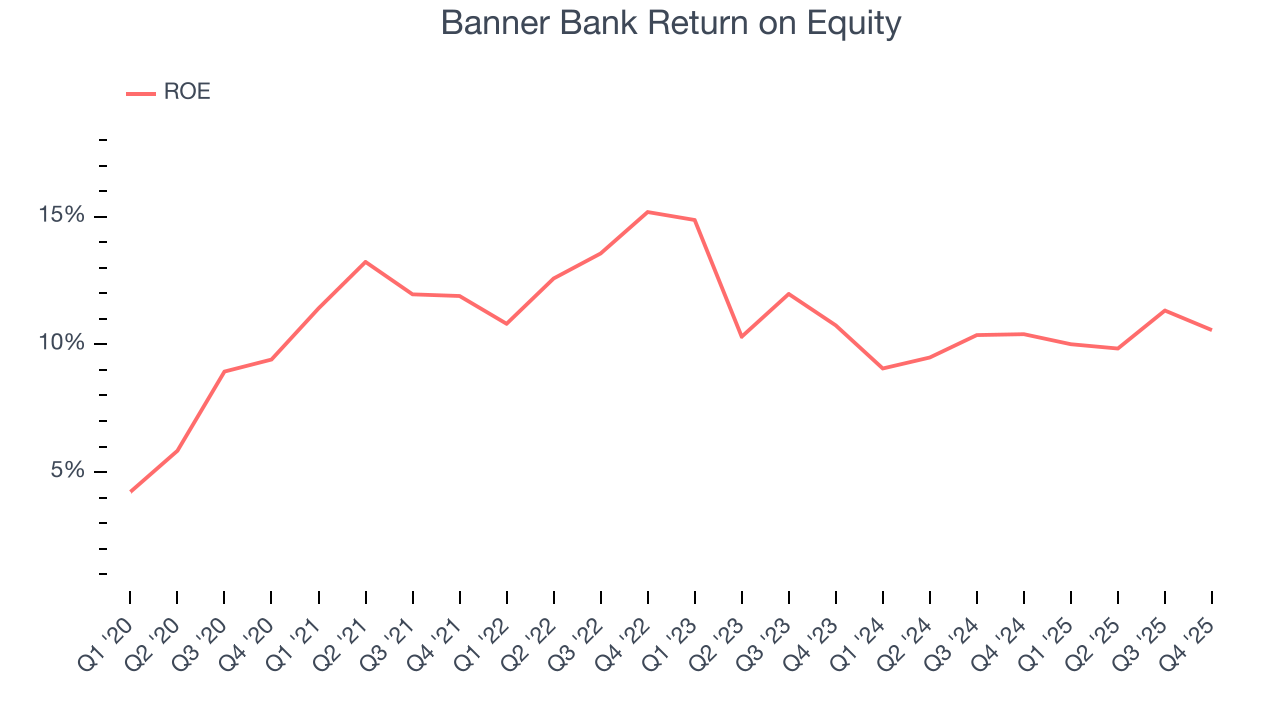
Over the last five years, Banner Bank has averaged an ROE of 11.5%, respectable for a company operating in a sector where the average shakes out around 7.5% and those putting up 15%+ are greatly admired.
11. Key Takeaways from Banner Bank’s Q4 Results
It was good to see Banner Bank narrowly top analysts’ tangible book value per share expectations this quarter. On the other hand, its revenue missed and its EPS slightly exceeded Wall Street’s estimates. Overall, this quarter could have been better. The stock remained flat at $66.03 immediately following the results.
12. Is Now The Time To Buy Banner Bank?
Updated: January 27, 2026 at 11:56 PM EST
Before making an investment decision, investors should account for Banner Bank’s business fundamentals and valuation in addition to what happened in the latest quarter.
Banner Bank isn’t a terrible business, but it doesn’t pass our bar. First off, its revenue growth was weak over the last five years. And while its net interest margin indicates a healthy starting point for the overall profitability of the business, the downside is its net interest income growth was weak over the last five years. On top of that, its projected EPS for the next year is lacking.
Banner Bank’s P/B ratio based on the next 12 months is 1x. While this valuation is fair, the upside isn’t great compared to the potential downside. We're pretty confident there are more exciting stocks to buy at the moment.
Wall Street analysts have a consensus one-year price target of $71.17 on the company (compared to the current share price of $61.32).
Although the price target is bullish, readers should exercise caution because analysts tend to be overly optimistic. The firms they work for, often big banks, have relationships with companies that extend into fundraising, M&A advisory, and other rewarding business lines. As a result, they typically hesitate to say bad things for fear they will lose out. We at StockStory do not suffer from such conflicts of interest, so we’ll always tell it like it is.