
Brighthouse Financial (BHF)
Brighthouse Financial keeps us up at night. Its weak sales growth and low returns on capital show it struggled to generate demand and profits.― StockStory Analyst Team
1. News


2. Summary
Why We Think Brighthouse Financial Will Underperform
Spun off from MetLife in 2017 to focus specifically on retail financial products, Brighthouse Financial (NASDAQ:BHF) provides annuity contracts and life insurance products designed to help individuals protect wealth, generate income, and transfer assets.
- Insurance offerings face significant market challenges this cycle as net premiums earned contracted by 7.7% annually over the last five years
- Insurance policy sales contracted this cycle as net premiums earned decreased by 2.8% annually over the last two years


Brighthouse Financial doesn’t measure up to our expectations. We believe there are better businesses elsewhere.
Why There Are Better Opportunities Than Brighthouse Financial


Brighthouse Financial’s stock price of $60.19 implies a valuation ratio of 0.7x forward P/B. This is a cheap valuation multiple, but for good reason. You get what you pay for.
Our advice is to pay up for elite businesses whose advantages are tailwinds to earnings growth. Don’t get sucked into lower-quality businesses just because they seem like bargains. These mediocre businesses often never achieve a higher multiple as hoped, a phenomenon known as a “value trap”.
3. Brighthouse Financial (BHF) Research Report: Q3 CY2025 Update
Insurance and annuity provider Brighthouse Financial (NASDAQ:BHF) fell short of the markets revenue expectations in Q3 CY2025, with sales falling 16.6% year on year to $1.82 billion. Its non-GAAP profit of $4.54 per share was 10.3% below analysts’ consensus estimates.
Brighthouse Financial (BHF) Q3 CY2025 Highlights:
Company Overview
Spun off from MetLife in 2017 to focus specifically on retail financial products, Brighthouse Financial (NASDAQ:BHF) provides annuity contracts and life insurance products designed to help individuals protect wealth, generate income, and transfer assets.
Brighthouse Financial operates through three main segments: Annuities, Life, and Run-off. The Annuities segment forms the core of its business, offering products like Shield Annuities that provide market participation with downside protection, fixed deferred annuities that credit interest based on rates or index performance, and income annuities that deliver steady retirement income streams.
The company's Life segment offers term life policies providing death benefits for fixed premium payments, universal life products with index-linked benefits, and manages a significant in-force book of whole and variable life policies. Its SmartCare product combines life insurance with long-term care benefits, allowing policyholders to accelerate the death benefit to pay for qualified care expenses.
Brighthouse distributes its products through a network of independent financial advisors, broker-dealers, banks, and other distribution partners rather than captive agents. This strategy allows the company to maintain a leaner operational structure while reaching customers through trusted financial professionals who can incorporate Brighthouse products into comprehensive financial plans.
The company generates revenue primarily through premium payments, fees on variable products, and investment income from the assets backing its insurance obligations. When a customer purchases an annuity or life insurance policy, Brighthouse invests the premiums to generate returns that help fund future benefit payments while managing the associated risks through hedging strategies.
The Run-off segment contains products no longer actively sold, including universal life with secondary guarantees and structured settlements, which are managed separately from the company's core business lines.
4. Life Insurance
Life insurance companies collect premiums from policyholders in exchange for providing a future death benefit or retirement income stream. Interest rates matter for the sector (and make it cyclical), with higher rates allowing insurers to reinvest their fixed-income portfolios at more attractive yields and vice versa. Additionally, favorable demographic shifts, such as an aging population, are driving strong demand for retirement products while AI and data analytics offer significant opportunities to improve underwriting accuracy and operational efficiency. Conversely, the industry faces headwinds from persistent competition from agile insurtechs that threaten traditional distribution models.
Brighthouse Financial competes with major life insurance and annuity providers including Prudential Financial (NYSE:PRU), Lincoln National (NYSE:LNC), Equitable Holdings (NYSE:EQH), and American Equity Investment Life (NYSE:AEL). The company also faces competition from diversified financial services firms like Principal Financial Group (NASDAQ:PFG) and Ameriprise Financial (NYSE:AMP).
5. Revenue Growth
Insurance companies earn revenue from three primary sources: 1) The core insurance business itself, often called underwriting and represented in the income statement as premiums 2) Income from investing the “float” (premiums collected upfront not yet paid out as claims) in assets such as fixed-income assets and equities 3) Fees from various sources such as policy administration, annuities, or other value-added services. Unfortunately, Brighthouse Financial’s 1.1% annualized revenue growth over the last five years was weak. This fell short of our benchmarks and is a rough starting point for our analysis.
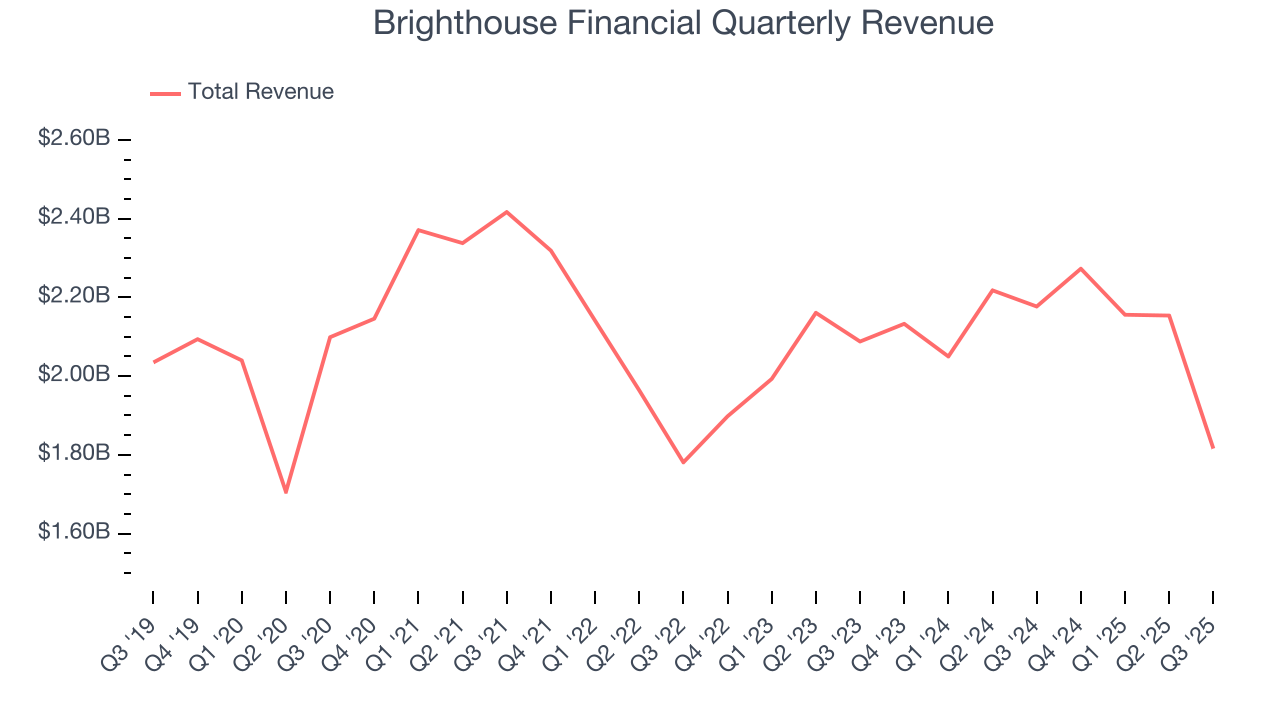
Long-term growth is the most important, but within financials, a half-decade historical view may miss recent interest rate changes and market returns. Brighthouse Financial’s annualized revenue growth of 1.6% over the last two years aligns with its five-year trend, suggesting its demand was consistently weak. 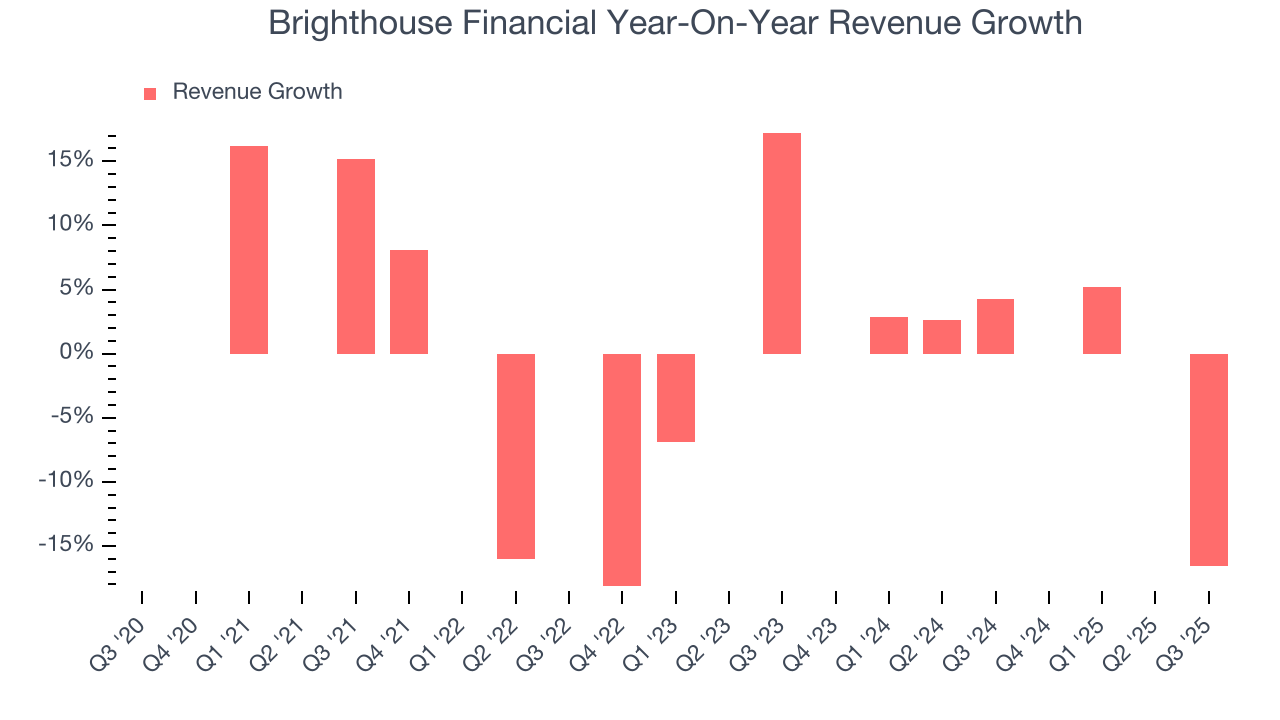 Note: Quarters not shown were determined to be outliers, impacted by outsized investment gains/losses that are not indicative of the recurring fundamentals of the business.
This quarter, Brighthouse Financial missed Wall Street’s estimates and reported a rather uninspiring 16.6% year-on-year revenue decline, generating $1.82 billion of revenue.
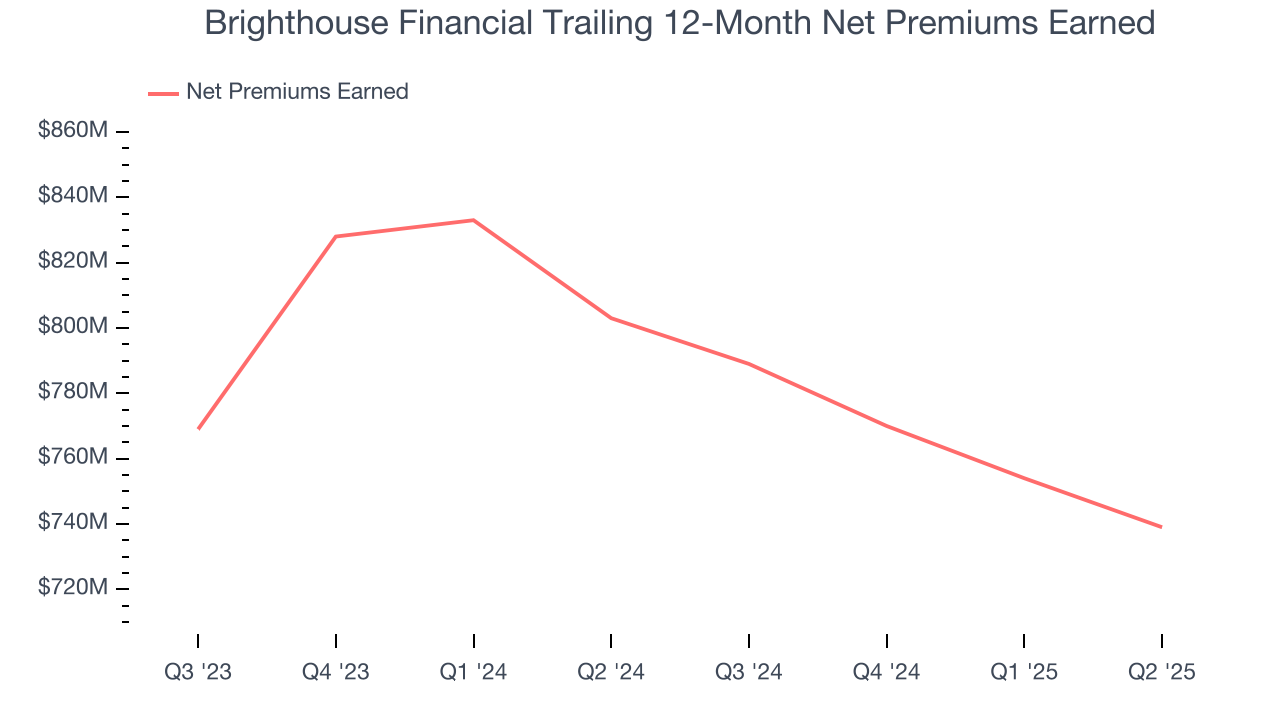
Net premiums earned made up 8.6% of the company’s total revenue during the last five years, meaning Brighthouse Financial is well diversified and has a variety of income streams driving its overall growth. Nevertheless, net premiums earned is critical to analyze for insurers because they’re considered a higher-quality, more recurring revenue source by investors.

6. Net Premiums Earned
When insurers sell policies, they protect themselves from extremely large losses or an outsized accumulation of losses with reinsurance (insurance for insurance companies). Net premiums earned are therefore gross premiums less what’s ceded to reinsurers as a risk mitigation and transfer strategy.
Brighthouse Financial’s net premiums earned has declined by 1.4% annually over the last five years, much worse than the broader insurance industry. This shows that policy underwriting underperformed its other business lines.
When analyzing Brighthouse Financial’s net premiums earned over the last two years, we can paint a similar picture as income dropped by 1.4% annually. Since two-year net premiums earned underperformed total revenue over this period, it’s implied that insurance policies were a detractor of consolidated growth.
7. Pre-Tax Profit Margin
Revenue growth is one major determinant of business quality, and the efficiency of operations is another. For insurance companies, we look at pre-tax profit rather than the operating margin that defines sectors such as consumer, tech, and industrials.
The economics of insurers are driven by their balance sheets, where assets (investing the float + premiums receivable) and liabilities (claims to pay) define the fundamentals. Interest income and expense should therefore be factored into the definition of profit but taxes - which are largely out of a company’s control - should not.
Over the last four years, Brighthouse Financial’s pre-tax profit margin has fallen by 30.6 percentage points, going from negative 16.9% to 13.8%. It has also expanded by 17 percentage points on a two-year basis, showing its expenses have consistently grown at a slower rate than revenue. This typically signals prudent management.
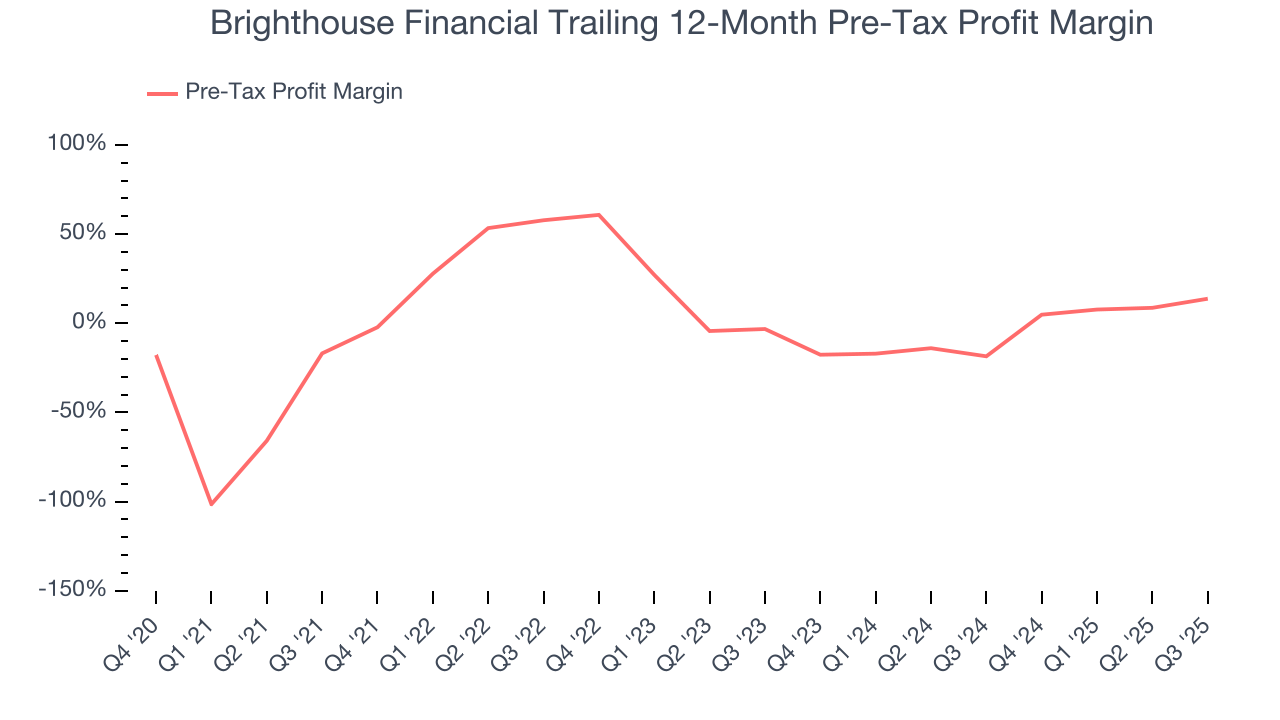
Brighthouse Financial’s pre-tax profit margin came in at 32.2% this quarter. This result was 23.6 percentage points better than the same quarter last year.
8. Earnings Per Share
We track the long-term change in earnings per share (EPS) for the same reason as long-term revenue growth. Compared to revenue, however, EPS highlights whether a company’s growth is profitable.
Brighthouse Financial’s full-year EPS flipped from negative to positive over the last five years. This is encouraging and shows it’s at a critical moment in its life.
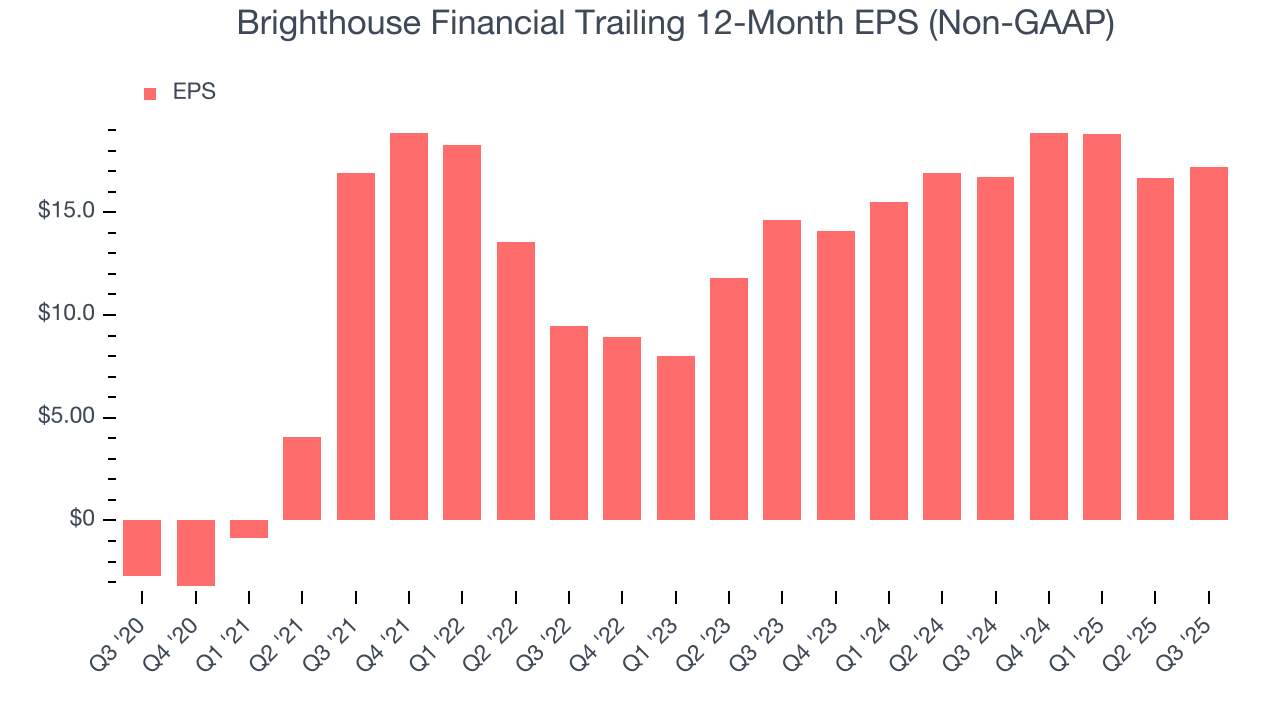
Like with revenue, we analyze EPS over a shorter period to see if we are missing a change in the business.
Brighthouse Financial’s EPS grew at a weak 8.5% compounded annual growth rate over the last two years. On the bright side, this performance was higher than its 1.6% annualized revenue growth and tells us the company became more profitable on a per-share basis as it expanded.
Diving into the nuances of Brighthouse Financial’s earnings can give us a better understanding of its performance. Brighthouse Financial’s pre-tax profit margin has expanded over the last two yearswhile its share count has shrunk 13.1%. These are positive signs for shareholders because improving profitability and share buybacks turbocharge EPS growth relative to revenue growth. 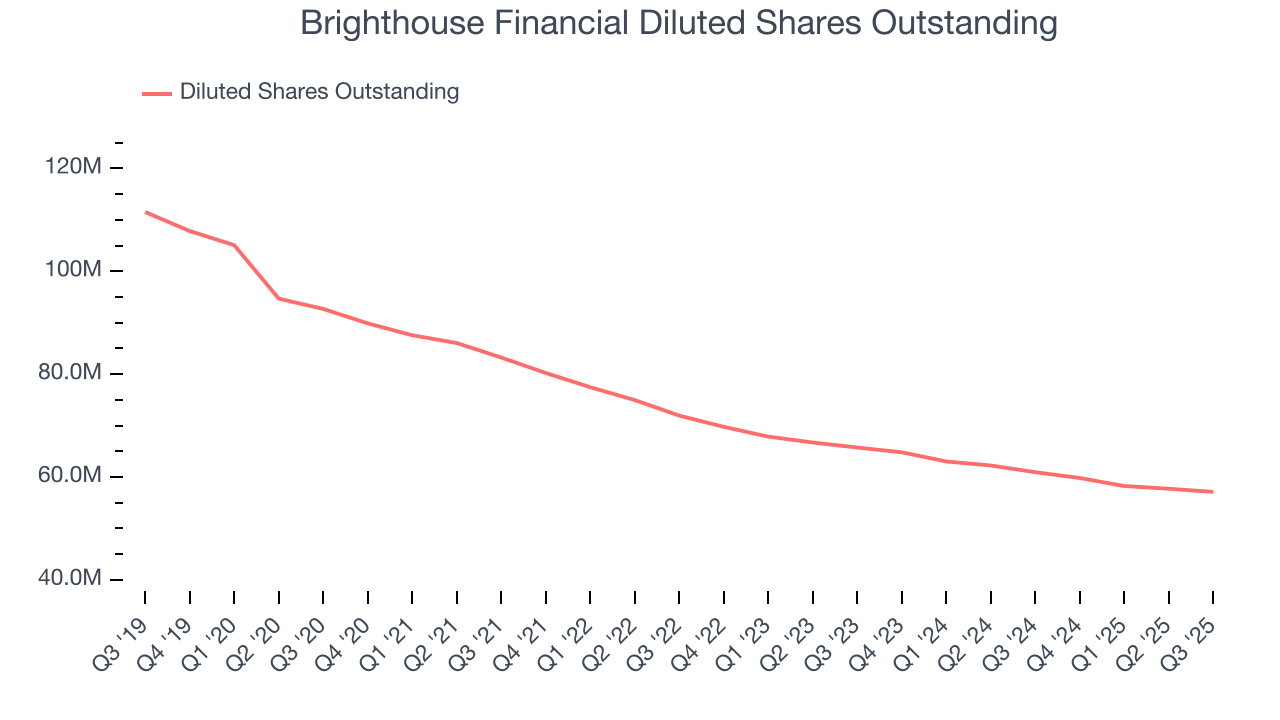
In Q3, Brighthouse Financial reported adjusted EPS of $4.54, up from $3.99 in the same quarter last year. Despite growing year on year, this print missed analysts’ estimates, but we care more about long-term adjusted EPS growth than short-term movements. Over the next 12 months, Wall Street expects Brighthouse Financial’s full-year EPS of $17.21 to grow 23.6%.
9. Book Value Per Share (BVPS)
Insurance companies are balance sheet businesses, collecting premiums upfront and paying out claims over time. The float–premiums collected but not yet paid out–are invested, creating an asset base supported by a liability structure. Book value per share (BVPS) captures this dynamic by measuring these assets (investment portfolio, cash, reinsurance recoverables) less liabilities (claim reserves, debt, future policy benefits). BVPS is essentially the residual value for shareholders.
We therefore consider BVPS very important to track for insurers and a metric that sheds light on business quality because it reflects long-term capital growth and is harder to manipulate than more commonly-used metrics like EPS.
Brighthouse Financial’s BVPS declined at a 11.1% annual clip over the last five years. However, BVPS growth has accelerated recently, growing by 33.1% annually over the last two years from $62.89 to $111.39 per share.
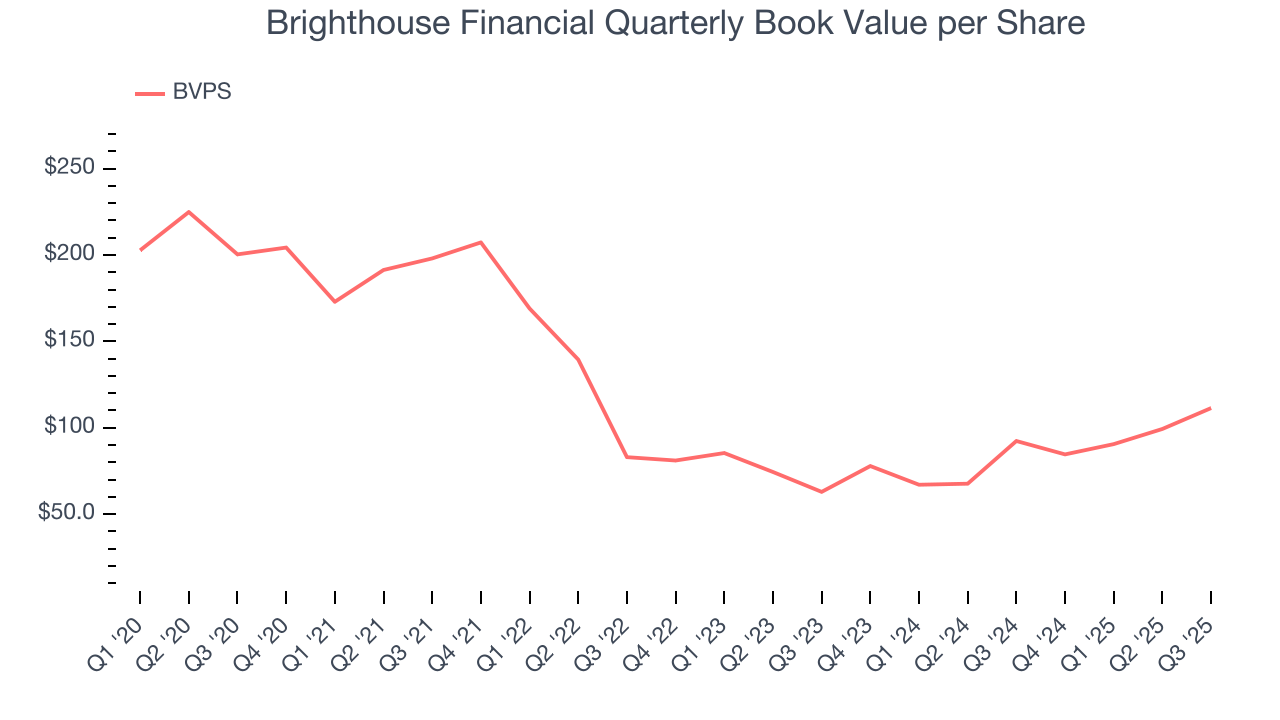
Over the next 12 months, Consensus estimates call for Brighthouse Financial’s BVPS to grow by 67.3% to $155.41, elite growth rate.
10. Balance Sheet Risk
The debt-to-equity ratio is a widely used measure to assess a company's balance sheet health. A higher ratio means that a business aggressively financed its growth with debt. This can result in higher earnings (if the borrowed funds are invested profitably) but also increases risk.
If debt levels are too high, there could be difficulties in meeting obligations, especially during economic downturns or periods of rising interest rates if the debt has variable-rate payments.
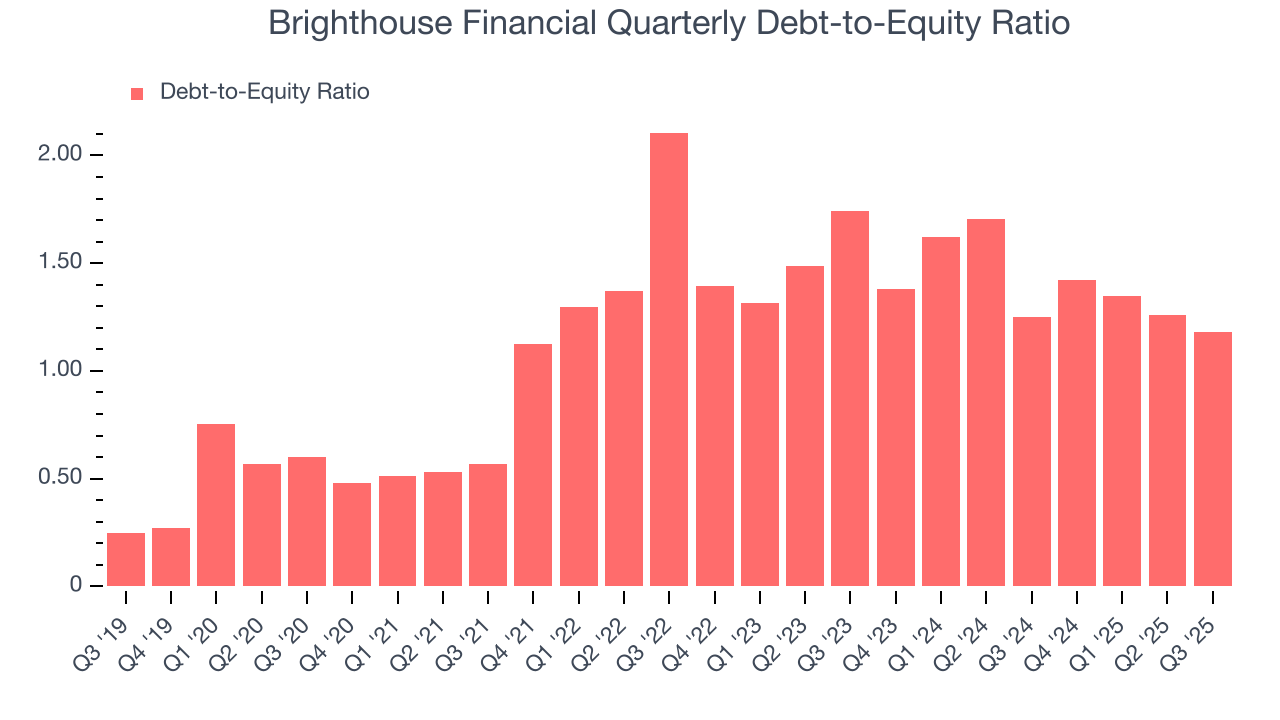
Brighthouse Financial currently has $7.50 billion of debt and $6.36 billion of shareholder's equity on its balance sheet, and over the past four quarters, has averaged a debt-to-equity ratio of 1.3×. We think this is dangerous - for an insurance business, anything above 1.0× raises red flags.
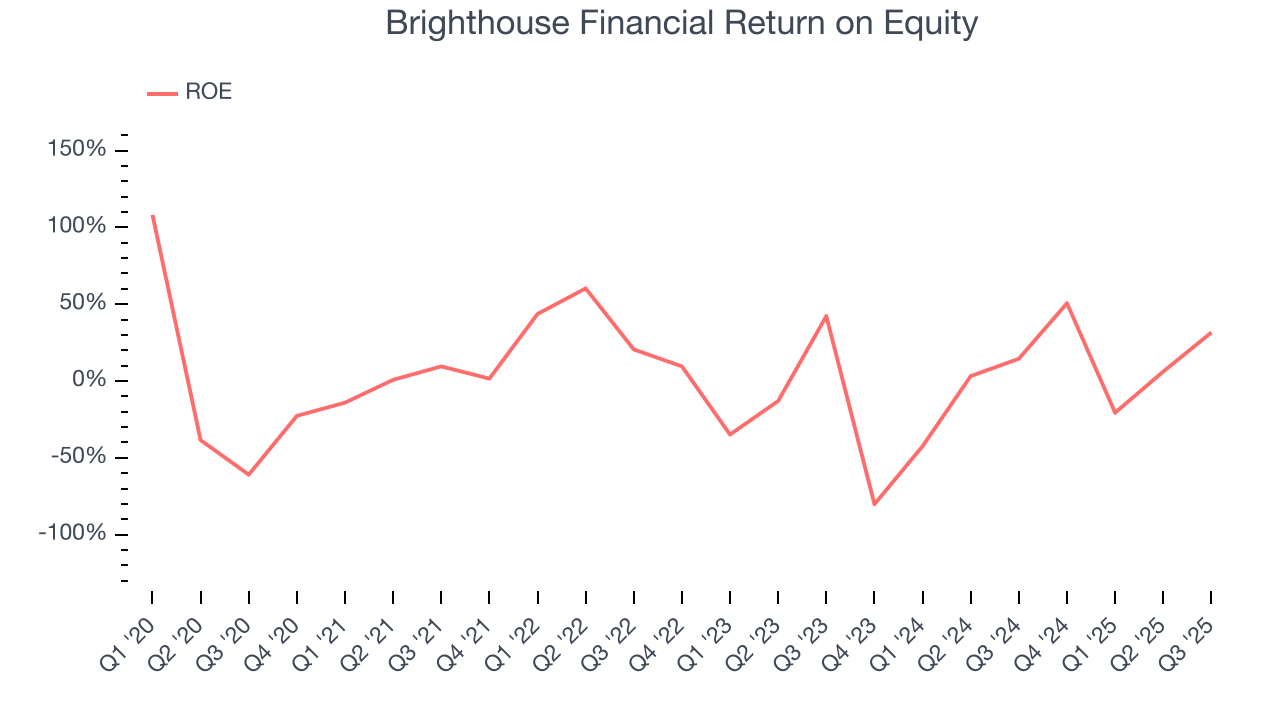
11. Return on Equity
Return on Equity, or ROE, ties everything together and is a vital metric. It tells us how much profit the insurer generates for each dollar of shareholder equity entrusted to management. Over a long period, insurers with higher ROEs tend to compound shareholder wealth faster through retained earnings, buybacks, and dividends.
Over the last five years, Brighthouse Financial has averaged an ROE of 3.3%, uninspiring for a company operating in a sector where the average shakes out around 12.5%.
12. Key Takeaways from Brighthouse Financial’s Q3 Results
We struggled to find many positives in these results. Its revenue missed and its EPS fell short of Wall Street’s estimates. Overall, this was a softer quarter. The stock remained flat at $65.65 immediately following the results.
13. Is Now The Time To Buy Brighthouse Financial?
Updated: March 13, 2026 at 12:40 AM EDT
Before deciding whether to buy Brighthouse Financial or pass, we urge investors to consider business quality, valuation, and the latest quarterly results.
We cheer for all companies serving everyday consumers, but in the case of Brighthouse Financial, we’ll be cheering from the sidelines. To begin with, its revenue growth was weak over the last five years, and analysts don’t see anything changing over the next 12 months. While its expanding pre-tax profit margin shows the business has become more efficient, the downside is its relatively low ROE suggests management has struggled to find compelling investment opportunities. On top of that, its BVPS has declined over the last five years.
Brighthouse Financial’s P/B ratio based on the next 12 months is 0.7x. While this valuation is optically cheap, the potential downside is huge given its shaky fundamentals. There are more exciting stocks to buy at the moment.
Wall Street analysts have a consensus one-year price target of $65.50 on the company (compared to the current share price of $60.19).