Bruker (BRKR)
We’re skeptical of Bruker. Its weak sales growth and declining returns on capital show its demand and profits are shrinking.― StockStory Analyst Team
1. News


2. Summary
Why We Think Bruker Will Underperform
With roots dating back to the pioneering days of nuclear magnetic resonance technology, Bruker (NASDAQ:BRKR) develops and manufactures high-performance scientific instruments that enable researchers and industrial analysts to explore materials at microscopic, molecular, and cellular levels.
- Absence of organic revenue growth over the past two years suggests it may have to lean into acquisitions to drive its expansion
- Estimated sales growth of 4.2% for the next 12 months implies demand will slow from its two-year trend
- On the bright side, its market-beating returns on capital illustrate that management has a knack for investing in profitable ventures


Bruker’s quality doesn’t meet our bar. There are more rewarding stocks elsewhere.
Why There Are Better Opportunities Than Bruker


Bruker is trading at $36.69 per share, or 17.3x forward P/E. Bruker’s valuation may seem like a bargain, especially when stacked up against other healthcare companies. We remind you that you often get what you pay for, though.
We’d rather pay up for companies with elite fundamentals than get a bargain on weak ones. Cheap stocks can be value traps, and as their performance deteriorates, they will stay cheap or get even cheaper.
3. Bruker (BRKR) Research Report: Q4 CY2025 Update
Scientific instrument company Bruker (NASDAQ:BRKR). reported Q4 CY2025 results beating Wall Street’s revenue expectations, but sales were flat year on year at $977.2 million. The company’s full-year revenue guidance of $3.59 billion at the midpoint came in 3.1% above analysts’ estimates. Its non-GAAP profit of $0.59 per share was 10.9% below analysts’ consensus estimates.
Bruker (BRKR) Q4 CY2025 Highlights:
- Revenue: $977.2 million vs analyst estimates of $963.3 million (flat year on year, 1.4% beat)
- Adjusted EPS: $0.59 vs analyst expectations of $0.66 (10.9% miss)
- Adjusted EBITDA: $134.4 million vs analyst estimates of $189.5 million (13.8% margin, 29.1% miss)
- Adjusted EPS guidance for the upcoming financial year 2026 is $2.13 at the midpoint, missing analyst estimates by 0.8%
- Operating Margin: 7.8%, in line with the same quarter last year
- Free Cash Flow Margin: 21.2%, up from 15.6% in the same quarter last year
- Organic Revenue fell 5% year on year (beat)
- Market Capitalization: $6.45 billion
Company Overview
With roots dating back to the pioneering days of nuclear magnetic resonance technology, Bruker (NASDAQ:BRKR) develops and manufactures high-performance scientific instruments that enable researchers and industrial analysts to explore materials at microscopic, molecular, and cellular levels.
Bruker's product portfolio spans four main business segments, each addressing different scientific and industrial needs. The BSI BioSpin segment focuses on magnetic resonance technologies, including nuclear magnetic resonance (NMR) and electron paramagnetic resonance (EPR) systems that help scientists determine molecular structures and dynamics. These instruments are crucial for pharmaceutical research, allowing scientists to understand how drugs interact with target molecules.
The BSI CALID segment specializes in mass spectrometry and molecular spectroscopy instruments. Its MALDI Biotyper system has revolutionized clinical microbiology by enabling rapid identification of bacteria and fungi from patient samples, significantly reducing the time needed for diagnosis. The segment also offers molecular diagnostic solutions for infectious diseases, including tuberculosis and viral hepatitis.
In the BSI Nano segment, Bruker provides X-ray analysis instruments, atomic force microscopes, and optical metrology systems. These tools allow researchers to visualize and analyze materials at nanometer resolution, critical for semiconductor manufacturing, materials science, and nanotechnology development. For example, a semiconductor manufacturer might use Bruker's X-ray diffraction systems to analyze the crystalline structure of silicon wafers.
The BEST segment produces superconducting materials and devices primarily used in magnetic resonance imaging (MRI) machines, nuclear magnetic resonance systems, and fusion energy research. These specialized materials enable the powerful magnetic fields required for advanced imaging and research applications.
Bruker maintains manufacturing facilities across North America, Europe, and Asia, with a global sales and service network. The company invests significantly in research and development to maintain technological leadership, often collaborating with academic institutions and research centers to develop new analytical techniques and applications.
The company's customers span a diverse range of fields, including pharmaceutical and biotechnology companies using Bruker's instruments for drug discovery; clinical laboratories employing its diagnostic systems; semiconductor manufacturers utilizing its metrology tools; and academic and government research institutions applying its technologies across various scientific disciplines.
4. Research Tools & Consumables
The life sciences subsector specializing in research tools and consumables enables scientific discoveries across academia, biotechnology, and pharmaceuticals. These firms supply a wide range of essential laboratory products, ensuring a recurring revenue stream through repeat purchases and replenishment. Their business models benefit from strong customer loyalty, a diversified product portfolio, and exposure to both the research and clinical markets. However, challenges include high R&D investment to maintain technological leadership, pricing pressures from budget-conscious institutions, and vulnerability to fluctuations in research funding cycles. Looking ahead, this subsector stands to benefit from tailwinds such as growing demand for tools supporting emerging fields like synthetic biology and personalized medicine. There is also a rise in automation and AI-driven solutions in laboratories that could create new opportunities to sell tools and consumables. Nevertheless, headwinds exist. These companies tend to be at the mercy of supply chain disruptions and sensitivity to macroeconomic conditions that impact funding for research initiatives.
Bruker's competitors vary across its business segments. In magnetic resonance technology, it competes with JEOL, Oxford Instruments, and Nanalysis. In mass spectrometry and analytical instruments, major competitors include Thermo Fisher Scientific, Agilent Technologies, Waters Corporation, and Shimadzu. In the microbiology and diagnostics space, Bruker faces competition from bioMérieux and various molecular diagnostics companies.
5. Economies of Scale
Larger companies benefit from economies of scale, where fixed costs like infrastructure, technology, and administration are spread over a higher volume of goods or services, reducing the cost per unit. Scale can also lead to bargaining power with suppliers, greater brand recognition, and more investment firepower. A virtuous cycle can ensue if a scaled company plays its cards right.
With $3.44 billion in revenue over the past 12 months, Bruker has decent scale. This is important as it gives the company more leverage in a heavily regulated, competitive environment that is complex and resource-intensive.
6. Revenue Growth
Reviewing a company’s long-term sales performance reveals insights into its quality. Any business can put up a good quarter or two, but the best consistently grow over the long haul. Over the last five years, Bruker grew its sales at a decent 11.6% compounded annual growth rate. Its growth was slightly above the average healthcare company and shows its offerings resonate with customers.
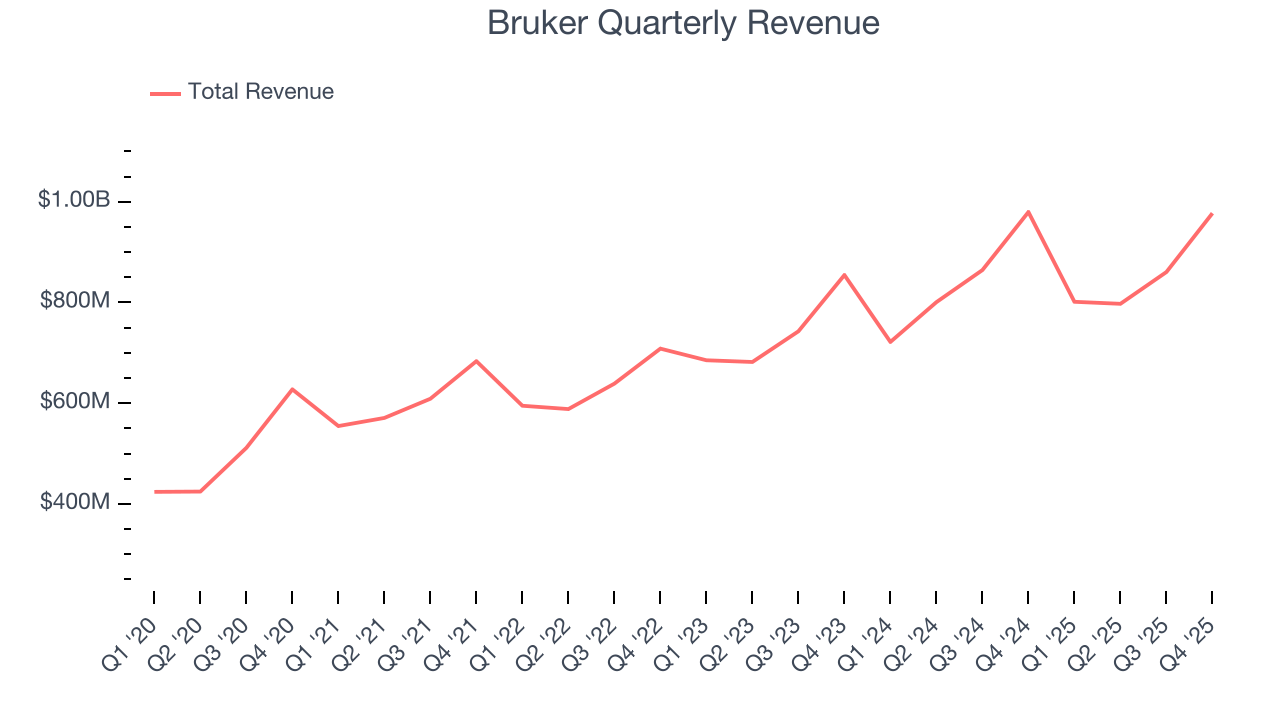
We at StockStory place the most emphasis on long-term growth, but within healthcare, a half-decade historical view may miss recent innovations or disruptive industry trends. Bruker’s annualized revenue growth of 7.7% over the last two years is below its five-year trend, but we still think the results were respectable. 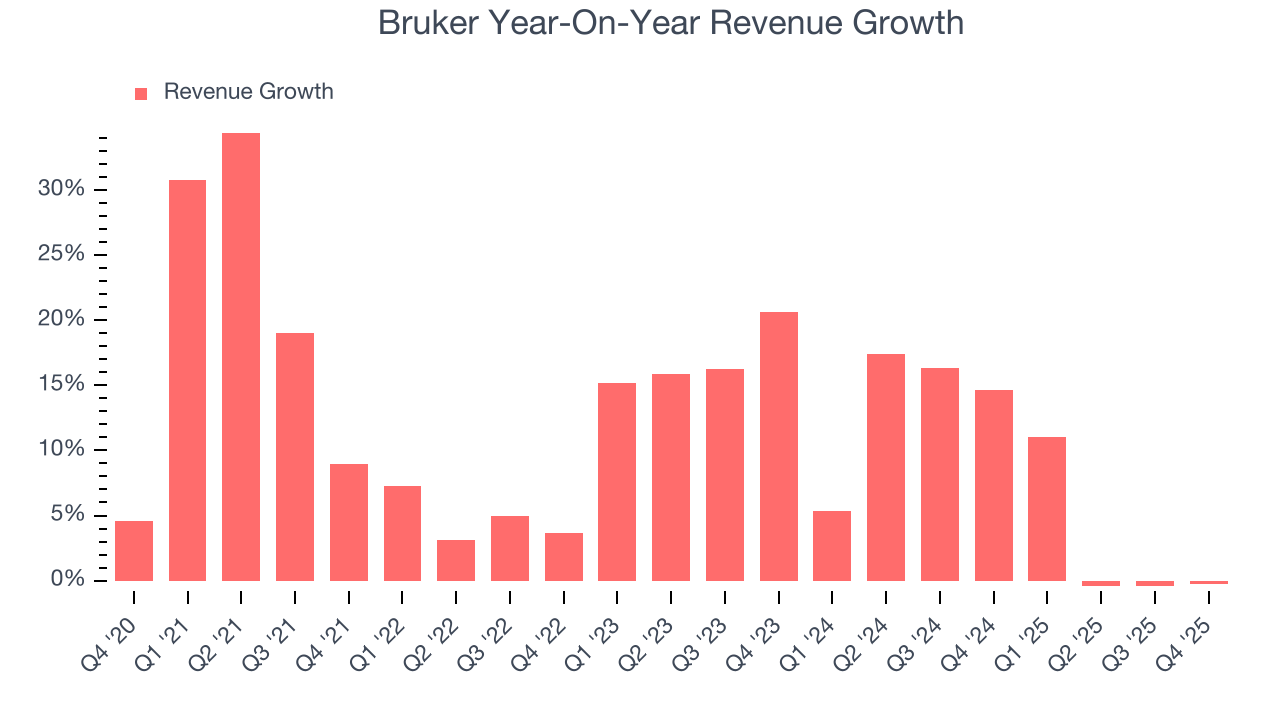
We can better understand the company’s sales dynamics by analyzing its organic revenue, which strips out one-time events like acquisitions and currency fluctuations that don’t accurately reflect its fundamentals. Over the last two years, Bruker’s organic revenue was flat. Because this number is lower than its two-year revenue growth, we can see that some mixture of acquisitions and foreign exchange rates boosted its headline results. 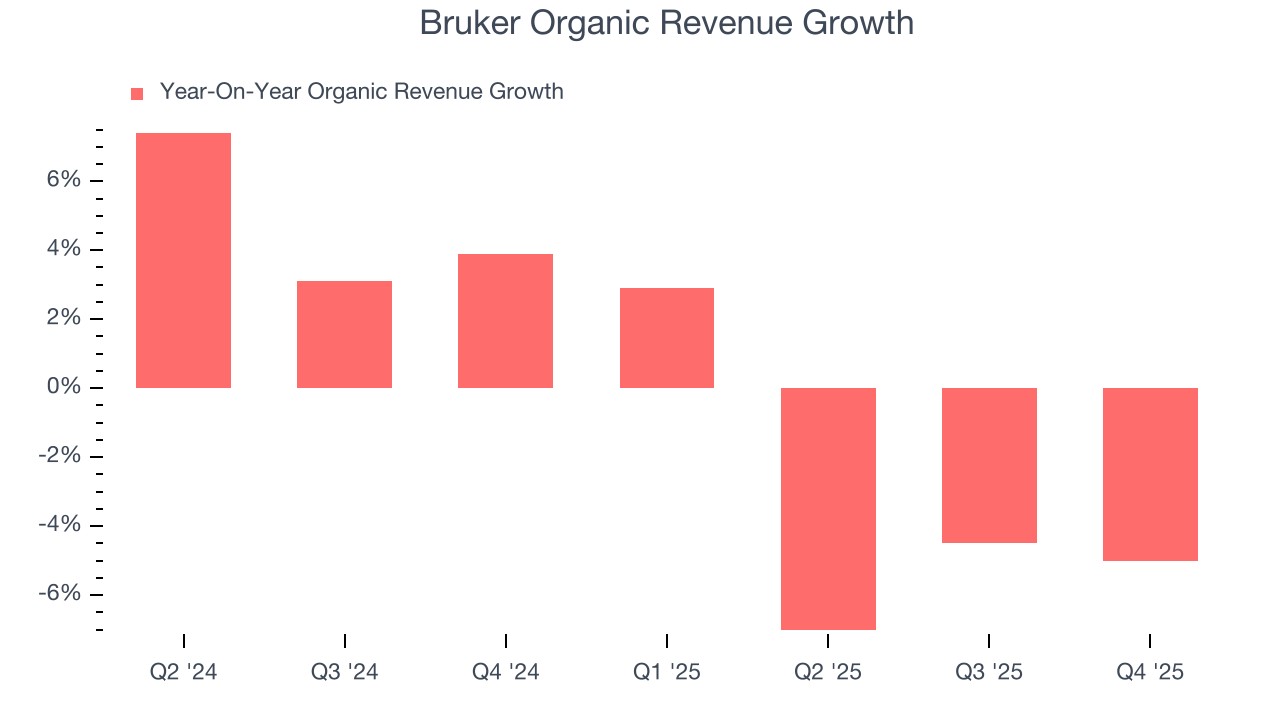
This quarter, Bruker’s $977.2 million of revenue was flat year on year but beat Wall Street’s estimates by 1.4%.
Looking ahead, sell-side analysts expect revenue to grow 1.5% over the next 12 months, a deceleration versus the last two years. This projection is underwhelming and suggests its products and services will face some demand challenges.
7. Operating Margin
Operating margin is an important measure of profitability as it shows the portion of revenue left after accounting for all core expenses – everything from the cost of goods sold to advertising and wages. It’s also useful for comparing profitability across companies with different levels of debt and tax rates because it excludes interest and taxes.
Bruker has done a decent job managing its cost base over the last five years. The company has produced an average operating margin of 10.9%, higher than the broader healthcare sector.
Looking at the trend in its profitability, Bruker’s operating margin decreased by 15.1 percentage points over the last five years. The company’s two-year trajectory also shows it failed to get its profitability back to the peak as its margin fell by 12.8 percentage points. This performance was poor no matter how you look at it - it shows its expenses were rising and it couldn’t pass those costs onto its customers.
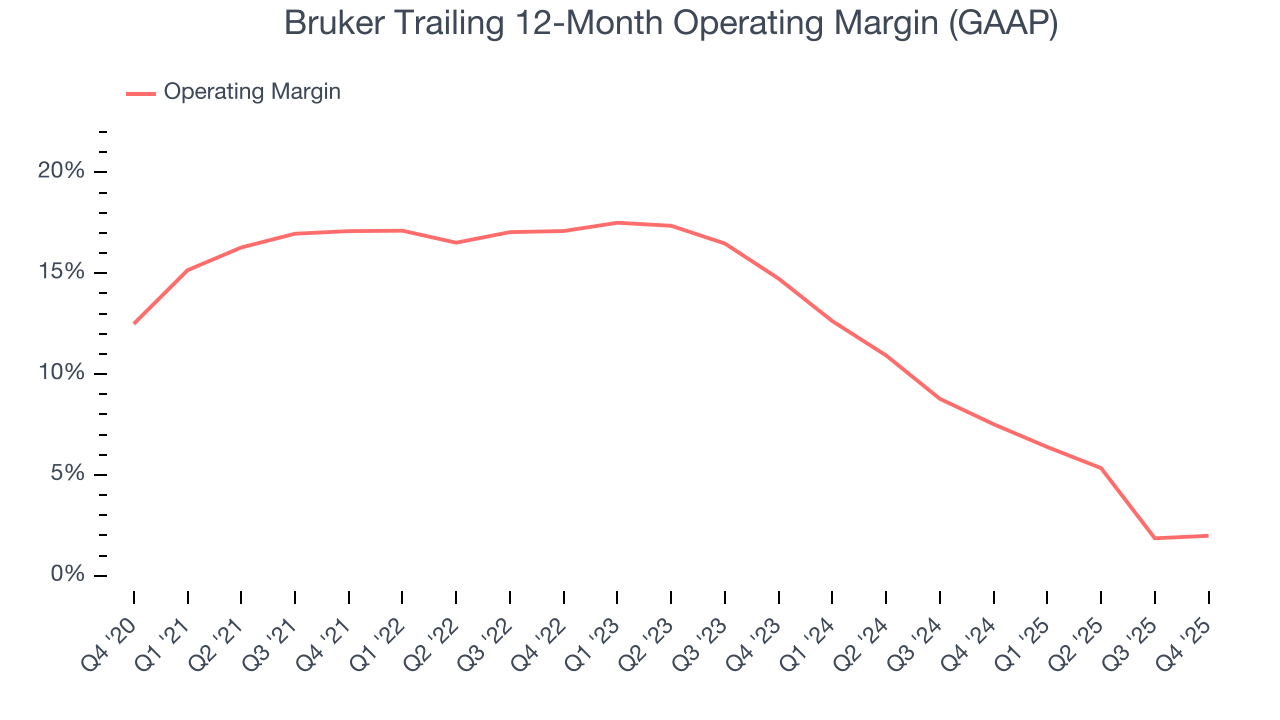
In Q4, Bruker generated an operating margin profit margin of 7.8%, in line with the same quarter last year. This indicates the company’s overall cost structure has been relatively stable.
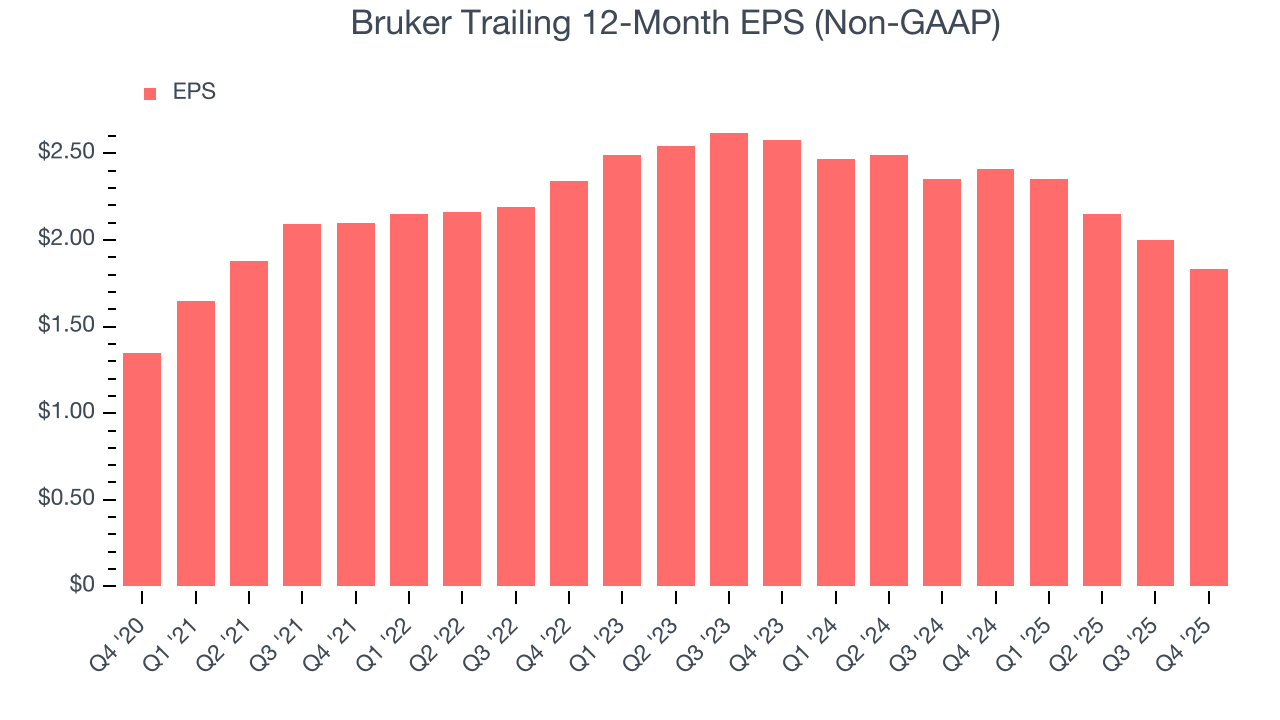
8. Earnings Per Share
Revenue trends explain a company’s historical growth, but the long-term change in earnings per share (EPS) points to the profitability of that growth – for example, a company could inflate its sales through excessive spending on advertising and promotions.
Bruker’s EPS grew at a decent 6.3% compounded annual growth rate over the last five years. However, this performance was lower than its 11.6% annualized revenue growth, telling us the company became less profitable on a per-share basis as it expanded.
We can take a deeper look into Bruker’s earnings quality to better understand the drivers of its performance. As we mentioned earlier, Bruker’s operating margin was flat this quarter but declined by 15.1 percentage points over the last five years. This was the most relevant factor (aside from the revenue impact) behind its lower earnings; interest expenses and taxes can also affect EPS but don’t tell us as much about a company’s fundamentals.
In Q4, Bruker reported adjusted EPS of $0.59, down from $0.76 in the same quarter last year. This print missed analysts’ estimates, but we care more about long-term adjusted EPS growth than short-term movements. Over the next 12 months, Wall Street expects Bruker’s full-year EPS of $1.83 to grow 16.7%.
9. Cash Is King
Although earnings are undoubtedly valuable for assessing company performance, we believe cash is king because you can’t use accounting profits to pay the bills.
Bruker has shown decent cash profitability, giving it some flexibility to reinvest or return capital to investors. The company’s free cash flow margin averaged 5.1% over the last five years, slightly better than the broader healthcare sector.
Taking a step back, we can see that Bruker’s margin dropped by 6.6 percentage points during that time. Continued declines could signal it is in the middle of an investment cycle.
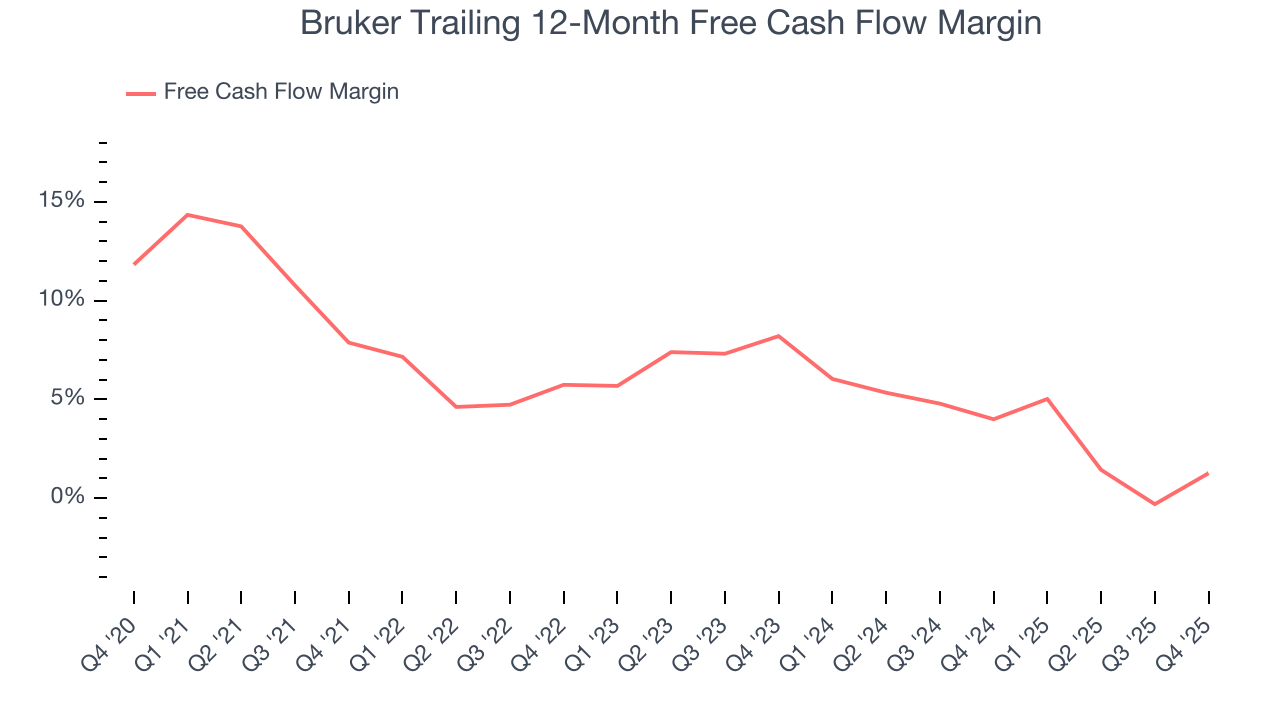
Bruker’s free cash flow clocked in at $207.2 million in Q4, equivalent to a 21.2% margin. This result was good as its margin was 5.6 percentage points higher than in the same quarter last year, but we wouldn’t read too much into the short term because investment needs can be seasonal, causing temporary swings. Long-term trends are more important.
10. Return on Invested Capital (ROIC)
EPS and free cash flow tell us whether a company was profitable while growing its revenue. But was it capital-efficient? Enter ROIC, a metric showing how much operating profit a company generates relative to the money it has raised (debt and equity).
Although Bruker hasn’t been the highest-quality company lately, it historically found a few growth initiatives that worked. Its five-year average ROIC was 13%, higher than most healthcare businesses.
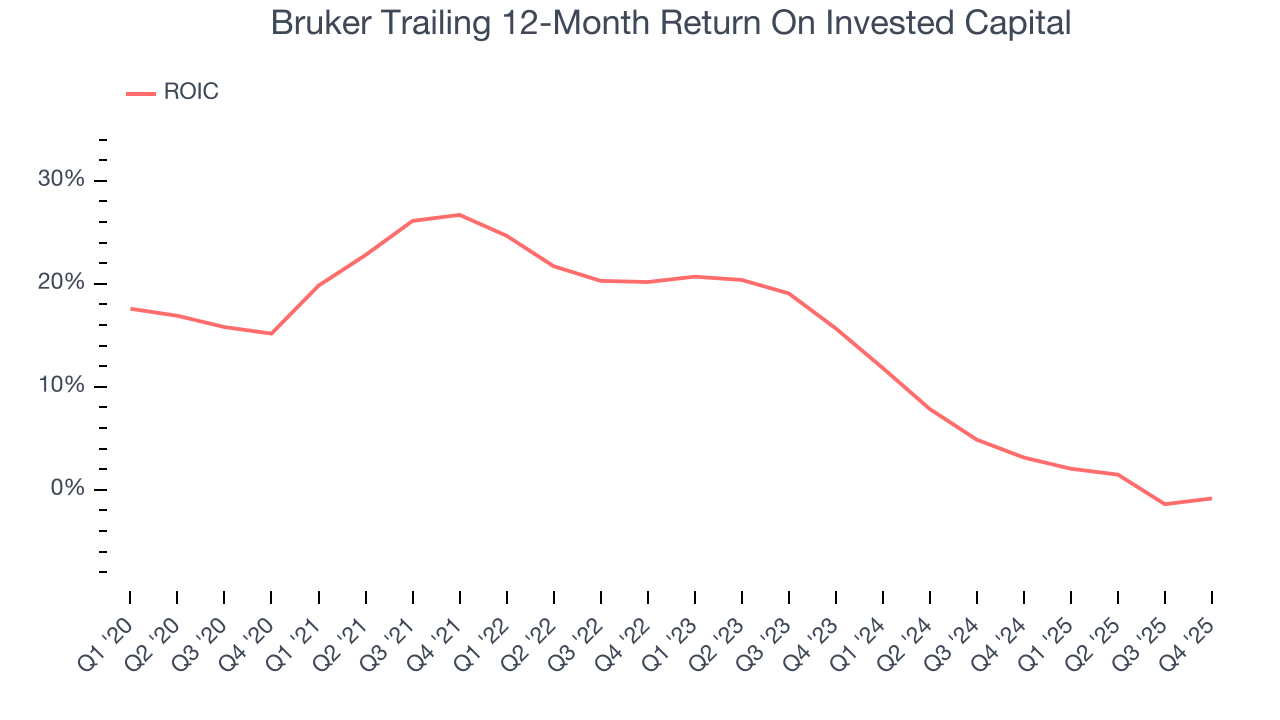
We like to invest in businesses with high returns, but the trend in a company’s ROIC is what often surprises the market and moves the stock price. Unfortunately, Bruker’s ROIC has decreased significantly over the last few years. We like what management has done in the past, but its declining returns are perhaps a symptom of fewer profitable growth opportunities.
11. Balance Sheet Assessment
Bruker reported $298.8 million of cash and $1.87 billion of debt on its balance sheet in the most recent quarter. As investors in high-quality companies, we primarily focus on two things: 1) that a company’s debt level isn’t too high and 2) that its interest payments are not excessively burdening the business.
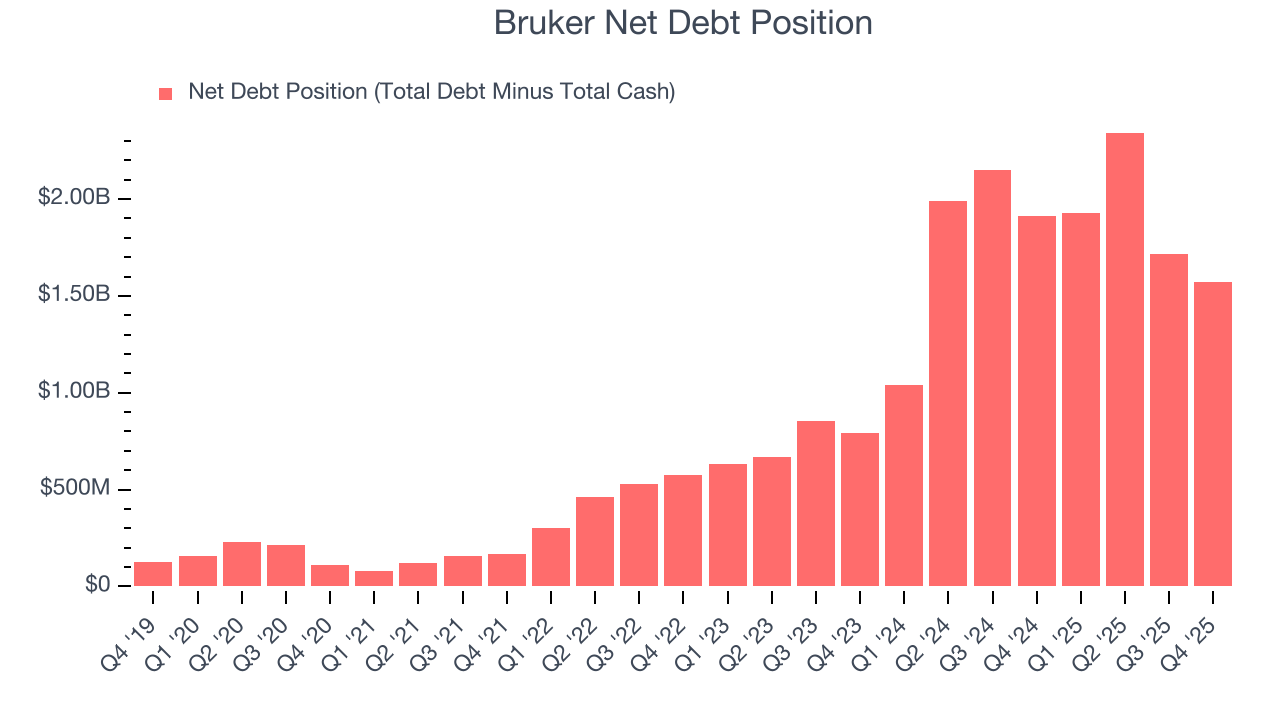
With $487.1 million of EBITDA over the last 12 months, we view Bruker’s 3.2× net-debt-to-EBITDA ratio as safe. We also see its $47 million of annual interest expenses as appropriate. The company’s profits give it plenty of breathing room, allowing it to continue investing in growth initiatives.
12. Key Takeaways from Bruker’s Q4 Results
We were impressed by Bruker’s optimistic full-year revenue guidance, which blew past analysts’ expectations. We were also glad its organic revenue outperformed Wall Street’s estimates. On the other hand, its EPS missed and its full-year EPS guidance fell slightly short of Wall Street’s estimates. Overall, this print was mixed, with guidance likely to weigh on shares. The stock remained flat at $42.38 immediately after reporting.
13. Is Now The Time To Buy Bruker?
Updated: March 12, 2026 at 12:29 AM EDT
A common mistake we notice when investors are deciding whether to buy a stock or not is that they simply look at the latest earnings results. Business quality and valuation matter more, so we urge you to understand these dynamics as well.
Bruker isn’t a terrible business, but it doesn’t pass our bar. Although its revenue growth was good over the last five years, it’s expected to deteriorate over the next 12 months and its diminishing returns show management's prior bets haven't worked out. And while the company’s solid ROIC suggests it has grown profitably in the past, the downside is its declining adjusted operating margin shows the business has become less efficient.
Bruker’s P/E ratio based on the next 12 months is 17.3x. This valuation multiple is fair, but we don’t have much faith in the company. We're pretty confident there are more exciting stocks to buy at the moment.
Wall Street analysts have a consensus one-year price target of $48.43 on the company (compared to the current share price of $36.69).
Although the price target is bullish, readers should exercise caution because analysts tend to be overly optimistic. The firms they work for, often big banks, have relationships with companies that extend into fundraising, M&A advisory, and other rewarding business lines. As a result, they typically hesitate to say bad things for fear they will lose out. We at StockStory do not suffer from such conflicts of interest, so we’ll always tell it like it is.