Carlyle (CG)
We’re not sold on Carlyle. It’s recently struggled to grow its revenue, a worrying sign for investors seeking high-quality stocks.― StockStory Analyst Team
1. News


2. Summary
Why Carlyle Is Not Exciting
Founded in 1987 with just $5 million in capital and named after the iconic New York hotel where the founders first met, The Carlyle Group (NASDAQ:CG) is a global investment firm that raises, manages, and deploys capital across private equity, credit, and investment solutions.
- A silver lining is that its incremental sales over the last five years boosted profitability as its annual earnings per share growth of 14.4% outstripped its revenue performance


Carlyle is skating on thin ice. We’d rather invest in businesses with stronger moats.
Why There Are Better Opportunities Than Carlyle


At $45.83 per share, Carlyle trades at 9.8x forward P/E. This is a cheap valuation multiple, but for good reason. You get what you pay for.
Cheap stocks can look like great bargains at first glance, but you often get what you pay for. These mediocre businesses often have less earnings power, meaning there is more reliance on a re-rating to generate good returns - an unlikely scenario for low-quality companies.
3. Carlyle (CG) Research Report: Q4 CY2025 Update
Private equity firm Carlyle Group (NASDAQ:CG) announced better-than-expected revenue in Q4 CY2025, with sales up 15.1% year on year to $1.09 billion. Its non-GAAP profit of $1.01 per share was 1.7% above analysts’ consensus estimates.
Carlyle (CG) Q4 CY2025 Highlights:
- Assets Under Management: $477 billion vs analyst estimates of $476.4 billion (8.2% year-on-year growth, in line)
- Revenue: $1.09 billion vs analyst estimates of $1.05 billion (15.1% year-on-year growth, 3.7% beat)
- Fee-Related Earnings: $290 million vs analyst estimates of $285.5 million (1.6% beat)
- Adjusted EPS: $1.01 vs analyst estimates of $0.99 (1.7% beat)
- Market Capitalization: $19.97 billion
Company Overview
Founded in 1987 with just $5 million in capital and named after the iconic New York hotel where the founders first met, The Carlyle Group (NASDAQ:CG) is a global investment firm that raises, manages, and deploys capital across private equity, credit, and investment solutions.
Carlyle operates through three business segments that work together to create an integrated platform. Its Corporate Private Equity segment acquires controlling stakes in companies across industries like healthcare, technology, and consumer goods, then works to increase their value through operational improvements, strategic repositioning, and add-on acquisitions. The Global Credit segment provides financing solutions ranging from direct lending to distressed credit opportunities. Its Investment Solutions segment offers investors access to private market strategies through fund-of-funds and co-investment vehicles.
The firm serves a diverse client base that includes pension funds, sovereign wealth funds, financial institutions, and high-net-worth individuals seeking exposure to alternative investments. These clients entrust Carlyle with capital in exchange for investment expertise and access to deals that aren't available in public markets. For example, a state pension fund might allocate hundreds of millions to Carlyle's funds to diversify beyond traditional stocks and bonds while seeking higher returns.
Carlyle generates revenue primarily through management fees (typically 1-2% of committed capital) and performance fees (usually 20% of investment profits above a predetermined threshold). This structure aligns the firm's interests with its investors, as significant portions of Carlyle's earnings depend on successfully growing the value of portfolio companies. With investment professionals across offices spanning six continents, Carlyle leverages its global network to source deals and create value across different economic environments and geographies.
4. Asset Management
Asset management firms oversee investment portfolios for institutions and individuals. The industry benefits from the growing global wealth pool, retirement savings needs, and expansion into alternative investments (private equity, real estate, etc.). However, firms face significant pressure from the shift to lower-cost passive investment products, regulatory requirements for fee transparency, and increasing technology costs to stay competitive in portfolio management and client service.
Carlyle's main competitors include other publicly traded alternative asset managers such as Blackstone (NYSE:BX), KKR (NYSE:KKR), Apollo Global Management (NYSE:APO), and Ares Management (NYSE:ARES), along with other financial institutions that have significant alternative investment divisions.
5. Revenue Growth
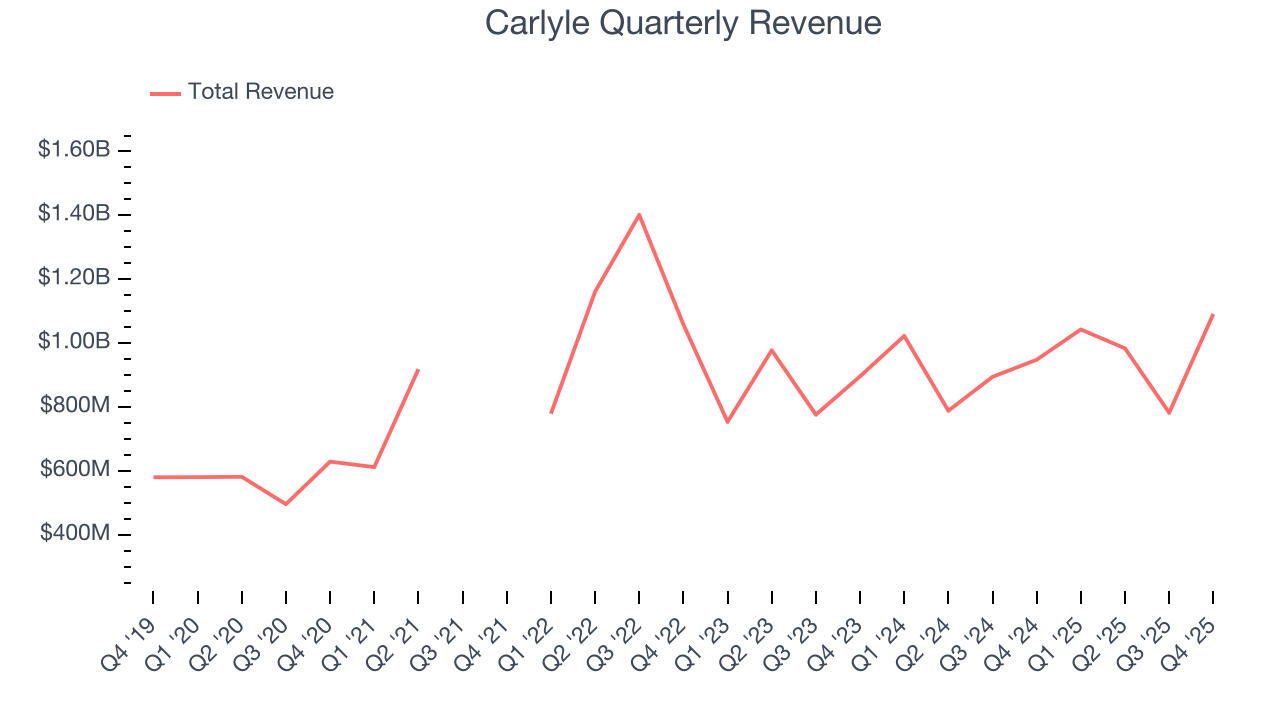
A company’s long-term sales performance is one signal of its overall quality. Any business can put up a good quarter or two, but the best consistently grow over the long haul. Over the last five years, Carlyle grew its revenue at a solid 11.2% compounded annual growth rate. Its growth surpassed the average financials company and shows its offerings resonate with customers, a great starting point for our analysis.
 Note: Quarters not shown were determined to be outliers, impacted by outsized investment gains/losses that are not indicative of the recurring fundamentals of the business.
Long-term growth is the most important, but within financials, a half-decade historical view may miss recent interest rate changes and market returns. Carlyle’s recent performance shows its demand has slowed as its annualized revenue growth of 7% over the last two years was below its five-year trend. 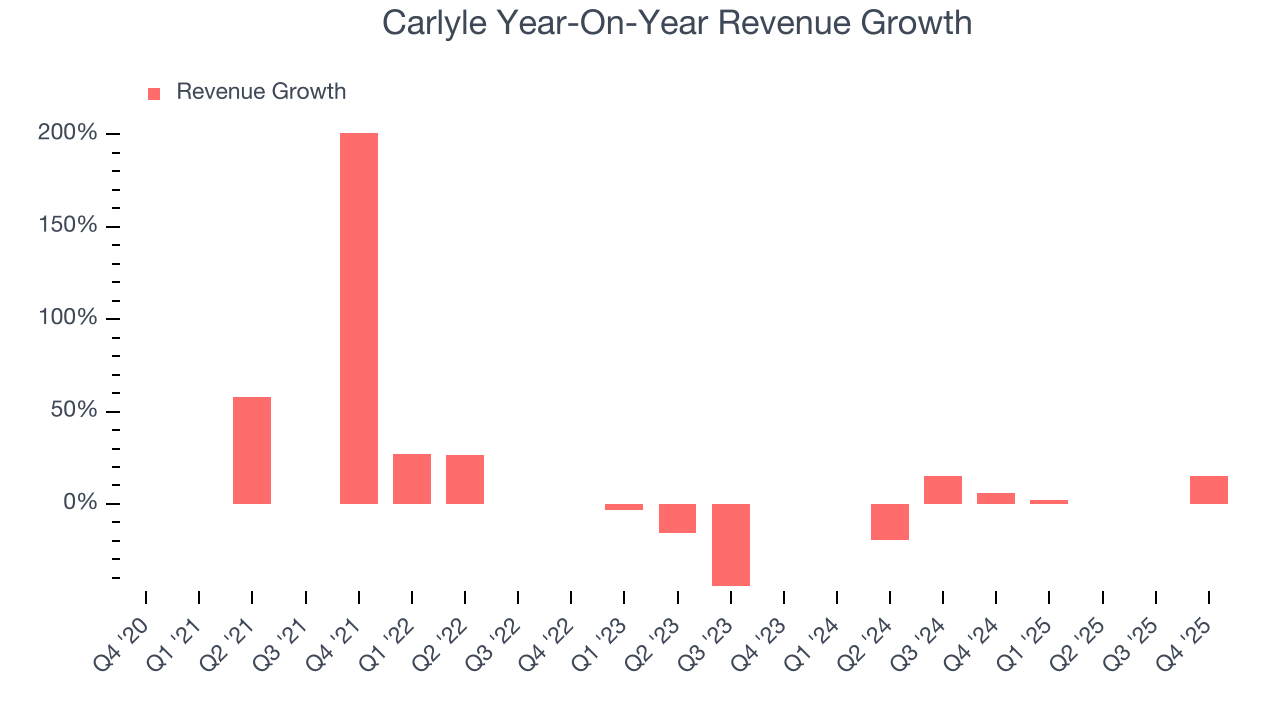 Note: Quarters not shown were determined to be outliers, impacted by outsized investment gains/losses that are not indicative of the recurring fundamentals of the business.
This quarter, Carlyle reported year-on-year revenue growth of 15.1%, and its $1.09 billion of revenue exceeded Wall Street’s estimates by 3.7%.
6. Assets Under Management (AUM)
Assets Under Management (AUM) represents the total value of investments that a financial institution manages for its clients. These assets generate steady income through management fees, creating predictable revenue streams that remain stable so long as clients remain invested with the firm.
Carlyle’s AUM has grown at an annual rate of 15.4% over the last five years, better than the broader financials industry and faster than its total revenue. When analyzing Carlyle’s AUM over the last two years, we can see that growth decelerated to 8.9% annually. Fundraising or short-term investment performance were net contributors for the company over this shorter period since assets grew faster than total revenue. Just remember that while assets are relevant to watch, we don't place too much emphasis on them because they ebb and flow with the market.
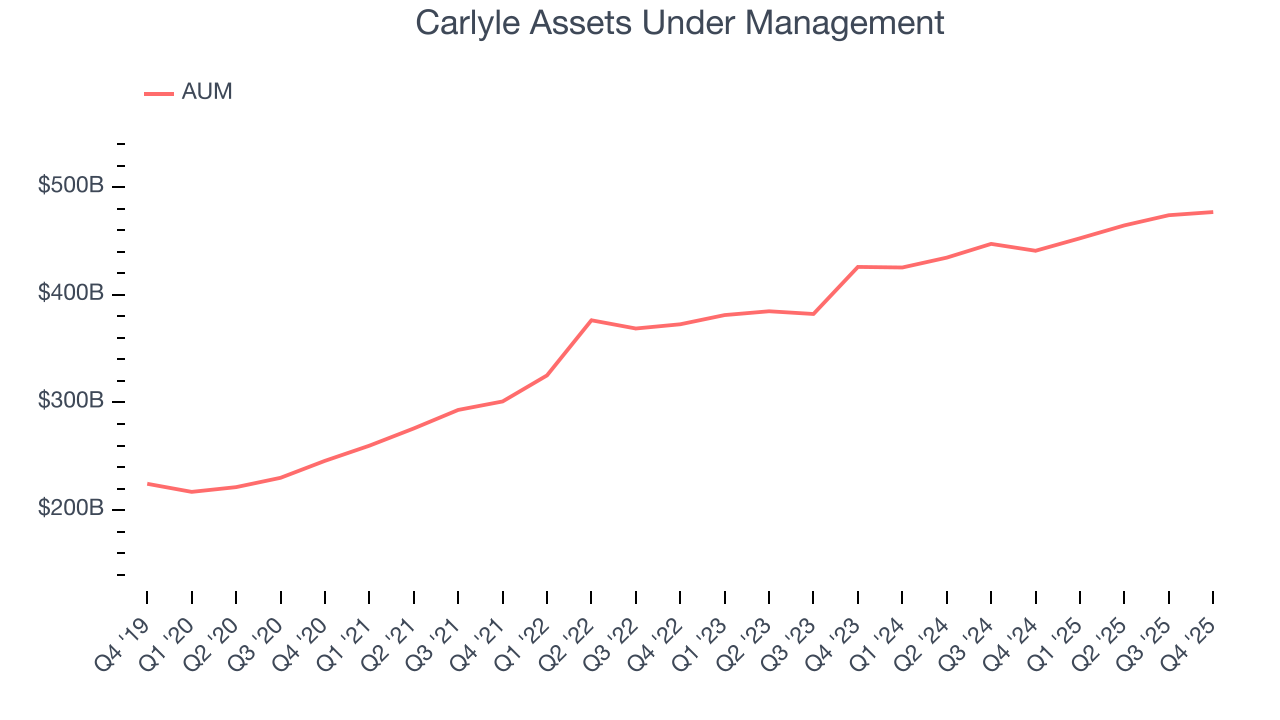
Carlyle’s AUM punched in at $477 billion this quarter, meeting analysts’ expectations. This print was 8.2% higher than the same quarter last year.
7. Adjusted Net Earnings per Share (ANI per Share)
Asset management firms present their profitability through ANI per share, which translates to adjusted net income per share. It’s fundamentally identical to the adjusted EPS metrics investors see from other industries.
By excluding unrealized investment movements and non-recurring costs, ANI per share reveals the underlying profitability of the business. The per-share adjustment is crucial because it shows how earnings translate to individual shareholder ownership after accounting for share count changes.
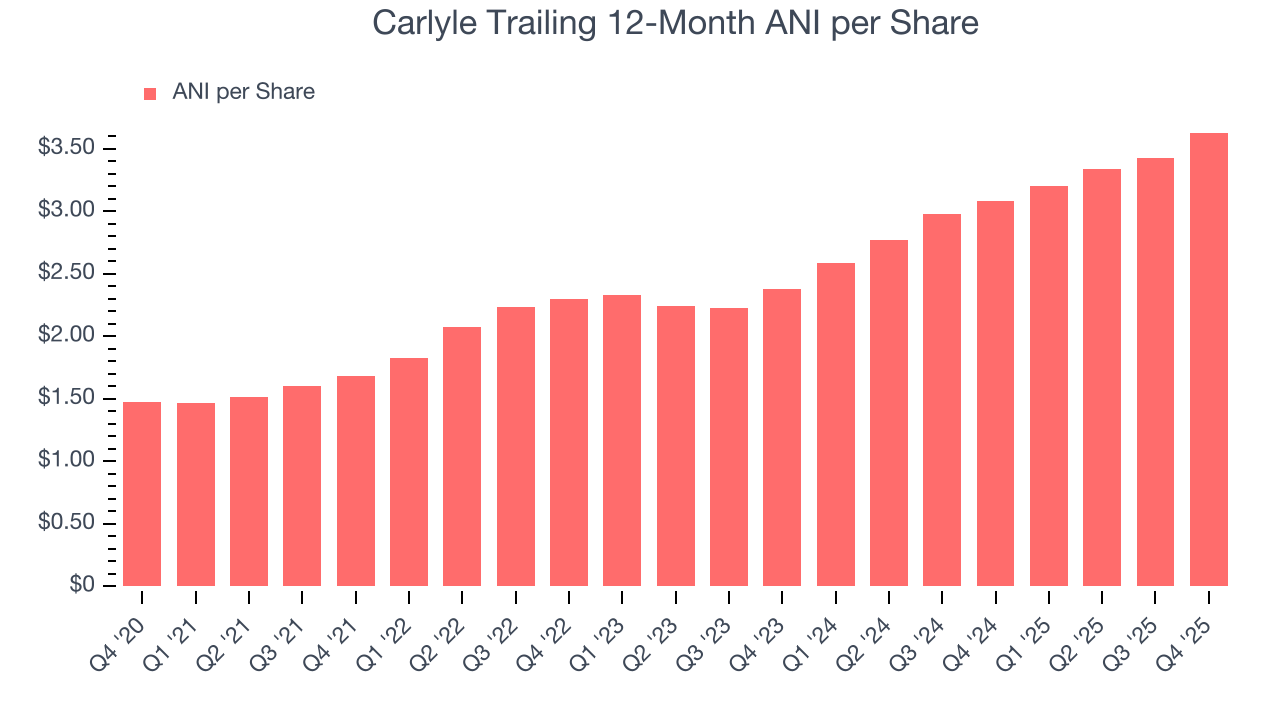
Carlyle’s 19.7% annualized ANI per share growth over the past five years was remarkable and outperformed its 18.9% annual fee-related earnings growth. This dynamic occured despite a general increase in its shares outstanding, meaning other non-core line items such as realized investment income and taxes offset the dilution. 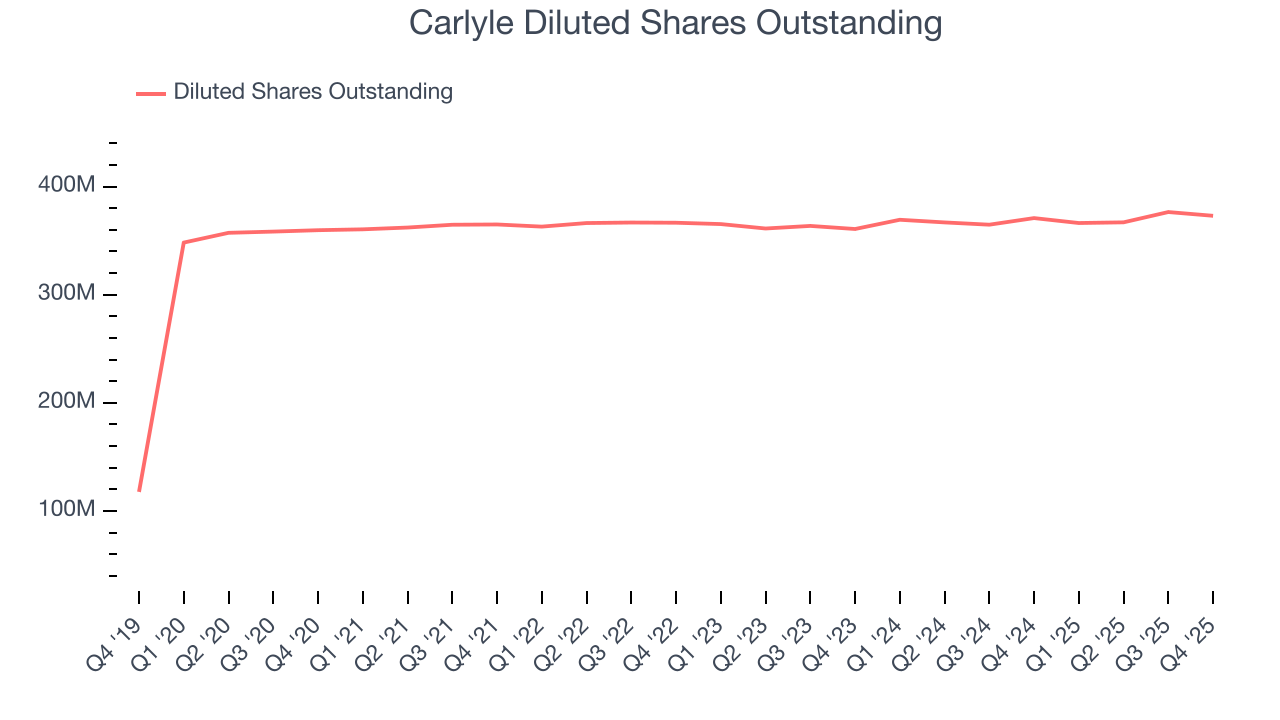
On a two-year basis, Carlyle’s annualized ANI per share growth accelerated to 23.6%. This performance was great and better than its fee-related earnings over the same period. We note the company continued diluting shareholders during this timeframe, suppressing its ANI per share.
In Q4, Carlyle reported ANI per share of $1.01, up from $0.80 in the same quarter last year. This print beat analysts’ estimates by 1.7%.
8. A Word on Book Value and ROE
You may wonder when we will analyze book value and return on equity (ROE) since Carlyle is a financials company. We pay less attention to these metrics for asset managers because they are not great measures of business quality.
Asset managers are fee-based, capital light firms that manage client capital rather than their own, so they are not balance sheet businesses. Additionally, book value fails to capture the value of brands, investment track records, and other intangibles, thus understating intrinsic value, while ROE can look artificially high due to the relatively smaller bases of equity capital needed to operate the business compared to banks and insurers.
9. Balance Sheet Assessment
Carlyle reported $3.21 billion of cash and $3.94 billion of debt on its balance sheet in the most recent quarter.
As investors in high-quality companies, we primarily focus on whether a company’s profits can support its debt.
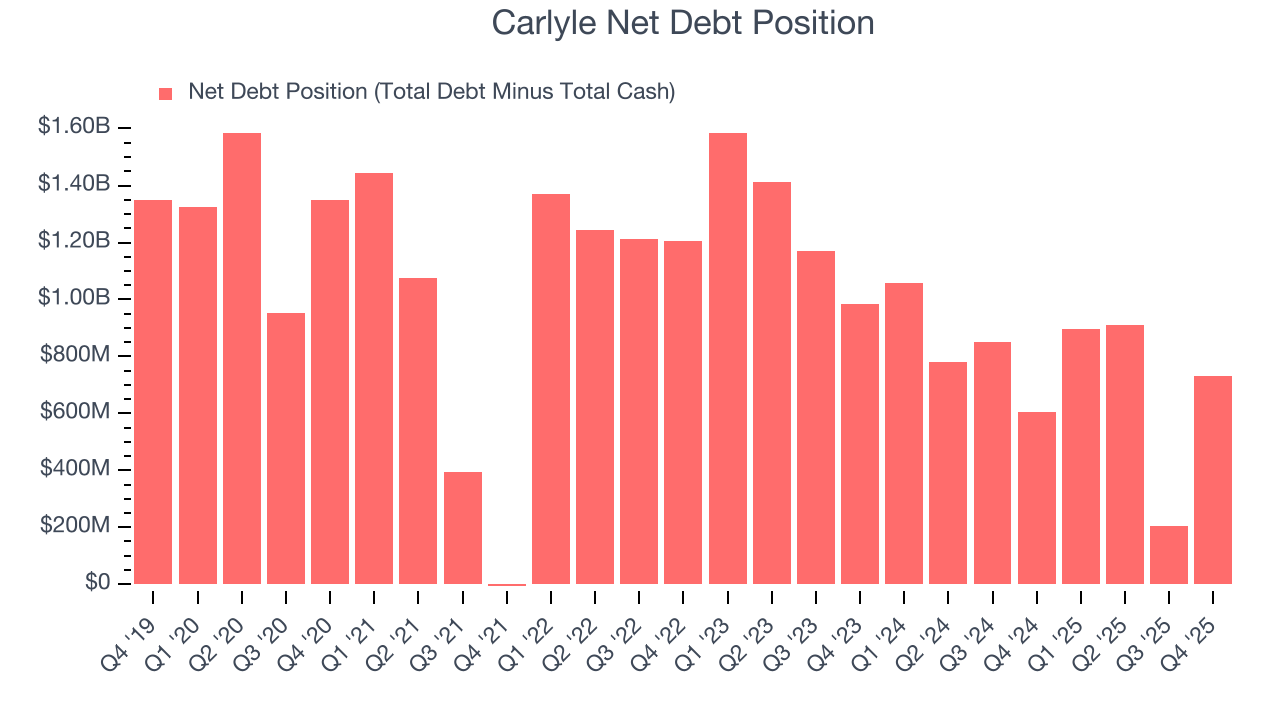
With $1.23 billion of fee-related earnings over the last 12 months, we view Carlyle’s 0.6× net-debt-to-earnings ratio as safe. The company’s profits give it plenty of breathing room, allowing it to continue investing in growth initiatives.
10. Key Takeaways from Carlyle’s Q4 Results
It was encouraging to see Carlyle beat analysts’ revenue expectations this quarter. We were also happy its fee-related earnings outperformed Wall Street’s estimates. Overall, this print had some key positives. The stock traded up 1.5% to $56.25 immediately after reporting.
11. Is Now The Time To Buy Carlyle?
Updated: March 16, 2026 at 12:32 AM EDT
Before deciding whether to buy Carlyle or pass, we urge investors to consider business quality, valuation, and the latest quarterly results.
Carlyle has some positive attributes, but it isn’t one of our picks. First off, its revenue growth was solid over the last five years and is expected to accelerate over the next 12 months. On top of that, Carlyle’s AUM growth was impressive over the last five years, and its solid EPS growth over the last five years shows its profits are trickling down to shareholders.
Carlyle’s P/E ratio based on the next 12 months is 9.8x. This valuation is reasonable, but the company’s shakier fundamentals present too much downside risk. We're fairly confident there are better investments elsewhere.
Wall Street analysts have a consensus one-year price target of $67.56 on the company (compared to the current share price of $45.83).