
CME Group (CME)
We’re skeptical of CME Group. Its sluggish sales growth shows demand is soft, a worrisome sign for investors in high-quality stocks.― StockStory Analyst Team
1. News


2. Summary
Why CME Group Is Not Exciting
Born from the Chicago Mercantile Exchange founded in 1898 as a butter and egg trading venue, CME Group (NASDAQ:CME) operates the world's largest derivatives marketplace where traders can buy and sell futures and options contracts across interest rates, equities, currencies, commodities, and more.
- Sales trends were unexciting over the last five years as its 6% annual growth was below the typical financials company
- A positive is that its management team has demonstrated it can invest in profitable ventures through its 11.8% five-year return on equity


CME Group doesn’t meet our quality criteria. There are superior opportunities elsewhere.
Why There Are Better Opportunities Than CME Group


At $309.65 per share, CME Group trades at 25.9x forward P/E. This multiple is higher than most financials companies, and we think it’s quite expensive for the weaker revenue growth you get.
There are stocks out there similarly priced with better business quality. We prefer owning these.
3. CME Group (CME) Research Report: Q4 CY2025 Update
Financial derivatives exchange CME Group (NASDAQ:CME) met Wall Streets revenue expectations in Q4 CY2025, with sales up 8.1% year on year to $1.65 billion. Its non-GAAP profit of $2.77 per share was 1% above analysts’ consensus estimates.
CME Group (CME) Q4 CY2025 Highlights:
- Revenue: $1.65 billion vs analyst estimates of $1.64 billion (8.1% year-on-year growth, in line)
- Pre-tax Profit: $1.58 billion (95.7% margin)
- Adjusted EPS: $2.77 vs analyst estimates of $2.74 (1% beat)
- Market Capitalization: $105.7 billion
Company Overview
Born from the Chicago Mercantile Exchange founded in 1898 as a butter and egg trading venue, CME Group (NASDAQ:CME) operates the world's largest derivatives marketplace where traders can buy and sell futures and options contracts across interest rates, equities, currencies, commodities, and more.
CME Group's exchanges—including the Chicago Mercantile Exchange, Chicago Board of Trade, New York Mercantile Exchange, and COMEX—provide a venue for market participants to trade standardized contracts with predetermined specifications. These contracts span six major asset classes: interest rates, equity indexes, foreign exchange, agricultural commodities, energy products, and metals. For example, a wheat farmer might use CME's futures contracts to lock in prices months before harvest, while an institutional investor could trade S&P 500 futures to manage portfolio risk.
At the heart of CME's business model is its clearing house, which acts as the counterparty to every trade. This eliminates counterparty risk by guaranteeing that all contracts will be honored, even if one party defaults. The clearing house marks positions to market at least twice daily, collecting and distributing funds between parties based on price movements, ensuring market integrity.
Beyond its core derivatives business, CME Group operates cash markets through BrokerTec and EBS platforms. BrokerTec facilitates trading in fixed income products like U.S. Treasuries and repurchase agreements, while EBS specializes in spot foreign exchange and precious metals trading. These platforms serve banks and professional trading firms seeking liquidity in these markets.
CME also monetizes its market data, offering real-time and historical pricing information, analytics tools, and benchmark indices like CME Term SOFR. The company has embraced technology through its CME Globex electronic trading platform, which operates nearly 24 hours a day and handles the vast majority of the company's trading volume.
4. Financial Exchanges & Data
Financial exchanges and data providers operate trading platforms and sell market information. They enjoy relatively stable revenue from trading fees and subscriptions, increasing demand for data analytics, and expansion opportunities in emerging markets. Challenges include regulatory oversight of market structure, competition from alternative trading venues, and substantial technology investments needed to maintain low-latency trading infrastructure and data security.
CME Group's primary competitors include Intercontinental Exchange (NYSE:ICE), which owns the New York Stock Exchange and numerous derivatives exchanges, Deutsche Börse (ETR:DB1), which operates Eurex, and Nasdaq (NASDAQ:NDAQ). In specific market segments, CME also competes with Hong Kong Exchanges and Clearing (HKEX), London Stock Exchange Group (LON:LSEG), and Cboe Global Markets (BATS:CBOE).
5. Revenue Growth
Reviewing a company’s long-term sales performance reveals insights into its quality. Even a bad business can shine for one or two quarters, but a top-tier one grows for years. Regrettably, CME Group’s revenue grew at a tepid 6% compounded annual growth rate over the last five years. This fell short of our benchmark for the financials sector and is a tough starting point for our analysis.
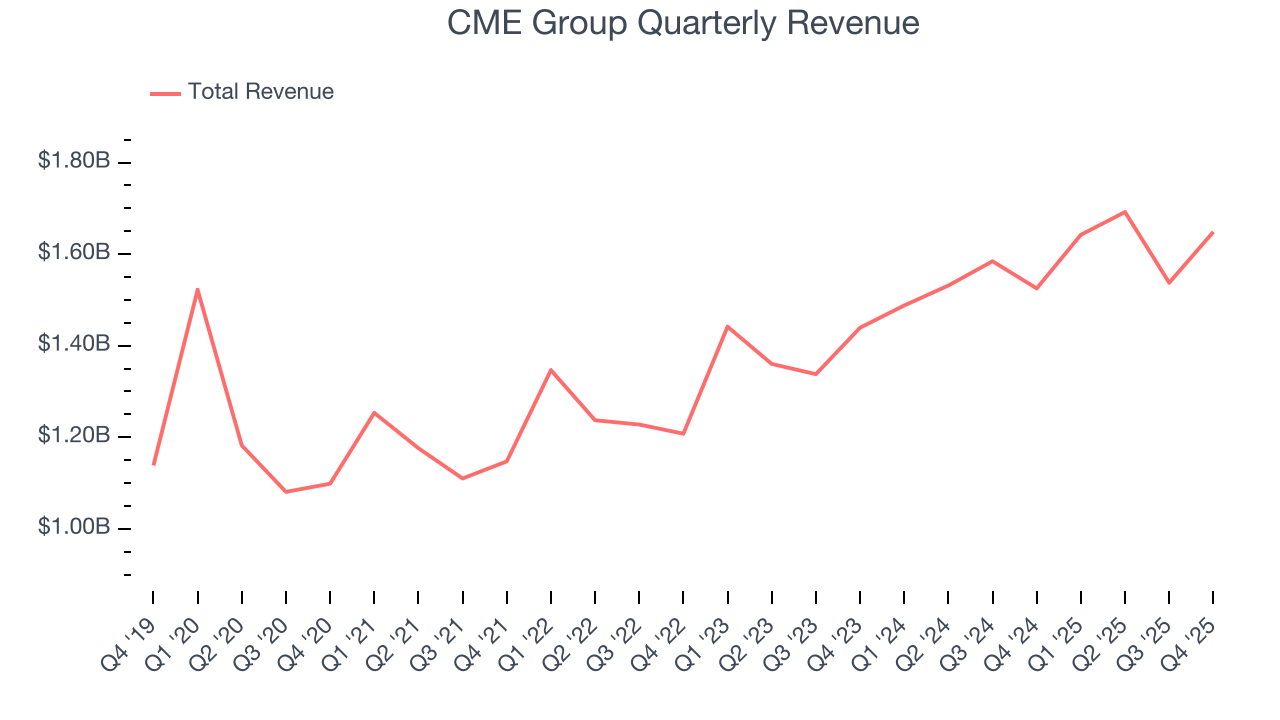
We at StockStory place the most emphasis on long-term growth, but within financials, a half-decade historical view may miss recent interest rate changes, market returns, and industry trends. CME Group’s annualized revenue growth of 8.1% over the last two years is above its five-year trend, suggesting some bright spots. 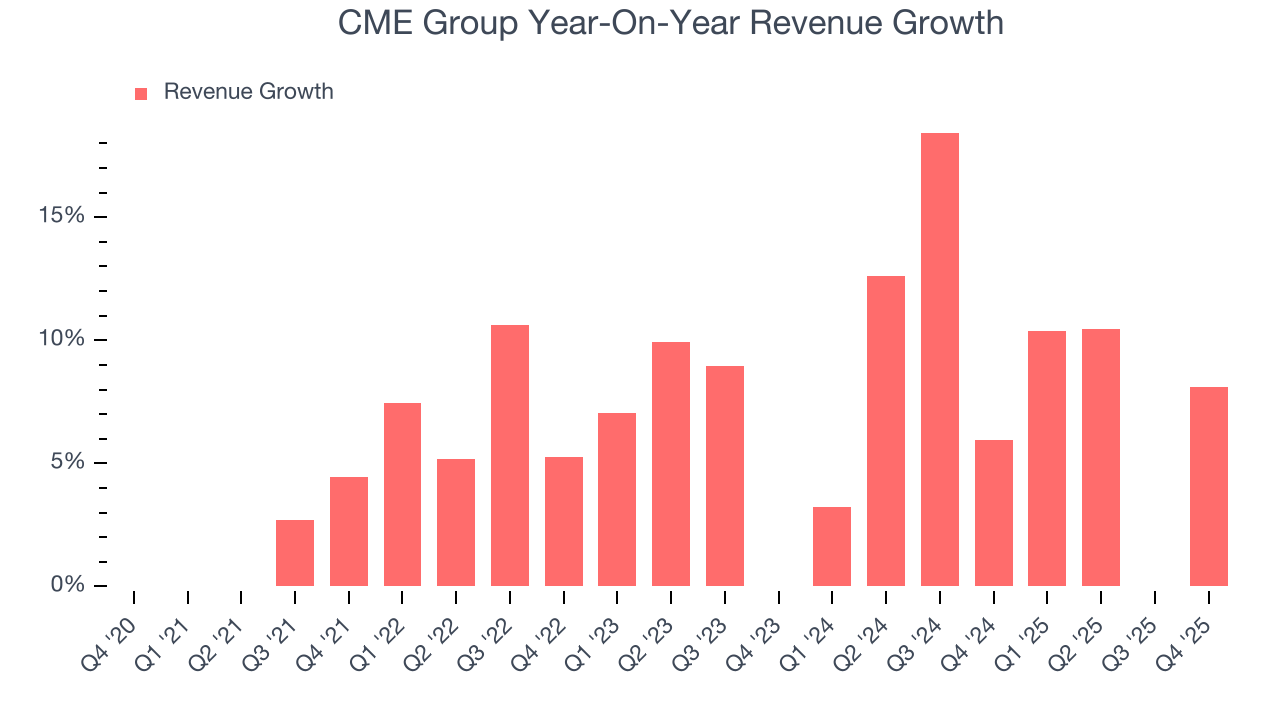 Note: Quarters not shown were determined to be outliers, impacted by outsized investment gains/losses that are not indicative of the recurring fundamentals of the business.
This quarter, CME Group grew its revenue by 8.1% year on year, and its $1.65 billion of revenue was in line with Wall Street’s estimates.
6. Pre-Tax Profit Margin
Revenue growth is one major determinant of business quality, and the efficiency of operations is another. For Financial Exchanges & Data companies, we look at pre-tax profit rather than the operating margin that defines sectors such as consumer, tech, and industrials.
Interest income and expenses play a big role in financial institutions' profitability, so they should be factored into the definition of profit. Taxes, however, should not as they are largely out of a company's control. This is pre-tax profit by definition.
Over the last five years, CME Group’s pre-tax profit margin has fallen by 26 percentage points, going from 72% to 81.7%. It has also expanded by 7.3 percentage points on a two-year basis, showing its expenses have consistently grown at a slower rate than revenue. This typically signals prudent management.
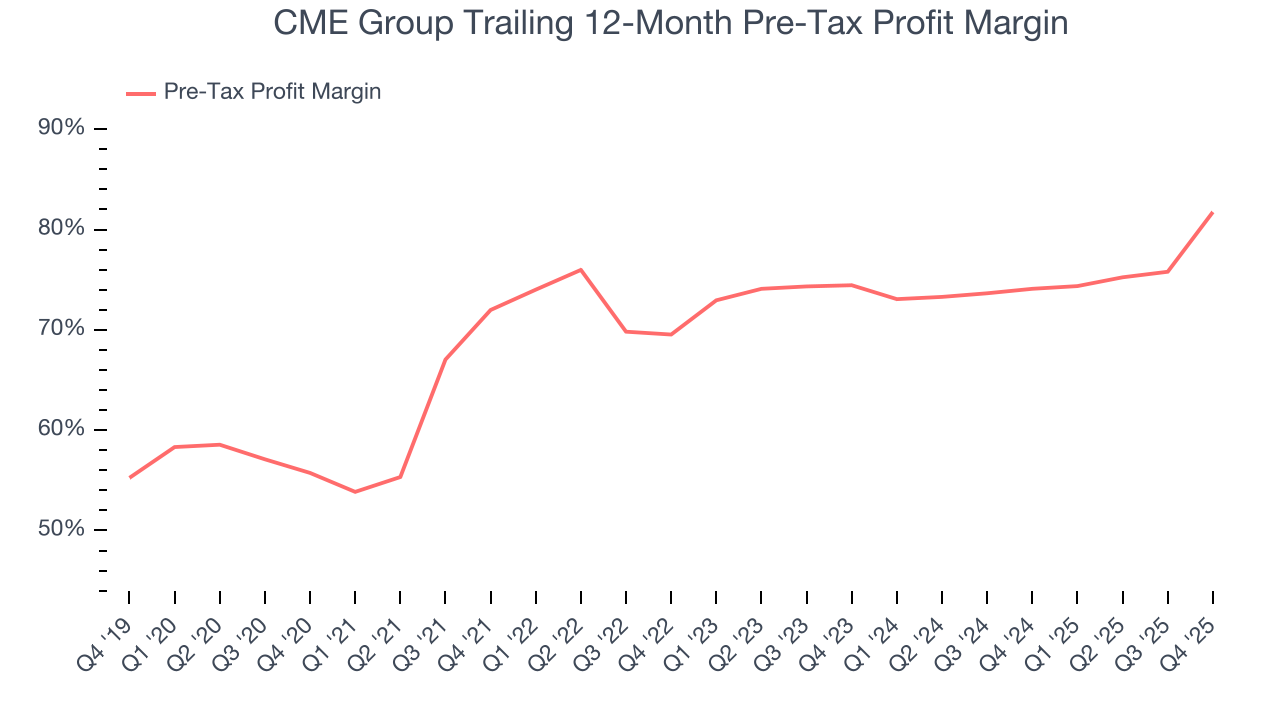
CME Group’s pre-tax profit margin came in at 95.7% this quarter. This result was 23.8 percentage points better than the same quarter last year.
7. Earnings Per Share
Revenue trends explain a company’s historical growth, but the long-term change in earnings per share (EPS) points to the profitability of that growth – for example, a company could inflate its sales through excessive spending on advertising and promotions.
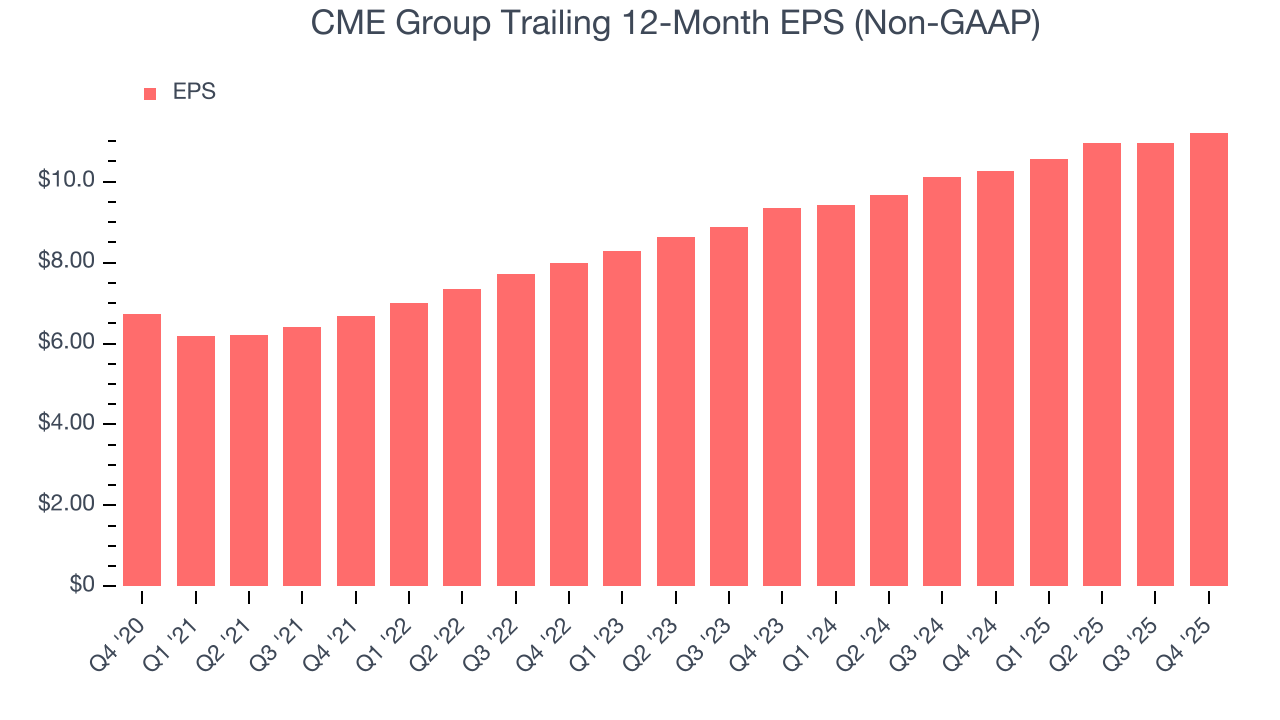
CME Group’s EPS grew at a decent 10.7% compounded annual growth rate over the last five years, higher than its 6% annualized revenue growth. This tells us the company became more profitable on a per-share basis as it expanded.
Like with revenue, we analyze EPS over a more recent period because it can provide insight into an emerging theme or development for the business.
For CME Group, its two-year annual EPS growth of 9.6% was lower than its five-year trend. We hope its growth can accelerate in the future.
In Q4, CME Group reported adjusted EPS of $2.77, up from $2.52 in the same quarter last year. This print was close to analysts’ estimates. Over the next 12 months, Wall Street expects CME Group’s full-year EPS of $11.21 to grow 4.5%.
8. Return on Equity
Return on equity (ROE) reveals the profit generated per dollar of shareholder equity, which represents a key source of bank funding. Banks maintaining elevated ROE levels tend to accelerate wealth creation for shareholders via earnings retention, buybacks, and distributions.
Over the last five years, CME Group has averaged an ROE of 11.5%, respectable for a company operating in a sector where the average shakes out around 10% and those putting up 25%+ are greatly admired.
9. Balance Sheet Assessment
The debt-to-equity ratio is a widely used measure to assess a company's balance sheet health. A higher ratio means that a business aggressively financed its growth with debt. This can result in higher earnings (if the borrowed funds are invested profitably) but also increases risk.
If debt levels are too high, there could be difficulties in meeting obligations, especially during economic downturns or periods of rising interest rates if the debt has variable-rate payments.
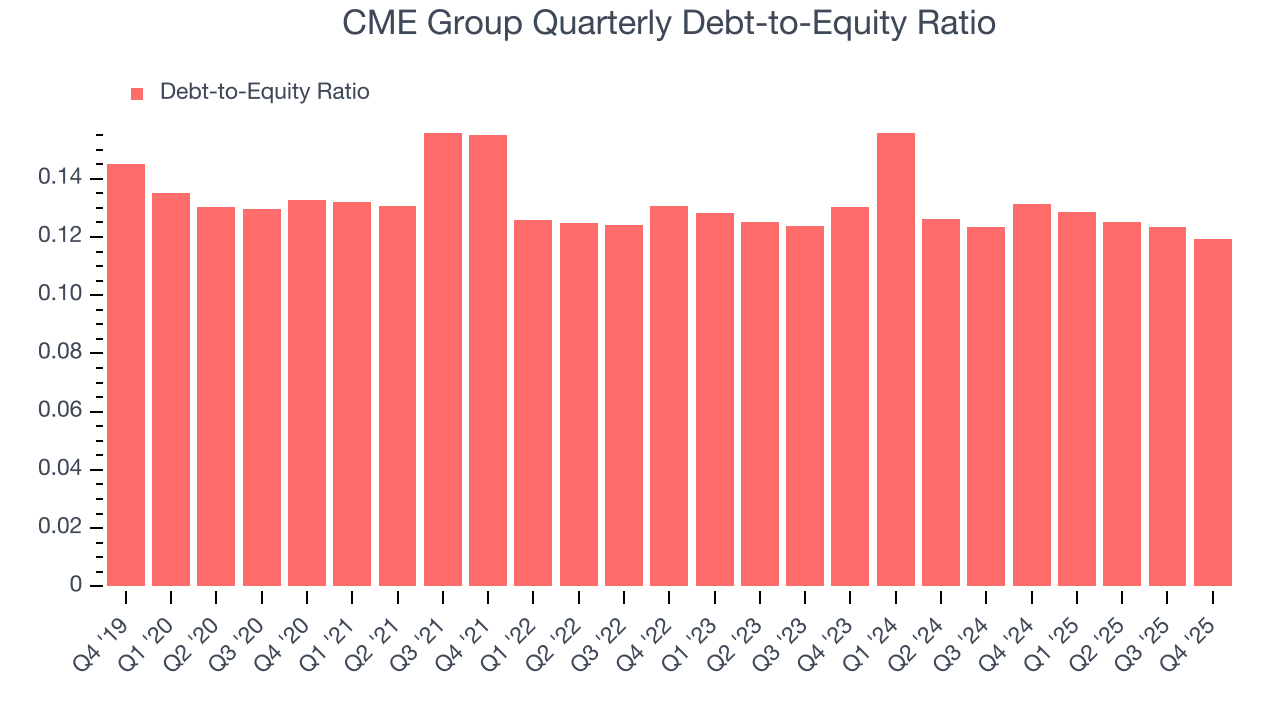
CME Group currently has $3.42 billion of debt and $28.73 billion of shareholder's equity on its balance sheet, and over the past four quarters, has averaged a debt-to-equity ratio of 0.1×. We think this is safe and raises no red flags. In general, we’re comfortable with any ratio below 3.5× for a financials business.
10. Key Takeaways from CME Group’s Q4 Results
This was a quarter without many surprises, good or bad. Revenue was in line and EPS beat by 1%. The stock remained flat at $293.04 immediately following the results.
11. Is Now The Time To Buy CME Group?
Updated: March 24, 2026 at 12:16 AM EDT
Before investing in or passing on CME Group, we urge you to understand the company’s business quality (or lack thereof), valuation, and the latest quarterly results - in that order.
CME Group isn’t a terrible business, but it doesn’t pass our quality test. First off, its revenue growth was uninspiring over the last five years.
CME Group’s P/E ratio based on the next 12 months is 25.6x. This multiple tells us a lot of good news is priced in - you can find more timely opportunities elsewhere.
Wall Street analysts have a consensus one-year price target of $306.86 on the company (compared to the current share price of $307.42).