
CVB Financial (CVBF)
CVB Financial is up against the odds. Its revenue growth has been weak and its profitability has caved, showing it’s struggling to adapt.― StockStory Analyst Team
1. News


2. Summary
Why We Think CVB Financial Will Underperform
With roots dating back to 1974 and a focus on serving small and medium-sized businesses, CVB Financial (NASDAQ:CVBF) operates Citizens Business Bank, providing banking, lending, and trust services to businesses and individuals across California.
- Customers postponed purchases of its products and services this cycle as its revenue declined by 2% annually over the last two years
- Earnings per share have contracted by 2.7% annually over the last two years, a headwind for returns as stock prices often echo long-term EPS performance
- Annual net interest income growth of 2% over the last five years was below our standards for the banking sector


CVB Financial doesn’t fulfill our quality requirements. Better stocks can be found in the market.
Why There Are Better Opportunities Than CVB Financial


CVB Financial is trading at $19 per share, or 1x forward P/B. CVB Financial’s valuation may seem like a bargain, especially when stacked up against other banking companies. We remind you that you often get what you pay for, though.
Cheap stocks can look like a great deal at first glance, but they can be value traps. They often have less earnings power, meaning there is more reliance on a re-rating to generate good returns - an unlikely scenario for low-quality companies.
3. CVB Financial (CVBF) Research Report: Q4 CY2025 Update
Regional bank holding company CVB Financial (NASDAQ:CVBF) announced better-than-expected revenue in Q4 CY2025, with sales up 10.1% year on year to $136.5 million. Its non-GAAP profit of $0.41 per share was 2.5% above analysts’ consensus estimates.
CVB Financial (CVBF) Q4 CY2025 Highlights:
- Net Interest Income: $122.7 million vs analyst estimates of $120.2 million (11.1% year-on-year growth, 2% beat)
- Net Interest Margin: 3.5% vs analyst estimates of 3.4% (7.3 basis point beat)
- Revenue: $136.5 million vs analyst estimates of $135.4 million (10.1% year-on-year growth, 0.8% beat)
- Efficiency Ratio: 46.3% vs analyst estimates of 43.6% (273 basis point miss)
- Adjusted EPS: $0.41 vs analyst estimates of $0.40 (2.5% beat)
- Tangible Book Value per Share: $11.24 vs analyst estimates of $11.19 (11.3% year-on-year growth, in line)
- Market Capitalization: $2.81 billion
Company Overview
With roots dating back to 1974 and a focus on serving small and medium-sized businesses, CVB Financial (NASDAQ:CVBF) operates Citizens Business Bank, providing banking, lending, and trust services to businesses and individuals across California.
Citizens Business Bank operates through a network of banking centers primarily in California, offering a comprehensive suite of financial products. The bank's deposit services include business and personal checking accounts, savings accounts, money market accounts, and certificates of deposit, as well as specialized deposit products for title and escrow companies and municipalities.
On the lending side, Citizens Business Bank provides commercial loans, real estate financing, construction loans, agribusiness lending, and consumer loans. For business clients, the bank offers lines of credit, accounts receivable lending, and equipment leasing. A dairy farmer might use an agribusiness loan to purchase additional cattle or upgrade milking equipment, while a manufacturing company could secure a commercial real estate loan to expand its facilities.
The bank generates revenue through interest income on loans and investments, as well as fees from various services. Beyond traditional banking, Citizens Business Bank offers specialized business services including treasury management systems, merchant card processing, payroll services, and remote deposit capture. Through its CitizensTrust division, the bank provides wealth management services such as fiduciary services, retirement planning, and investment management.
As a federally regulated financial institution, CVB Financial operates under the supervision of the Federal Reserve, while Citizens Business Bank is regulated by the California Department of Financial Protection and Innovation and the Federal Deposit Insurance Corporation (FDIC), which insures customer deposits up to applicable limits.
4. Regional Banks
Regional banks, financial institutions operating within specific geographic areas, serve as intermediaries between local depositors and borrowers. They benefit from rising interest rates that improve net interest margins (the difference between loan yields and deposit costs), digital transformation reducing operational expenses, and local economic growth driving loan demand. However, these banks face headwinds from fintech competition, deposit outflows to higher-yielding alternatives, credit deterioration (increasing loan defaults) during economic slowdowns, and regulatory compliance costs. Recent concerns about regional bank stability following high-profile failures and significant commercial real estate exposure present additional challenges.
CVB Financial competes with other regional banks in California such as Pacific Premier Bancorp (NASDAQ:PPBI), Bank of Marin Bancorp (NASDAQ:BMRC), and larger institutions like Bank of America (NYSE:BAC) and Wells Fargo (NYSE:WFC) that operate in its markets.
5. Sales Growth
Two primary revenue streams drive bank earnings. While net interest income, which is earned by charging higher rates on loans than paid on deposits, forms the foundation, fee-based services across banking, credit, wealth management, and trading operations provide additional income. Regrettably, CVB Financial’s revenue grew at a sluggish 2.3% compounded annual growth rate over the last five years. This was below our standards and is a poor baseline for our analysis.
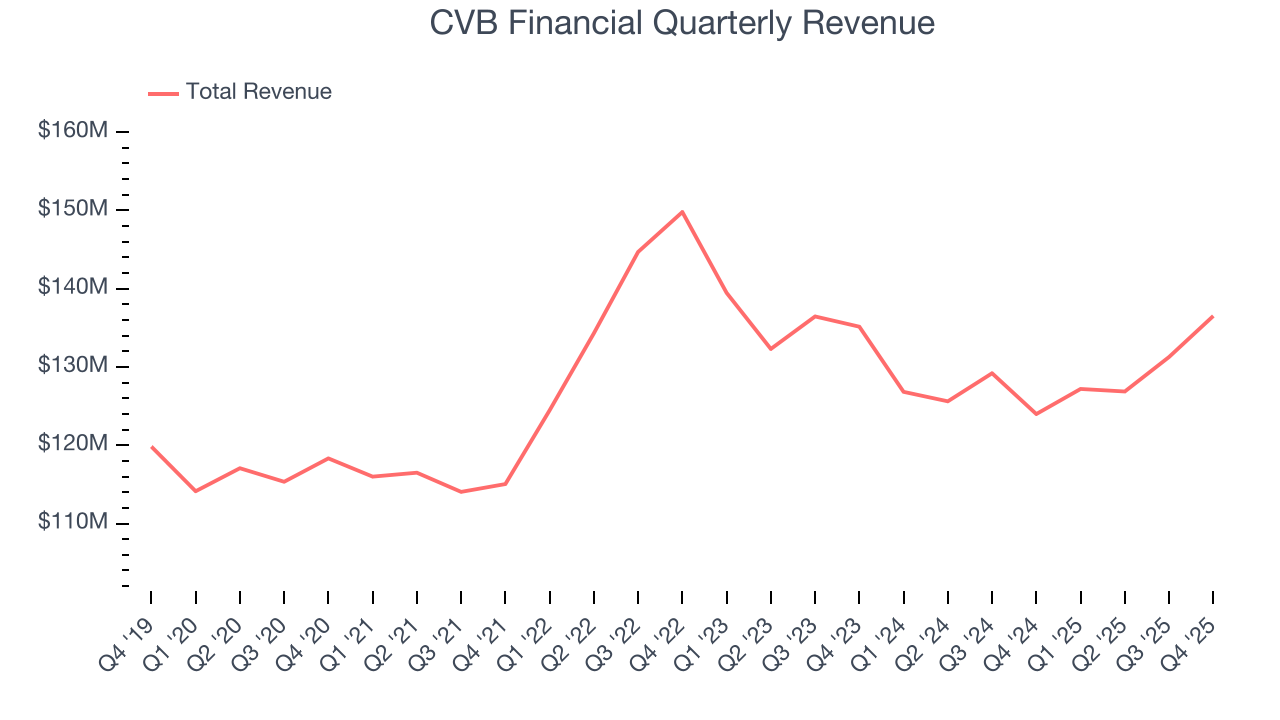
We at StockStory place the most emphasis on long-term growth, but within financials, a half-decade historical view may miss recent interest rate changes, market returns, and industry trends. CVB Financial’s performance shows it grew in the past but relinquished its gains over the last two years, as its revenue fell by 2% annually. 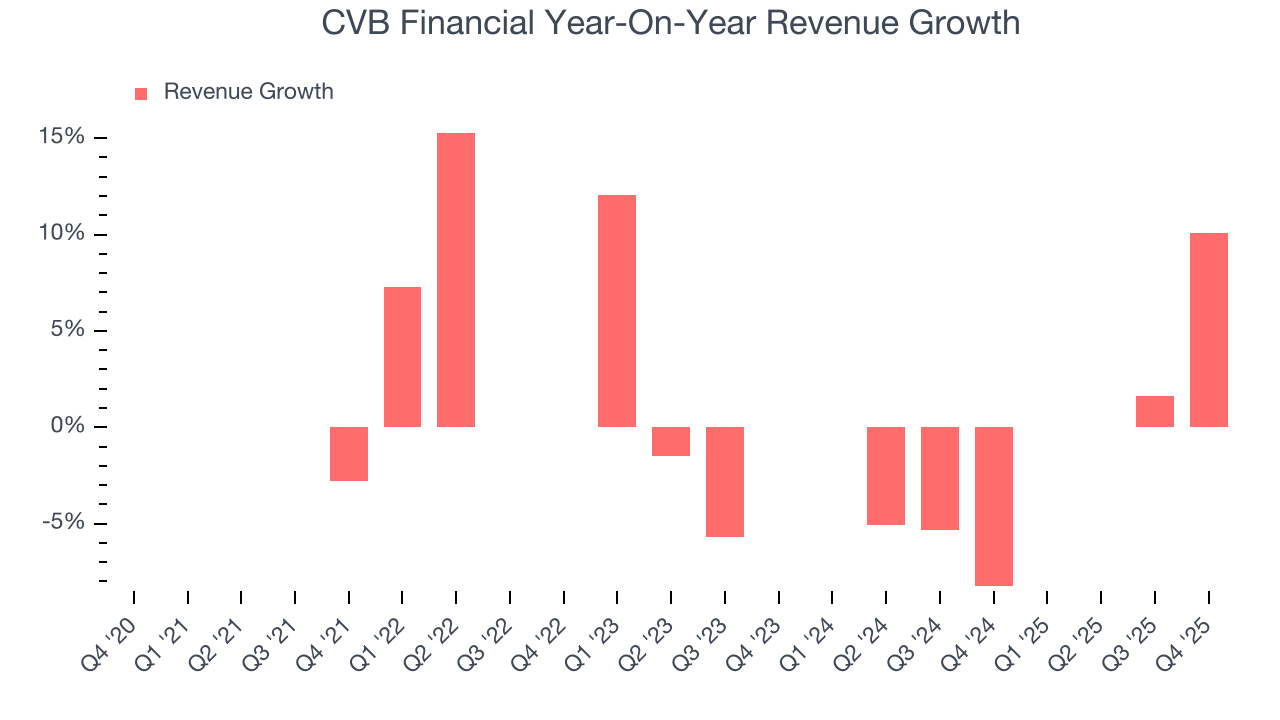 Note: Quarters not shown were determined to be outliers, impacted by outsized investment gains/losses that are not indicative of the recurring fundamentals of the business.
This quarter, CVB Financial reported year-on-year revenue growth of 10.1%, and its $136.5 million of revenue exceeded Wall Street’s estimates by 0.8%.
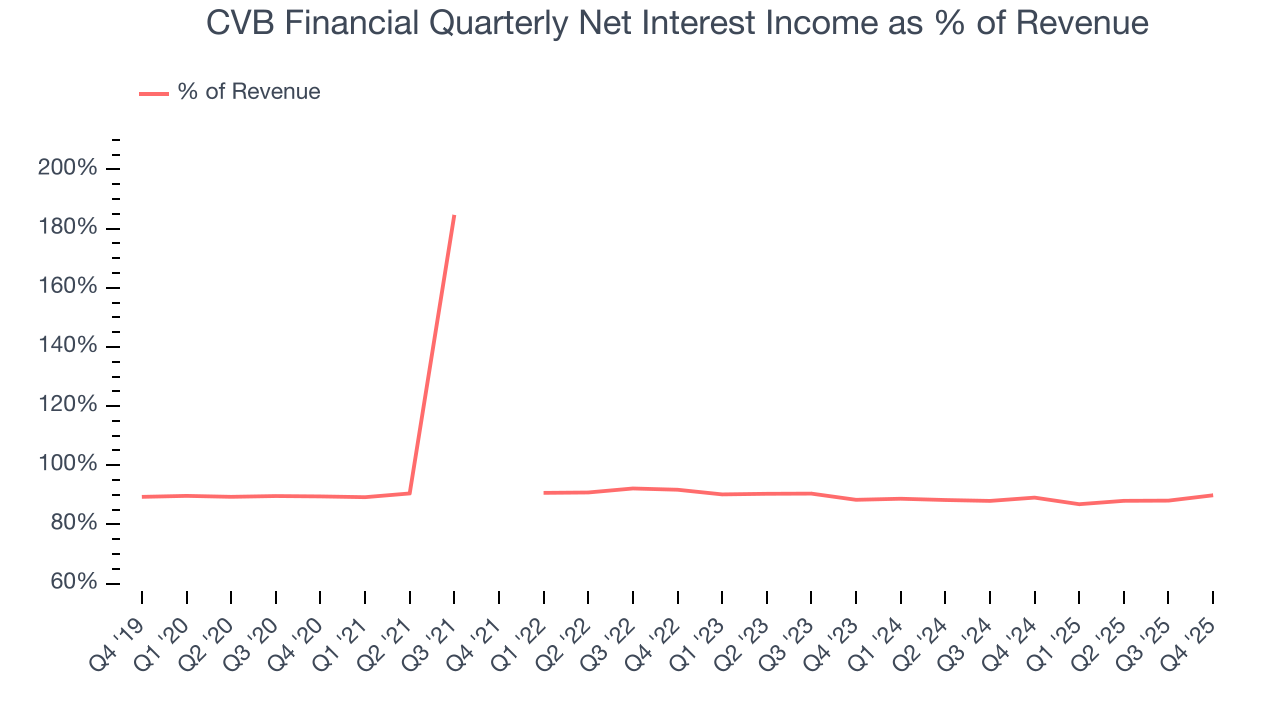
Net interest income made up 79.5% of the company’s total revenue during the last five years, meaning lending operations are CVB Financial’s largest source of revenue.
 Note: Quarters not shown were determined to be outliers, impacted by outsized investment gains/losses that are not indicative of the recurring fundamentals of the business.
While banks generate revenue from multiple sources, investors view net interest income as the cornerstone - its predictable, recurring characteristics stand in sharp contrast to the volatility of non-interest income.
6. Efficiency Ratio
Topline growth alone doesn't tell the complete story - the profitability of that growth shapes actual earnings impact. Banks track this dynamic through efficiency ratios, which compare non-interest expenses such as personnel, rent, IT, and marketing costs to total revenue streams.
Investors place greater emphasis on efficiency ratio movements than absolute values, understanding that expense structures reflect revenue mix variations. Lower ratios represent better operational performance since they show banks generating more revenue per dollar of expense.
Over the last four years, CVB Financial’s efficiency ratio has increased by 5.2 percentage points, going from 40.9% to 46%. Said differently, the company’s expenses have increased at a faster rate than revenue, which usually raises questions unless the company is in high-growth mode and reinvesting its profits into attractive ventures.
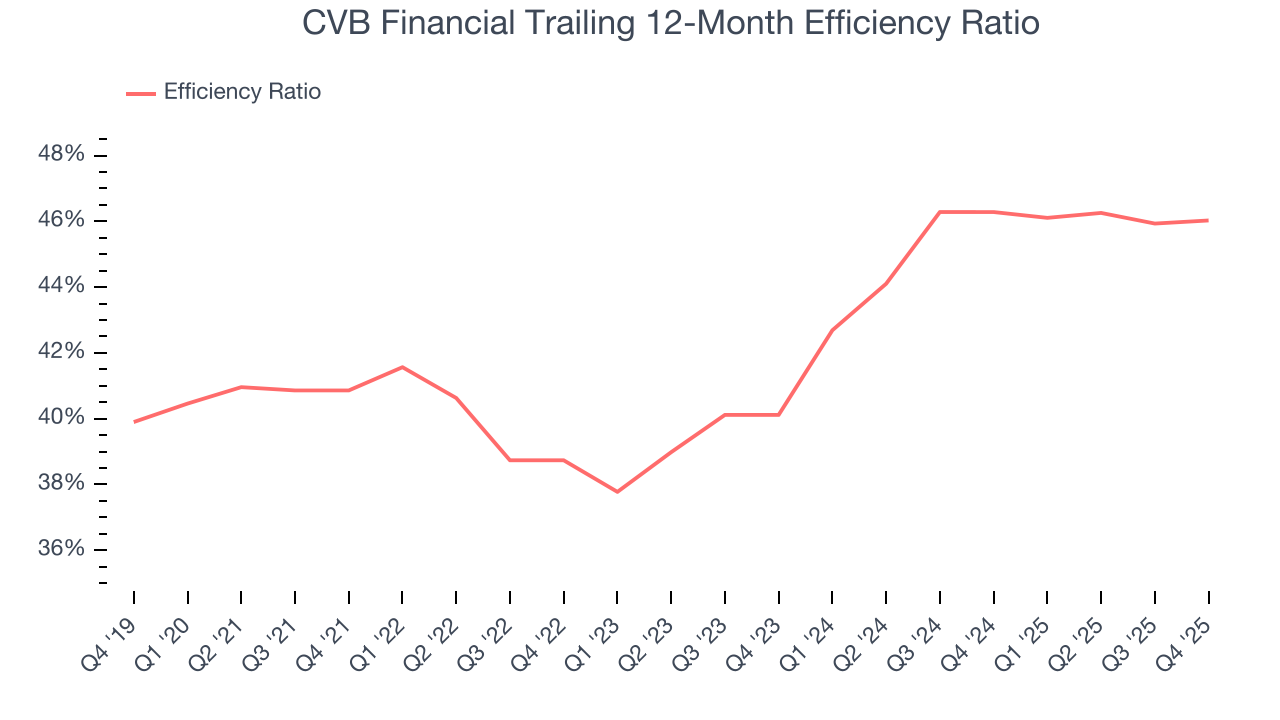
CVB Financial’s efficiency ratio came in at 46.3% this quarter, falling short of analysts’ expectations by 273 basis points (100 basis points = 1 percentage point).
For the next 12 months, Wall Street expects CVB Financial to rein in some of its expenses as it anticipates an efficiency ratio of 44.4%.
7. Earnings Per Share
Revenue trends explain a company’s historical growth, but the long-term change in earnings per share (EPS) points to the profitability of that growth – for example, a company could inflate its sales through excessive spending on advertising and promotions.
CVB Financial’s weak 3% annual EPS growth over the last five years aligns with its revenue performance. On the bright side, this tells us its incremental sales were profitable.
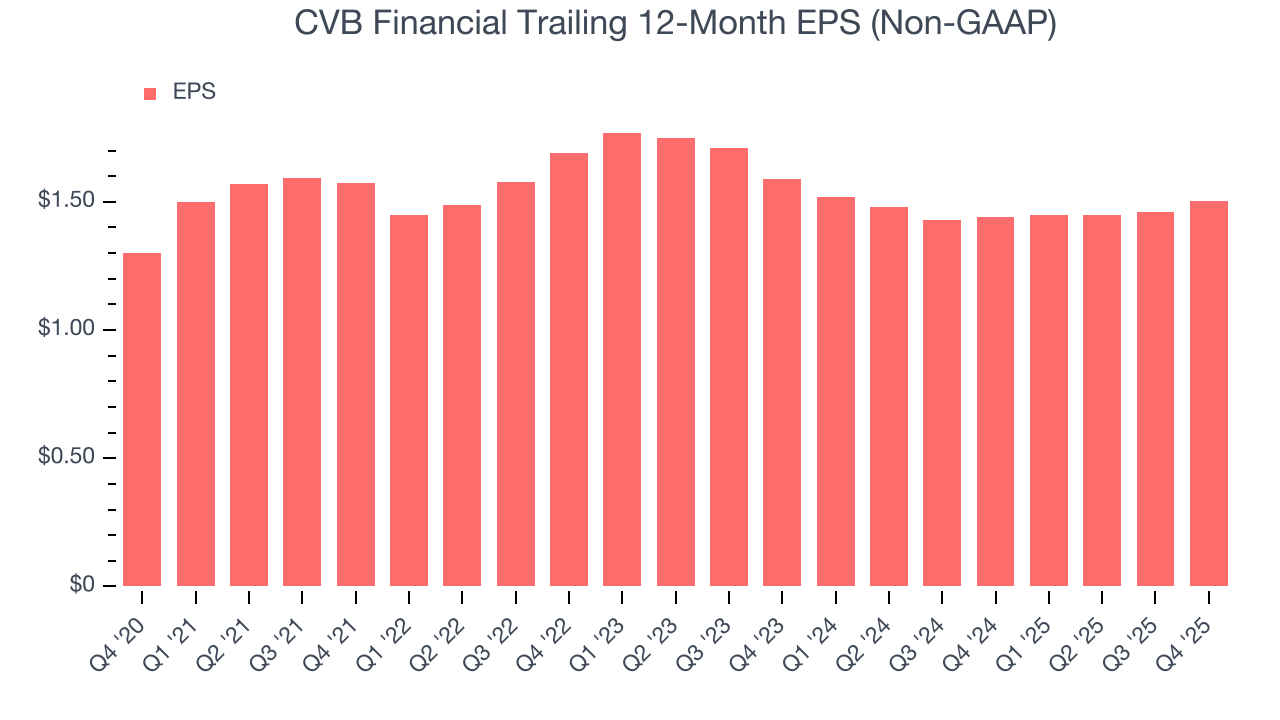
Like with revenue, we analyze EPS over a shorter period to see if we are missing a change in the business.
For CVB Financial, its two-year annual EPS declines of 2.7% show it’s continued to underperform. These results were bad no matter how you slice the data.
In Q4, CVB Financial reported adjusted EPS of $0.41, up from $0.36 in the same quarter last year. This print beat analysts’ estimates by 2.5%. Over the next 12 months, Wall Street expects CVB Financial’s full-year EPS of $1.51 to grow 3%.
8. Tangible Book Value Per Share (TBVPS)
Banks are balance sheet-driven businesses because they generate earnings primarily through borrowing and lending. They’re also valued based on their balance sheet strength and ability to compound book value (another name for shareholders’ equity) over time.
Because of this, tangible book value per share (TBVPS) emerges as the critical performance benchmark. By excluding intangible assets with uncertain liquidation values, this metric captures real, liquid net worth per share. Other (and more commonly known) per-share metrics like EPS can sometimes be murky due to M&A or accounting rules allowing for loan losses to be spread out.
CVB Financial’s TBVPS grew at a tepid 3.1% annual clip over the last five years. However, TBVPS growth has accelerated recently, growing by 9.9% annually over the last two years from $9.31 to $11.24 per share.
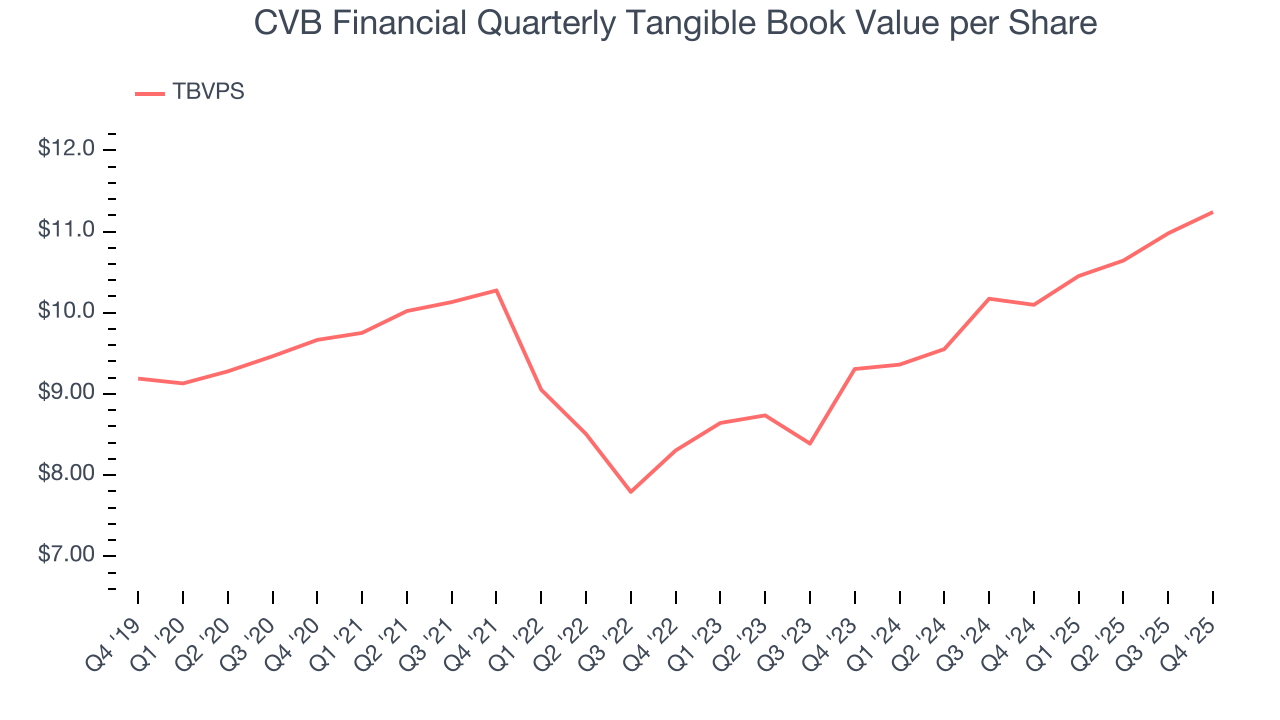
Over the next 12 months, Consensus estimates call for CVB Financial’s TBVPS to grow by 1.3% to $11.39, inadequate growth rate.
9. Balance Sheet Assessment
Leverage is core to a financial firm’s business model (loans funded by deposits). To ensure economic stability and avoid a repeat of the 2008 GFC, regulators require certain levels of capital and liquidity, focusing on the Tier 1 capital ratio.
Tier 1 capital is the highest-quality capital that a firm holds, consisting primarily of common stock and retained earnings, but also physical gold. It serves as the primary cushion against losses and is the first line of defense in times of financial distress.
This capital is divided by risk-weighted assets to derive the Tier 1 capital ratio. Risk-weighted means that cash and US treasury securities are assigned little risk while unsecured consumer loans and equity investments get much higher risk weights, for example.
New regulation after the 2008 financial crisis requires that all firms must maintain a Tier 1 capital ratio greater than 4.5%. On top of this, there are additional buffers based on scale, risk profile, and other regulatory classifications, so that at the end of the day, firms generally must maintain a 7-10% ratio at minimum.
Over the last two years, CVB Financial has averaged a Tier 1 capital ratio of 15.9%, which is considered safe and well capitalized in the event that macro or market conditions suddenly deteriorate.
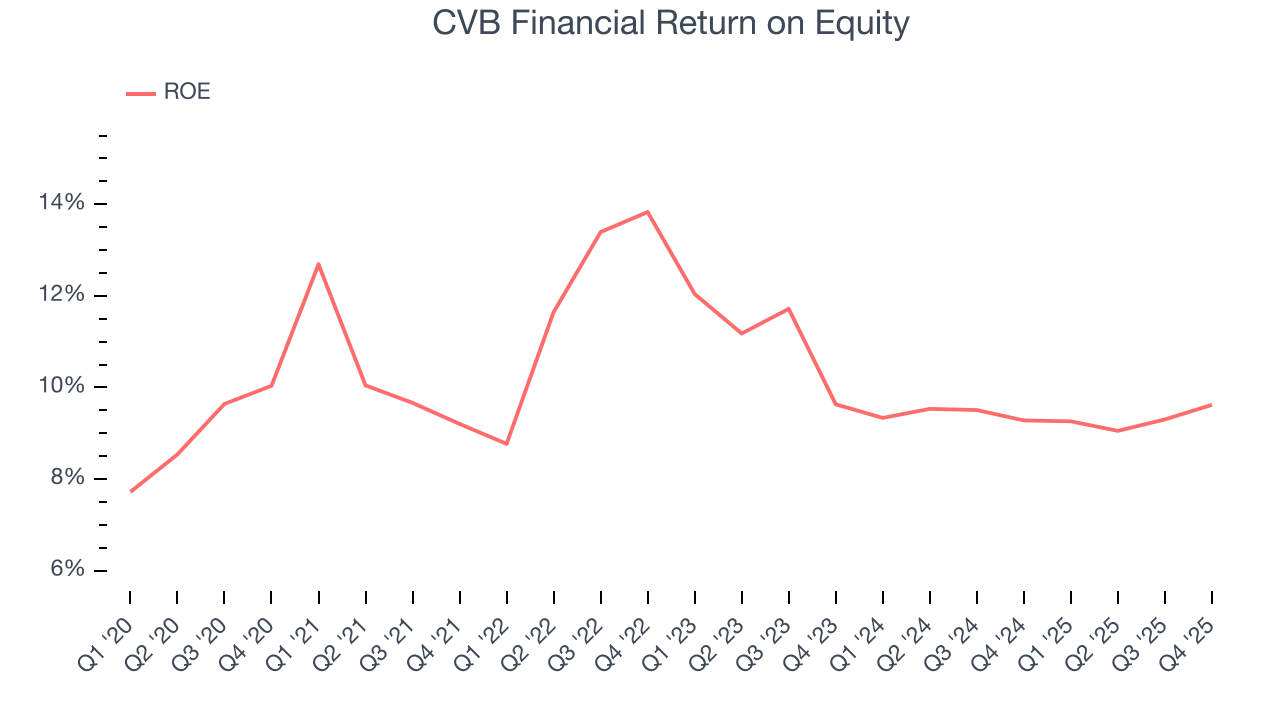
10. Return on Equity
Return on equity (ROE) measures how effectively banks generate profit from each dollar of shareholder equity - a critical funding source. High-ROE institutions typically compound shareholder wealth faster over time through retained earnings, share repurchases, and dividend payments.
Over the last five years, CVB Financial has averaged an ROE of 10.4%, respectable for a company operating in a sector where the average shakes out around 7.5% and those putting up 15%+ are greatly admired.
11. Key Takeaways from CVB Financial’s Q4 Results
It was encouraging to see CVB Financial beat analysts’ net interest income expectations this quarter. We were also happy its revenue narrowly outperformed Wall Street’s estimates. On the other hand, its EPS slightly beat. Zooming out, we think this was a mixed quarter. The stock remained flat at $20.73 immediately following the results.
12. Is Now The Time To Buy CVB Financial?
Updated: March 17, 2026 at 12:52 AM EDT
When considering an investment in CVB Financial, investors should account for its valuation and business qualities as well as what’s happened in the latest quarter.
CVB Financial falls short of our quality standards. To kick things off, its revenue growth was weak over the last five years. While its estimated net interest income growth for the next 12 months is great, the downside is its net interest income growth was weak over the last five years. On top of that, its estimated sales for the next 12 months are weak.
CVB Financial’s P/B ratio based on the next 12 months is 1x. This valuation tells us a lot of optimism is priced in - we think there are better stocks to buy right now.
Wall Street analysts have a consensus one-year price target of $22.88 on the company (compared to the current share price of $19).
Although the price target is bullish, readers should exercise caution because analysts tend to be overly optimistic. The firms they work for, often big banks, have relationships with companies that extend into fundraising, M&A advisory, and other rewarding business lines. As a result, they typically hesitate to say bad things for fear they will lose out. We at StockStory do not suffer from such conflicts of interest, so we’ll always tell it like it is.