
Dollar Tree (DLTR)
Dollar Tree is up against the odds. Its low returns on capital and plummeting sales suggest it struggles to generate demand and profits, a red flag.― StockStory Analyst Team
1. News


2. Summary
Why We Think Dollar Tree Will Underperform
A treasure hunt because there’s no guarantee of consistent product selection, Dollar Tree (NASDAQ:DLTR) is a discount retailer that sells general merchandise and select packaged food at extremely low prices.
- Products have few die-hard fans as sales have declined by 11.9% annually over the last three years
- Underwhelming 6.6% return on capital reflects management’s difficulties in finding profitable growth opportunities, and its falling returns suggest its earlier profit pools are drying up
- Operating margin falls short of the industry average, and the smaller profit dollars make it harder to react to unexpected market developments


Dollar Tree falls short of our quality standards. We’re hunting for superior stocks elsewhere.
Why There Are Better Opportunities Than Dollar Tree


At $107.74 per share, Dollar Tree trades at 17.4x forward P/E. The current valuation may be fair, but we’re still passing on this stock due to better alternatives out there.
We’d rather invest in similarly-priced but higher-quality companies with more reliable earnings growth.
3. Dollar Tree (DLTR) Research Report: Q3 CY2025 Update
Discount treasure-hunt retailer Dollar Tree (NASDAQ:DLTR) beat Wall Street’s revenue expectations in Q3 CY2025, but sales fell by 37.2% year on year to $4.75 billion. Guidance for next quarter’s revenue was better than expected at $5.45 billion at the midpoint, 0.6% above analysts’ estimates. Its non-GAAP profit of $1.21 per share was 11.8% above analysts’ consensus estimates.
Dollar Tree (DLTR) Q3 CY2025 Highlights:
- Revenue: $4.75 billion vs analyst estimates of $4.69 billion (37.2% year-on-year decline, 1.2% beat)
- Adjusted EPS: $1.21 vs analyst estimates of $1.08 (11.8% beat)
- Adjusted EBITDA: $553.8 million vs analyst estimates of $478.7 million (11.7% margin, 15.7% beat)
- Revenue Guidance for Q4 CY2025 is $5.45 billion at the midpoint, roughly in line with what analysts were expecting
- Management raised its full-year Adjusted EPS guidance to $5.70 at the midpoint, a 3.3% increase
- Operating Margin: 7.2%, up from 4.4% in the same quarter last year
- Free Cash Flow was -$57.1 million, down from $354.4 million in the same quarter last year
- Same-Store Sales rose 4.2% year on year (1.8% in the same quarter last year)
- Market Capitalization: $21.99 billion
Company Overview
A treasure hunt because there’s no guarantee of consistent product selection, Dollar Tree (NASDAQ:DLTR) is a discount retailer that sells general merchandise and select packaged food at extremely low prices.
Founded in 1986 and initially selling items priced at $1 or less, the company has since expanded its selection and price points. However, most items are still under $5 with an extensive selection under $2.
While low prices are an obvious benefit to the consumer, the tradeoff is consistency of selection. One day, a shopper may find bottles of name-brand dish soap for $1 that would sell for much more elsewhere. However, that product may not be available weeks later. This is why the Dollar Tree experience is often called a treasure hunt. The company’s sourcing and logistics capabilities are a key reason prices are so low. Shorter-term deals and arbitrage opportunities are prioritized by the merchandising team over long-term supplier agreements.
Dollar Tree is known for party supplies, holiday décor, home goods, toys, and a limited snack selection, but the company also operates the Family Dollar banner. Acquired in 2015, Family Dollar focuses more on food and consistent selection to serve the grocery needs of lower-income households. The concept competes most directly with Dollar General and looks to locate stores in rural or suburban areas not served well by large regional grocery chains or general merchandise behemoths like Walmart.
4. Discount Grocery Store
Traditional grocery stores are go-tos for many families, but discount grocers serve those who may not have a traditional grocery store nearby or who may have different spending thresholds. Certain rural or lower-income areas simply don’t have a grocery store. Additionally, some lower-income families would prefer to buy in smaller quantities than available at most stores (think one or two paper towel rolls at a time). While online competition threatens all of retail, grocery is one of the least penetrated because of the nature of buying food. Furthermore, those buying small quantities for immediate need are even less likely to leverage e-commerce for these purposes.
Competitors that offer a treasure-hunt experience centered around general merchandise and/or snacks include Five Below (NASDAQ:FIVE), Dollarama (TSX:DOL), and TJX (NYSE:TJX).
5. Revenue Growth
A company’s long-term sales performance can indicate its overall quality. Even a bad business can shine for one or two quarters, but a top-tier one grows for years.
With $18.96 billion in revenue over the past 12 months, Dollar Tree is one of the larger companies in the consumer retail industry and benefits from a well-known brand that influences purchasing decisions. However, its scale is a double-edged sword because there are only a finite number of places to build new stores, making it harder to find incremental growth. For Dollar Tree to boost its sales, it likely needs to adjust its prices or lean into foreign markets.
As you can see below, Dollar Tree’s demand was weak over the last three years (we compare to 2019 to normalize for COVID-19 impacts). Its sales fell by 11.9% annually as it didn’t open many new stores.
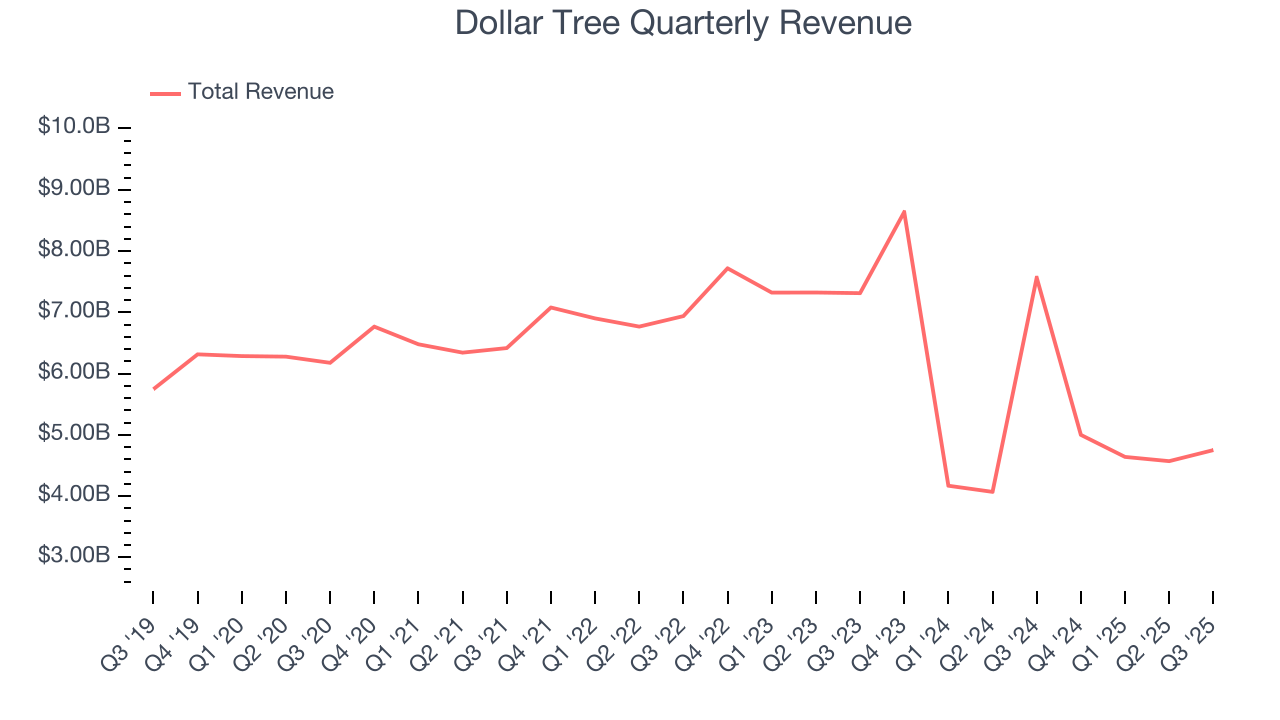
This quarter, Dollar Tree’s revenue fell by 37.2% year on year to $4.75 billion but beat Wall Street’s estimates by 1.2%. Company management is currently guiding for a 9% year-on-year increase in sales next quarter.
Looking further ahead, sell-side analysts expect revenue to grow 6.6% over the next 12 months, an acceleration versus the last three years. This projection is particularly noteworthy for a company of its scale and indicates its newer products will spur better top-line performance.
6. Store Performance
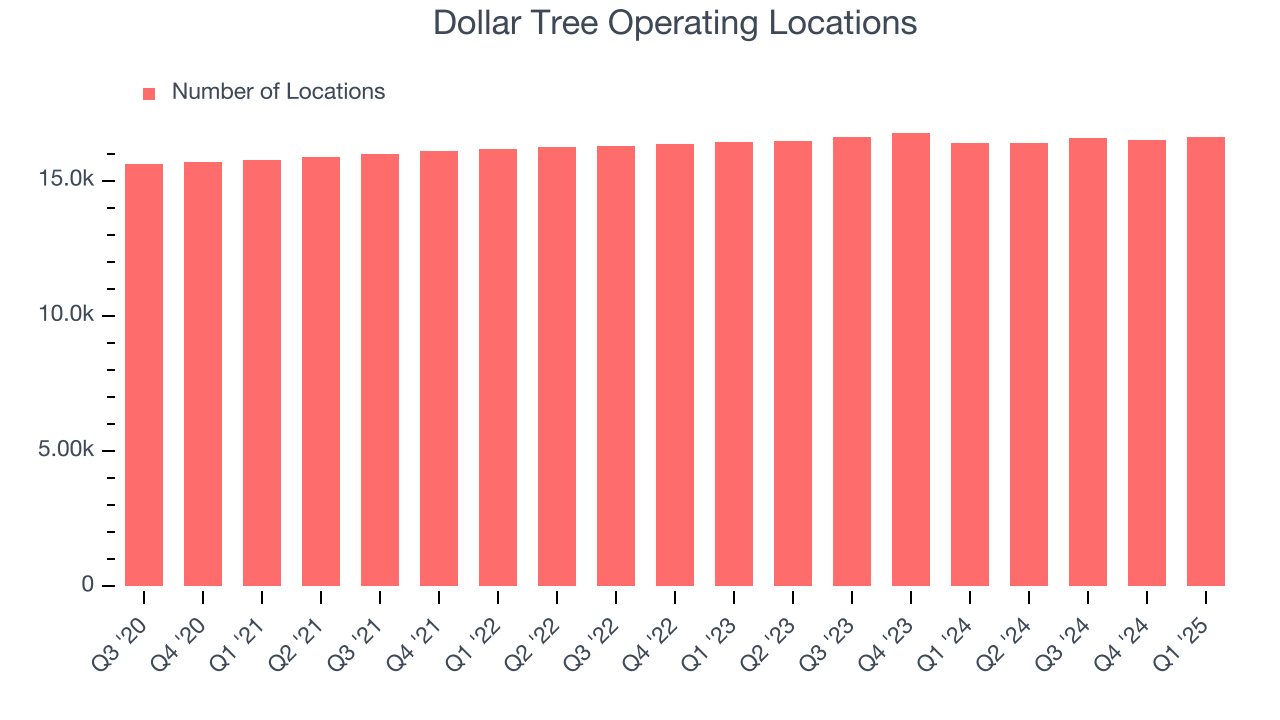
Number of Stores
A retailer’s store count often determines how much revenue it can generate.
Over the last two years, Dollar Tree has kept its store count flat while other consumer retail businesses have opted for growth.
When a retailer keeps its store footprint steady, it usually means demand is stable and it’s focusing on operational efficiency to increase profitability.
Note that Dollar Tree reports its store count intermittently, so some data points are missing in the chart below.
Same-Store Sales
The change in a company's store base only tells one side of the story. The other is the performance of its existing locations and e-commerce sales, which informs management teams whether they should expand or downsize their physical footprints. Same-store sales provides a deeper understanding of this issue because it measures organic growth at brick-and-mortar shops for at least a year.
Dollar Tree’s demand has been healthy for a retailer over the last two years. On average, the company has grown its same-store sales by a robust 3.1% per year. Given its flat store base over the same period, this performance stems from not only increased foot traffic at existing locations but also higher e-commerce sales as demand shifts from in-store to online.
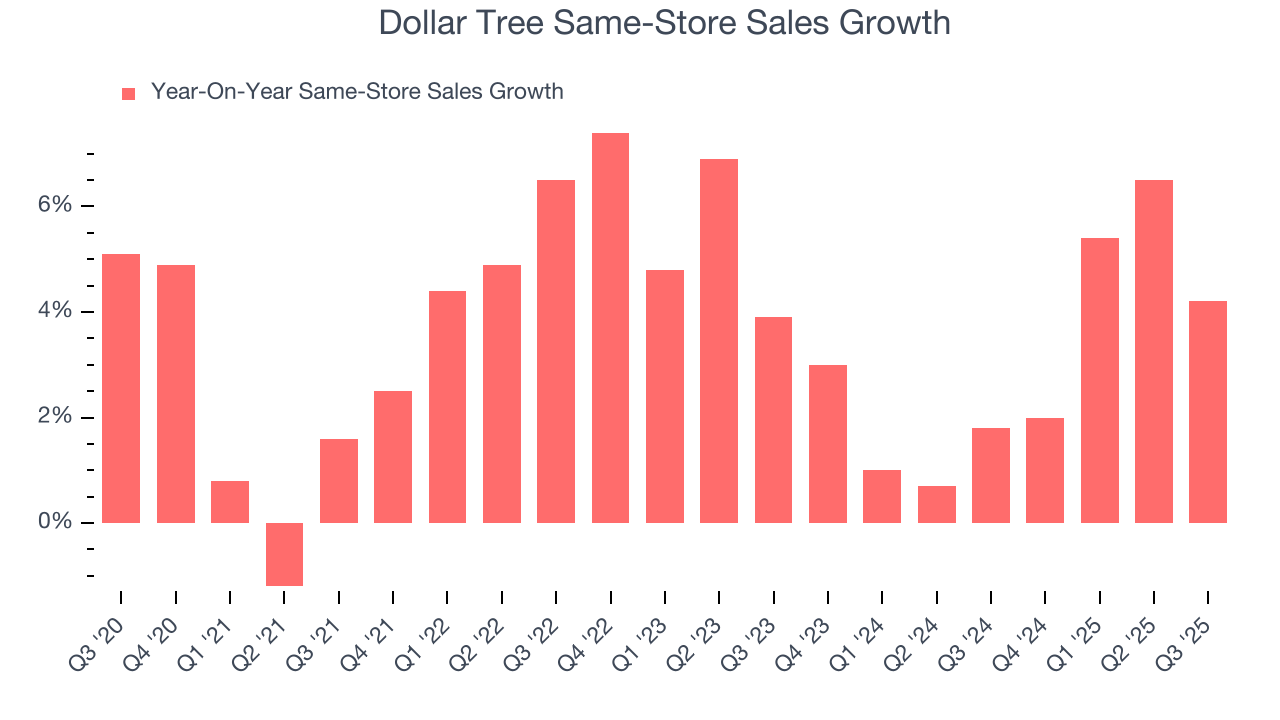
In the latest quarter, Dollar Tree’s same-store sales rose 4.2% year on year. This growth was an acceleration from its historical levels, which is always an encouraging sign.
7. Gross Margin & Pricing Power
Dollar Tree has bad unit economics for a retailer, signaling it operates in a competitive market and lacks pricing power because its inventory is sold in many places. As you can see below, it averaged a 34.3% gross margin over the last two years.
When compared to other non-discretionary retailers, however, it’s actually pretty solid. That’s because non-discretionary retailers have structurally lower gross margins; they compete on the lowest price, sell products easily found elsewhere, and have high transportation costs to move goods. We believe the best metrics to assess these companies are free cash flow margin, operating leverage, and profit volatility, which account for their scale advantages and non-cyclical demand.
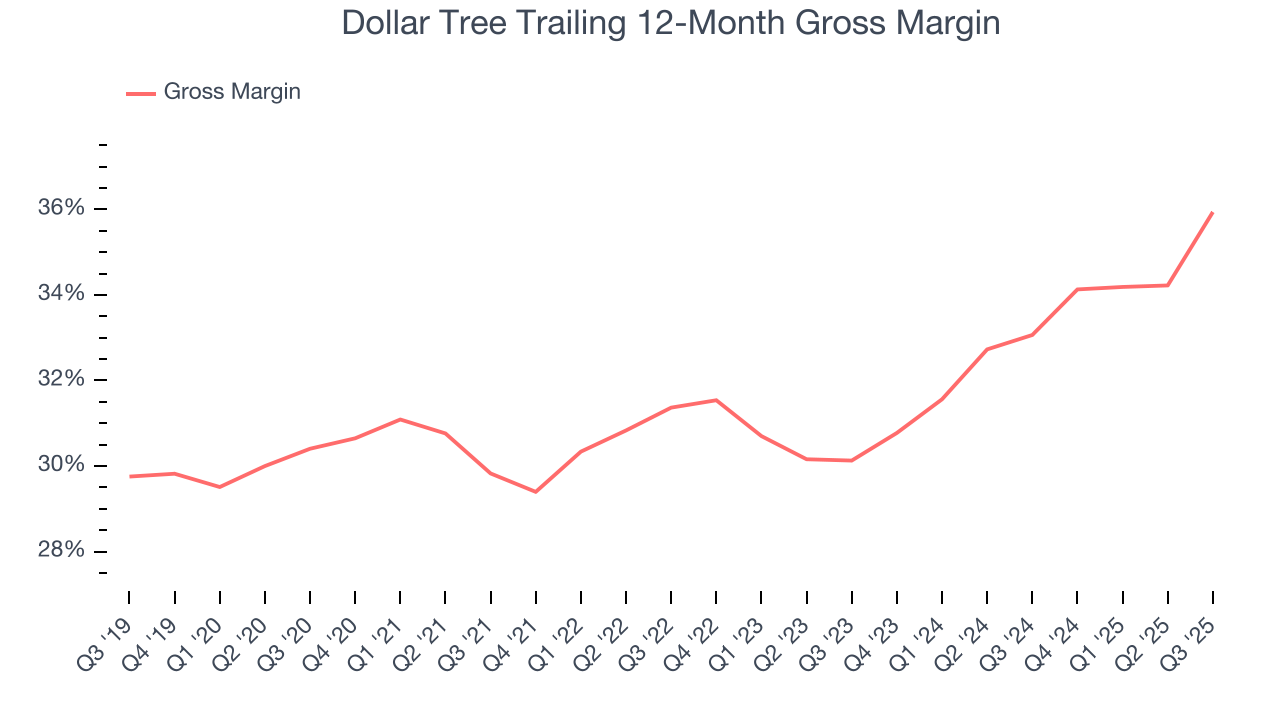
Dollar Tree’s gross profit margin came in at 35.9% this quarter, up 4.9 percentage points year on year. Dollar Tree’s full-year margin has also been trending up over the past 12 months, increasing by 2.9 percentage points. If this move continues, it could suggest the company has less pressure to discount products and is realizing better unit economics due to stable or shrinking input costs (such as labor and freight expenses to transport goods).
8. Operating Margin
Dollar Tree was profitable over the last two years but held back by its large cost base. Its average operating margin of 7.5% was weak for a consumer retail business. This result isn’t too surprising given its low gross margin as a starting point.
On the plus side, Dollar Tree’s operating margin rose by 1.3 percentage points over the last year.
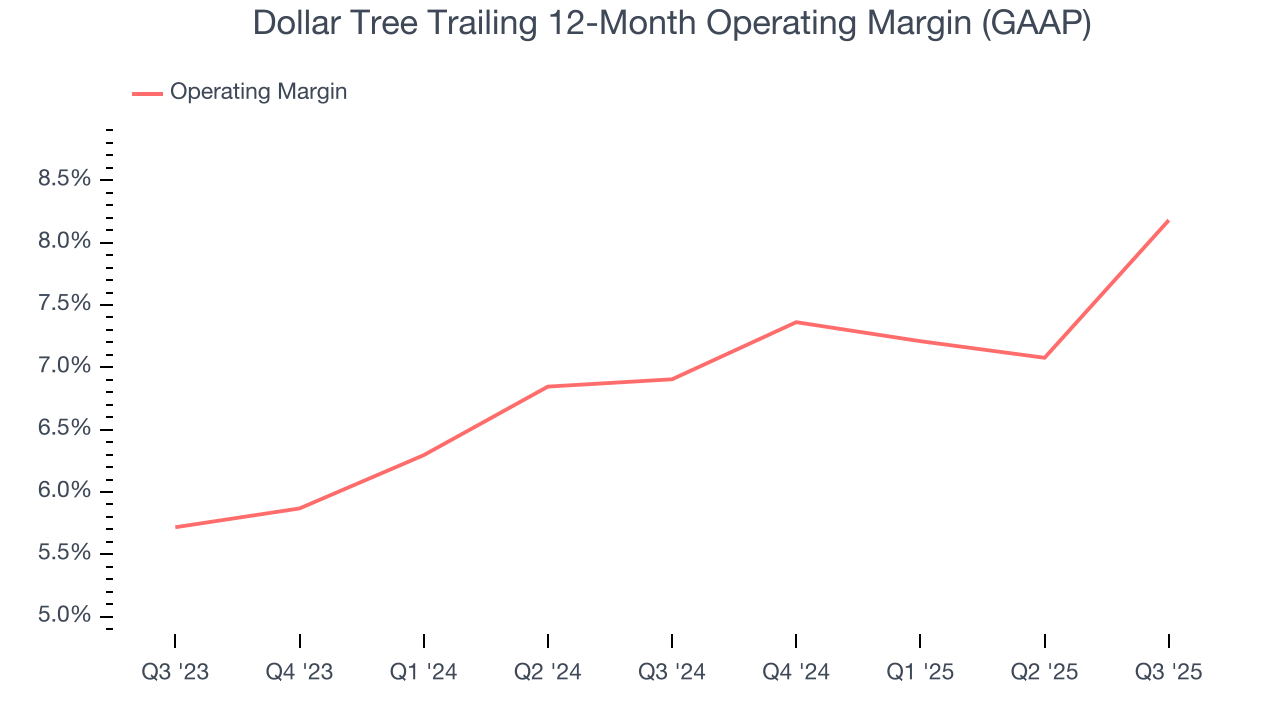
This quarter, Dollar Tree generated an operating margin profit margin of 7.2%, up 2.8 percentage points year on year. Since its gross margin expanded more than its operating margin, we can infer that leverage on its cost of sales was the primary driver behind the recently higher efficiency.
9. Earnings Per Share
We track the long-term change in earnings per share (EPS) for the same reason as long-term revenue growth. Compared to revenue, however, EPS highlights whether a company’s growth is profitable.
Sadly for Dollar Tree, its EPS and revenue declined by 8.3% and 11.9% annually over the last three years. In a mature sector such as consumer retail, we tend to steer our readers away from companies with falling EPS because it could imply changing secular trends and preferences. If the tide turns unexpectedly, Dollar Tree’s low margin of safety could leave its stock price susceptible to large downswings.
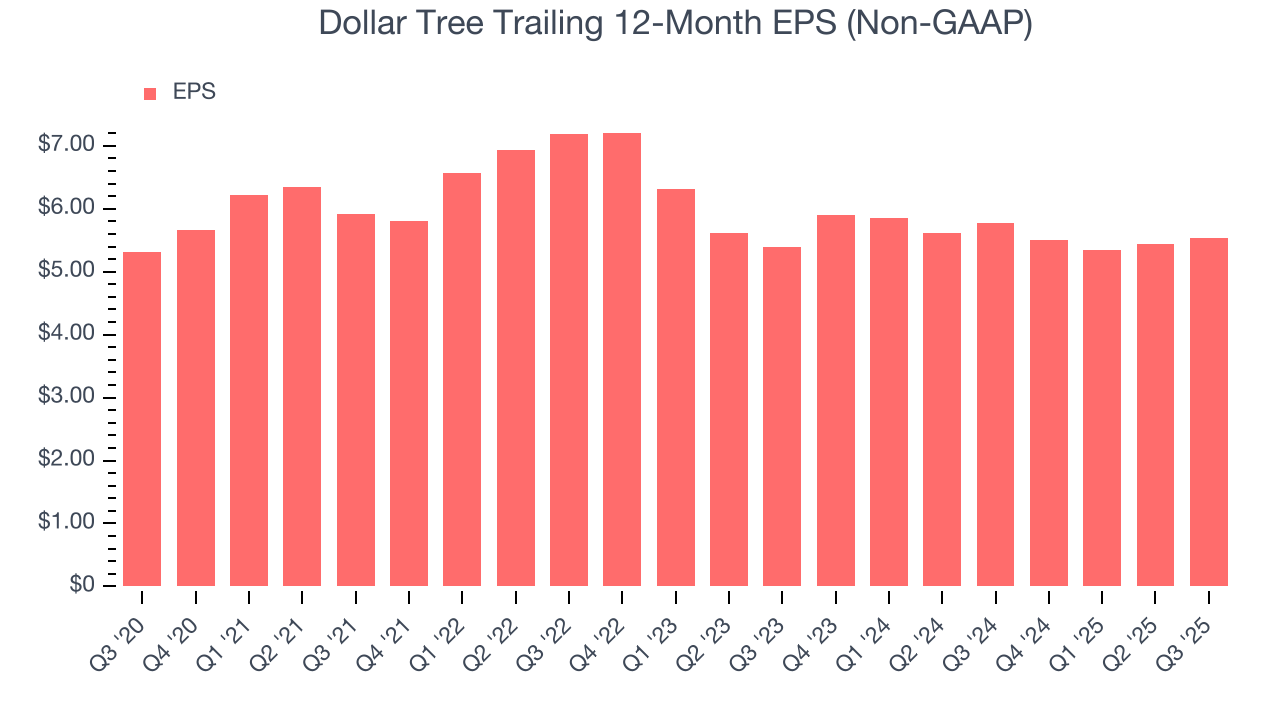
In Q3, Dollar Tree reported adjusted EPS of $1.21, up from $1.12 in the same quarter last year. This print easily cleared analysts’ estimates, and shareholders should be content with the results. Over the next 12 months, Wall Street expects Dollar Tree’s full-year EPS of $5.53 to grow 16.1%.
10. Cash Is King
If you’ve followed StockStory for a while, you know we emphasize free cash flow. Why, you ask? We believe that in the end, cash is king, and you can’t use accounting profits to pay the bills.
Dollar Tree has shown decent cash profitability, giving it some flexibility to reinvest or return capital to investors. The company’s free cash flow margin averaged 3.9% over the last two years, slightly better than the broader consumer retail sector.
Taking a step back, we can see that Dollar Tree’s margin expanded by 1 percentage points over the last year. This is encouraging because it gives the company more optionality.
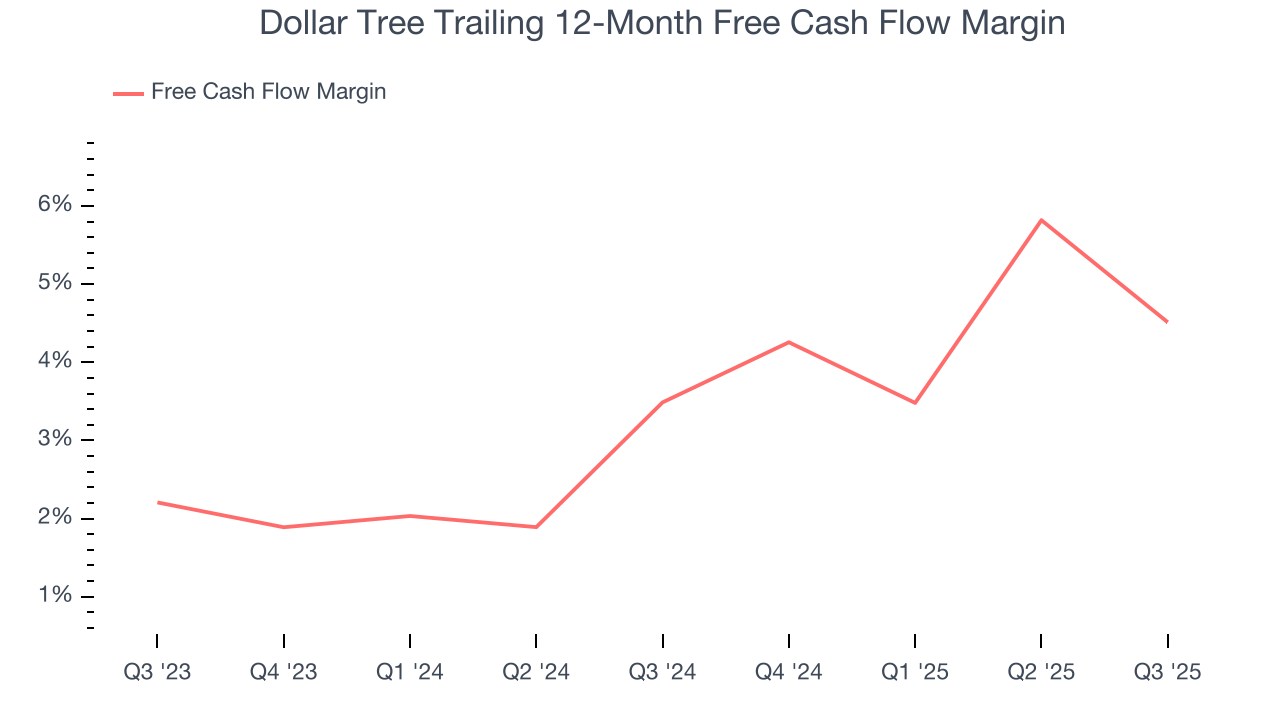
Dollar Tree burned through $57.1 million of cash in Q3, equivalent to a negative 1.2% margin. The company’s cash flow turned negative after being positive in the same quarter last year, prompting us to pay closer attention. Short-term fluctuations typically aren’t a big deal because investment needs can be seasonal, but we’ll be watching to see if the trend extrapolates into future quarters.
11. Return on Invested Capital (ROIC)
EPS and free cash flow tell us whether a company was profitable while growing its revenue. But was it capital-efficient? A company’s ROIC explains this by showing how much operating profit it makes compared to the money it has raised (debt and equity).
Dollar Tree historically did a mediocre job investing in profitable growth initiatives. Its five-year average ROIC was 9.8%, somewhat low compared to the best consumer retail companies that consistently pump out 25%+.
12. Balance Sheet Assessment
Dollar Tree reported $637.3 million of cash and $7.66 billion of debt on its balance sheet in the most recent quarter. As investors in high-quality companies, we primarily focus on two things: 1) that a company’s debt level isn’t too high and 2) that its interest payments are not excessively burdening the business.
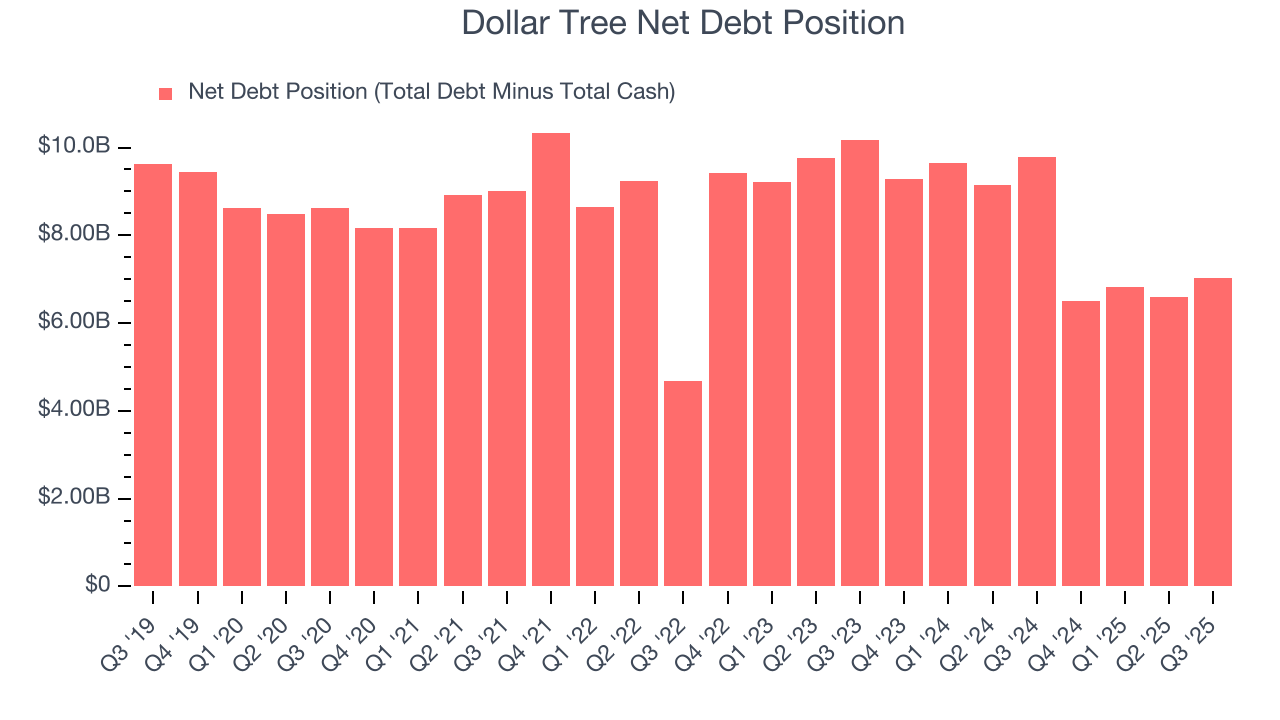
With $2.12 billion of EBITDA over the last 12 months, we view Dollar Tree’s 3.3× net-debt-to-EBITDA ratio as safe. We also see its $46.2 million of annual interest expenses as appropriate. The company’s profits give it plenty of breathing room, allowing it to continue investing in growth initiatives.
13. Key Takeaways from Dollar Tree’s Q3 Results
We were impressed by how significantly Dollar Tree blew past analysts’ EBITDA expectations this quarter. We were also glad its EPS guidance for next quarter exceeded Wall Street’s estimates. Overall, we think this was a decent quarter with some key metrics above expectations. The stock traded up 1.7% to $110.85 immediately after reporting.
14. Is Now The Time To Buy Dollar Tree?
Updated: March 13, 2026 at 10:28 PM EDT
A common mistake we notice when investors are deciding whether to buy a stock or not is that they simply look at the latest earnings results. Business quality and valuation matter more, so we urge you to understand these dynamics as well.
We cheer for all companies serving everyday consumers, but in the case of Dollar Tree, we’ll be cheering from the sidelines. For starters, its revenue has declined over the last three years. While its projected EPS for the next year implies the company’s fundamentals will improve, the downside is its relatively low ROIC suggests management has struggled to find compelling investment opportunities. On top of that, its operating margins reveal poor profitability compared to other retailers.
Dollar Tree’s P/E ratio based on the next 12 months is 17.4x. While this valuation is fair, the upside isn’t great compared to the potential downside. There are better investments elsewhere.
Wall Street analysts have a consensus one-year price target of $126.30 on the company (compared to the current share price of $107.74).
Although the price target is bullish, readers should exercise caution because analysts tend to be overly optimistic. The firms they work for, often big banks, have relationships with companies that extend into fundraising, M&A advisory, and other rewarding business lines. As a result, they typically hesitate to say bad things for fear they will lose out. We at StockStory do not suffer from such conflicts of interest, so we’ll always tell it like it is.