
East West Bank (EWBC)
East West Bank doesn’t impress us. Its decelerating revenue growth and even worse EPS performance give us little confidence it can beat the market.― StockStory Analyst Team
1. News


2. Summary
Why East West Bank Is Not Exciting
As the largest independent bank in the U.S. focused on bridging financial services between America and Asia, East West Bancorp (NASDAQ:EWBC) operates a commercial bank that provides personal and business banking services with a unique focus on facilitating U.S.-Asia cross-border transactions.
- Efficiency ratio is anticipated to remain the same over the next year, suggesting its fixed cost leverage is currently maxed out
- Inferior net interest margin of 3.4% means it must compensate for lower profitability through increased loan originations
- A silver lining is that its incremental sales over the last five years have been highly profitable as its earnings per share increased by 19.2% annually, topping its revenue gains


East West Bank fails to meet our quality criteria. We’re on the lookout for more interesting opportunities.
Why There Are Better Opportunities Than East West Bank


At $104.62 per share, East West Bank trades at 1.5x forward P/B. This multiple is higher than most banking companies, and we think it’s quite expensive for the quality you get.
There are stocks out there similarly priced with better business quality. We prefer owning these.
3. East West Bank (EWBC) Research Report: Q4 CY2025 Update
Cross-border banking company East West Bancorp (NASDAQ:EWBC) announced better-than-expected revenue in Q4 CY2025, with sales up 12.2% year on year to $758.3 million. Its non-GAAP profit of $2.52 per share was 0.8% above analysts’ consensus estimates.
East West Bank (EWBC) Q4 CY2025 Highlights:
- Net Interest Income: $657.8 million vs analyst estimates of $653.5 million (11.9% year-on-year growth, 0.7% beat)
- Net Interest Margin: 3.4% vs analyst estimates of 3.4% (3.9 basis point beat)
- Revenue: $758.3 million vs analyst estimates of $746.1 million (12.2% year-on-year growth, 1.6% beat)
- Efficiency Ratio: 34.5% vs analyst estimates of 35.3% (83.2 basis point beat)
- Adjusted EPS: $2.52 vs analyst estimates of $2.50 (0.8% beat)
- Tangible Book Value per Share: $61.27 vs analyst estimates of $60.90 (16.9% year-on-year growth, 0.6% beat)
- Market Capitalization: $15.89 billion
Company Overview
As the largest independent bank in the U.S. focused on bridging financial services between America and Asia, East West Bancorp (NASDAQ:EWBC) operates a commercial bank that provides personal and business banking services with a unique focus on facilitating U.S.-Asia cross-border transactions.
East West Bank serves as a financial bridge between the United States and Asia through its network of over 120 locations across both regions. The bank offers traditional deposit products like checking and savings accounts alongside specialized services including foreign exchange, treasury management, and wealth management. Its lending activities span commercial and residential real estate, construction finance, trade finance, and asset-based lending.
What distinguishes East West Bank from most regional U.S. banks is its commercial business operating license in China through its subsidiary, East West Bank (China) Limited. This unique position allows it to open branches, make loans, and collect deposits directly in China, while also maintaining full-service branches in Hong Kong, Shanghai, Shantou, and Shenzhen, plus representative offices in several other Asian cities.
A manufacturing company based in California might use East West Bank to finance its expansion into Asian markets, utilizing the bank's cross-border expertise to navigate international regulations and currency exchanges. Similarly, a Chinese technology firm looking to establish operations in the U.S. could rely on East West's bilingual services and understanding of both markets.
The bank generates revenue primarily through interest income on loans and investments, as well as fees from its various banking services. It operates through three segments: Consumer and Business Banking, Commercial Banking, and Other corporate functions. East West Bank particularly focuses on serving the Asian American community and provides services in English and over 10 other languages to accommodate its diverse customer base.
4. Regional Banks
Regional banks, financial institutions operating within specific geographic areas, serve as intermediaries between local depositors and borrowers. They benefit from rising interest rates that improve net interest margins (the difference between loan yields and deposit costs), digital transformation reducing operational expenses, and local economic growth driving loan demand. However, these banks face headwinds from fintech competition, deposit outflows to higher-yielding alternatives, credit deterioration (increasing loan defaults) during economic slowdowns, and regulatory compliance costs. Recent concerns about regional bank stability following high-profile failures and significant commercial real estate exposure present additional challenges.
East West Bancorp competes with other regional banks with Asian operations such as Cathay Bank (NASDAQ:CATY), as well as larger financial institutions with international presence including HSBC (NYSE:HSBC), Citigroup (NYSE:C), and Bank of America (NYSE:BAC).
5. Sales Growth
Two primary revenue streams drive bank earnings. While net interest income, which is earned by charging higher rates on loans than paid on deposits, forms the foundation, fee-based services across banking, credit, wealth management, and trading operations provide additional income. Luckily, East West Bank’s revenue grew at a solid 12.4% compounded annual growth rate over the last five years. Its growth beat the average banking company and shows its offerings resonate with customers.
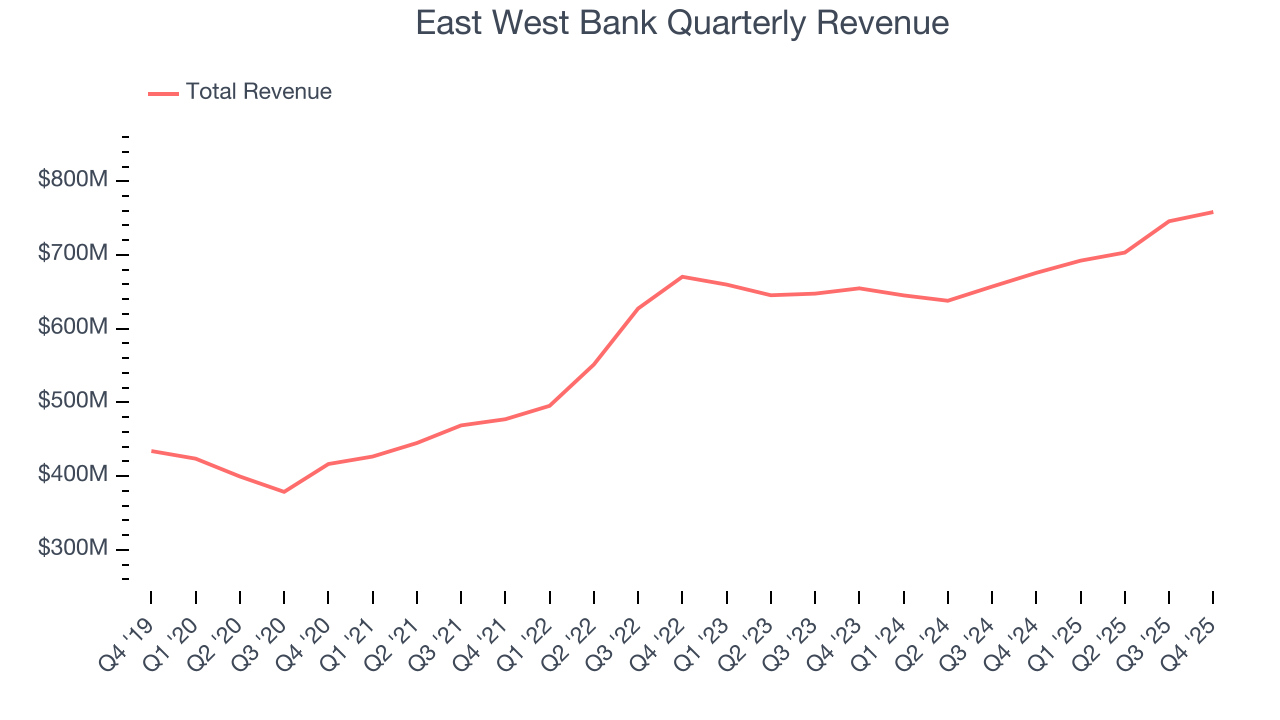
Long-term growth is the most important, but within financials, a half-decade historical view may miss recent interest rate changes and market returns. East West Bank’s recent performance shows its demand has slowed as its annualized revenue growth of 5.5% over the last two years was below its five-year trend. 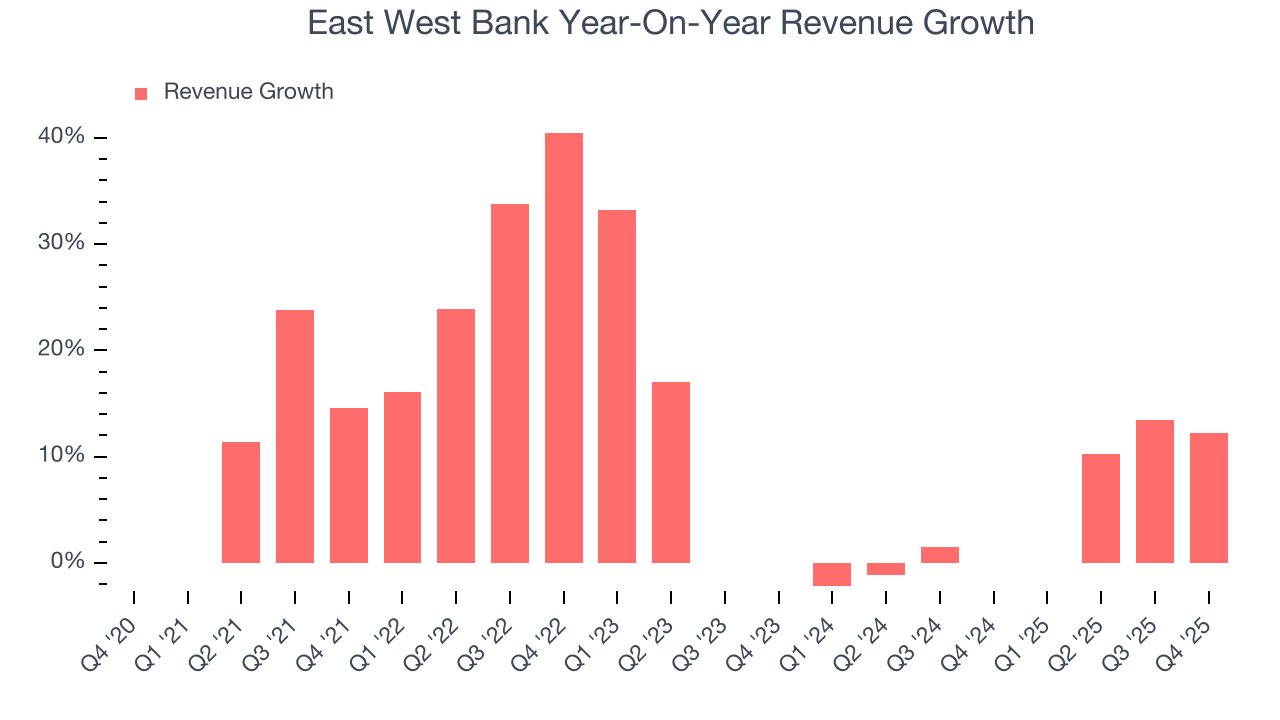 Note: Quarters not shown were determined to be outliers, impacted by outsized investment gains/losses that are not indicative of the recurring fundamentals of the business.
This quarter, East West Bank reported year-on-year revenue growth of 12.2%, and its $758.3 million of revenue exceeded Wall Street’s estimates by 1.6%.
Net interest income made up 86.6% of the company’s total revenue during the last five years, meaning East West Bank barely relies on non-interest income to drive its overall growth.
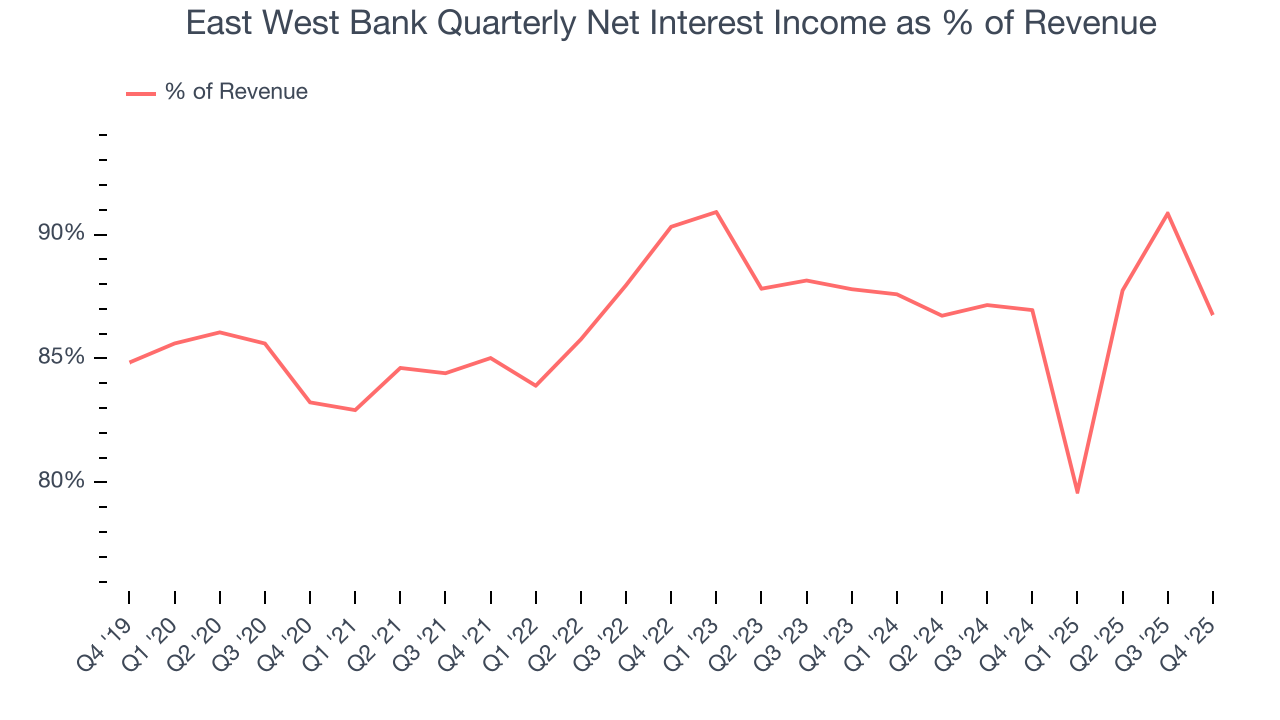
Our experience and research show the market cares primarily about a bank’s net interest income growth as non-interest income is considered a lower-quality and non-recurring revenue source.
6. Efficiency Ratio
Topline growth carries importance, but the overall profitability behind this expansion determines true value creation. For banks, the efficiency ratio captures this relationship by measuring non-interest expenses, including salaries, facilities, technology, and marketing, against total revenue.
Investors place greater emphasis on efficiency ratio movements than absolute values, understanding that expense structures reflect revenue mix variations. Lower ratios represent better operational performance since they show banks generating more revenue per dollar of expense.
Over the last five years, East West Bank’s efficiency ratio has swelled by 3.5 percentage points, going from 36.8% to 35.7%. Said differently, the company’s expenses have grown at a slower rate than revenue, which typically signals prudent management.
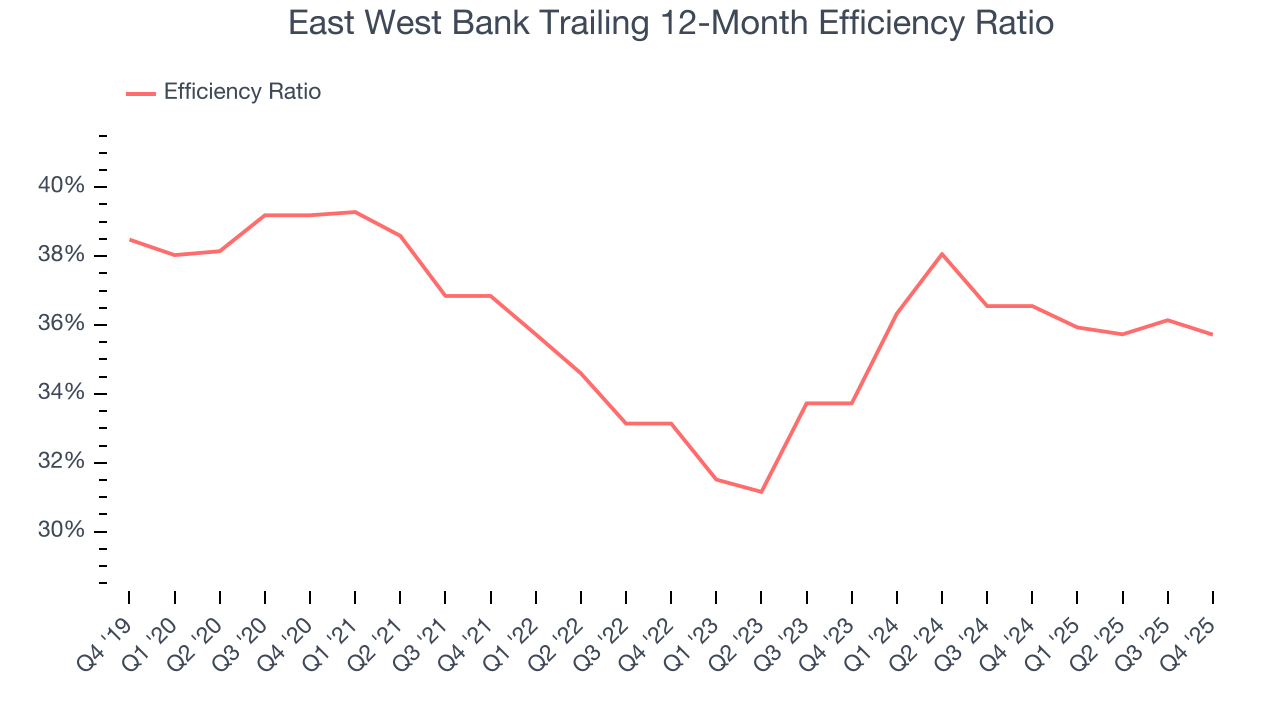
In Q4, East West Bank’s efficiency ratio was 34.5%, beating analysts’ expectations by 83.2 basis points (100 basis points = 1 percentage point).
For the next 12 months, Wall Street expects East West Bank to maintain its trailing one-year ratio with a projection of 35.8%.
7. Earnings Per Share
We track the long-term change in earnings per share (EPS) for the same reason as long-term revenue growth. Compared to revenue, however, EPS highlights whether a company’s growth is profitable.
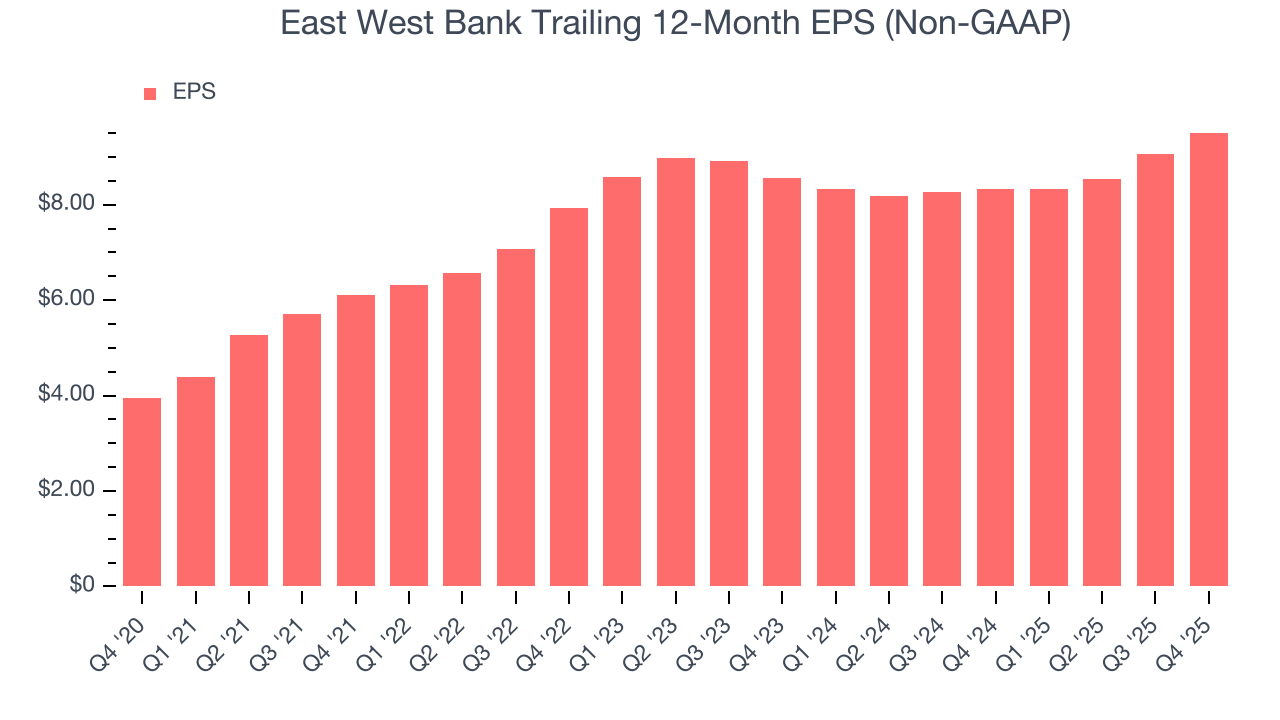
East West Bank’s EPS grew at an astounding 19.2% compounded annual growth rate over the last five years, higher than its 12.4% annualized revenue growth. However, this alone doesn’t tell us much about its business quality because its efficiency ratio didn’t improve.
Like with revenue, we analyze EPS over a shorter period to see if we are missing a change in the business.
For East West Bank, its two-year annual EPS growth of 5.4% was lower than its five-year trend. We hope its growth can accelerate in the future.
In Q4, East West Bank reported adjusted EPS of $2.52, up from $2.08 in the same quarter last year. This print was close to analysts’ estimates. Over the next 12 months, Wall Street expects East West Bank’s full-year EPS of $9.51 to grow 7%.
8. Tangible Book Value Per Share (TBVPS)
Banks operate as balance sheet businesses, with profits generated through borrowing and lending activities. Valuations reflect this reality, emphasizing balance sheet strength and long-term book value compounding ability.
This is why we consider tangible book value per share (TBVPS) the most important metric to track for banks. TBVPS represents the real, liquid net worth per share of a bank, excluding intangible assets that have debatable value upon liquidation. Traditional metrics like EPS are helpful but face distortion from M&A activity and loan loss accounting rules.
East West Bank’s TBVPS grew at an incredible 12.6% annual clip over the last five years. TBVPS growth has also accelerated recently, growing by 15% annually over the last two years from $46.31 to $61.27 per share.
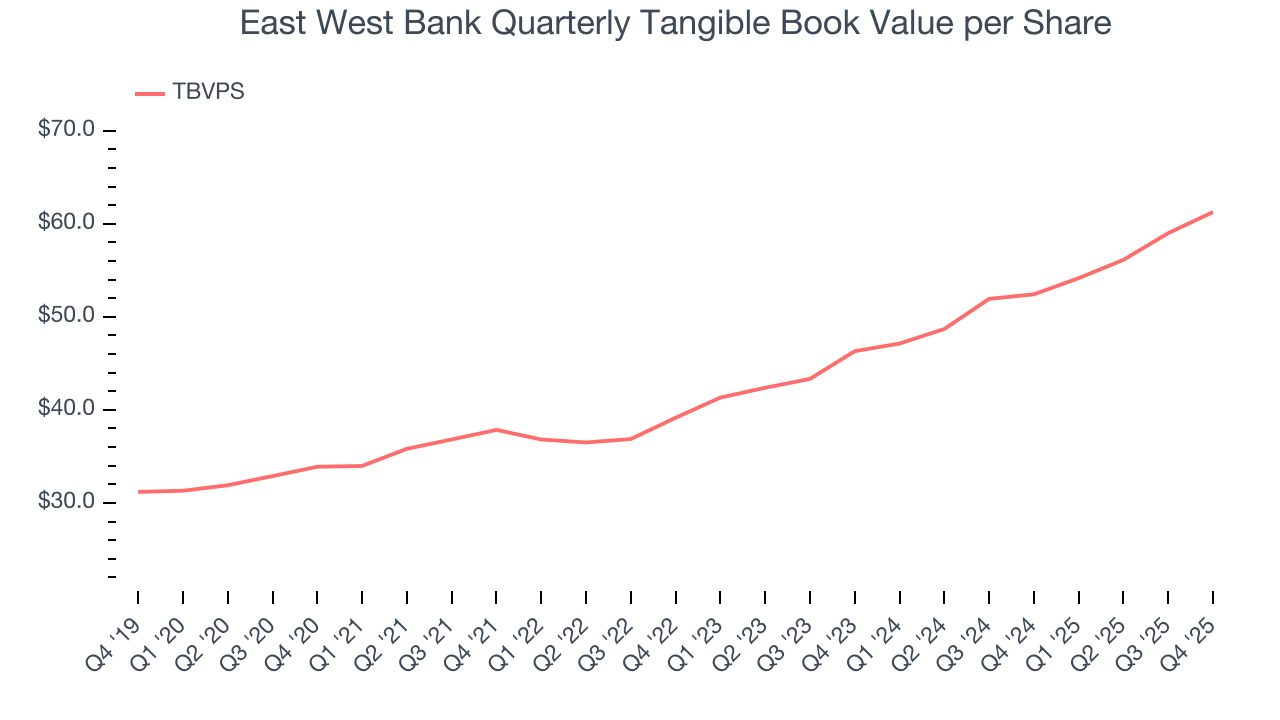
Over the next 12 months, Consensus estimates call for East West Bank’s TBVPS to grow by 12% to $68.65, mediocre growth rate.
9. Balance Sheet Assessment
Leverage is core to a financial firm’s business model (loans funded by deposits). To ensure economic stability and avoid a repeat of the 2008 GFC, regulators require certain levels of capital and liquidity, focusing on the Tier 1 capital ratio.
Tier 1 capital is the highest-quality capital that a firm holds, consisting primarily of common stock and retained earnings, but also physical gold. It serves as the primary cushion against losses and is the first line of defense in times of financial distress.
This capital is divided by risk-weighted assets to derive the Tier 1 capital ratio. Risk-weighted means that cash and US treasury securities are assigned little risk while unsecured consumer loans and equity investments get much higher risk weights, for example.
New regulation after the 2008 financial crisis requires that all firms must maintain a Tier 1 capital ratio greater than 4.5%. On top of this, there are additional buffers based on scale, risk profile, and other regulatory classifications, so that at the end of the day, firms generally must maintain a 7-10% ratio at minimum.
Over the last two years, East West Bank has averaged a Tier 1 capital ratio of 14.3%, which is considered safe and well capitalized in the event that macro or market conditions suddenly deteriorate.
10. Return on Equity
Return on equity (ROE) measures how effectively banks generate profit from each dollar of shareholder equity - a critical funding source. High-ROE institutions typically compound shareholder wealth faster over time through retained earnings, share repurchases, and dividend payments.
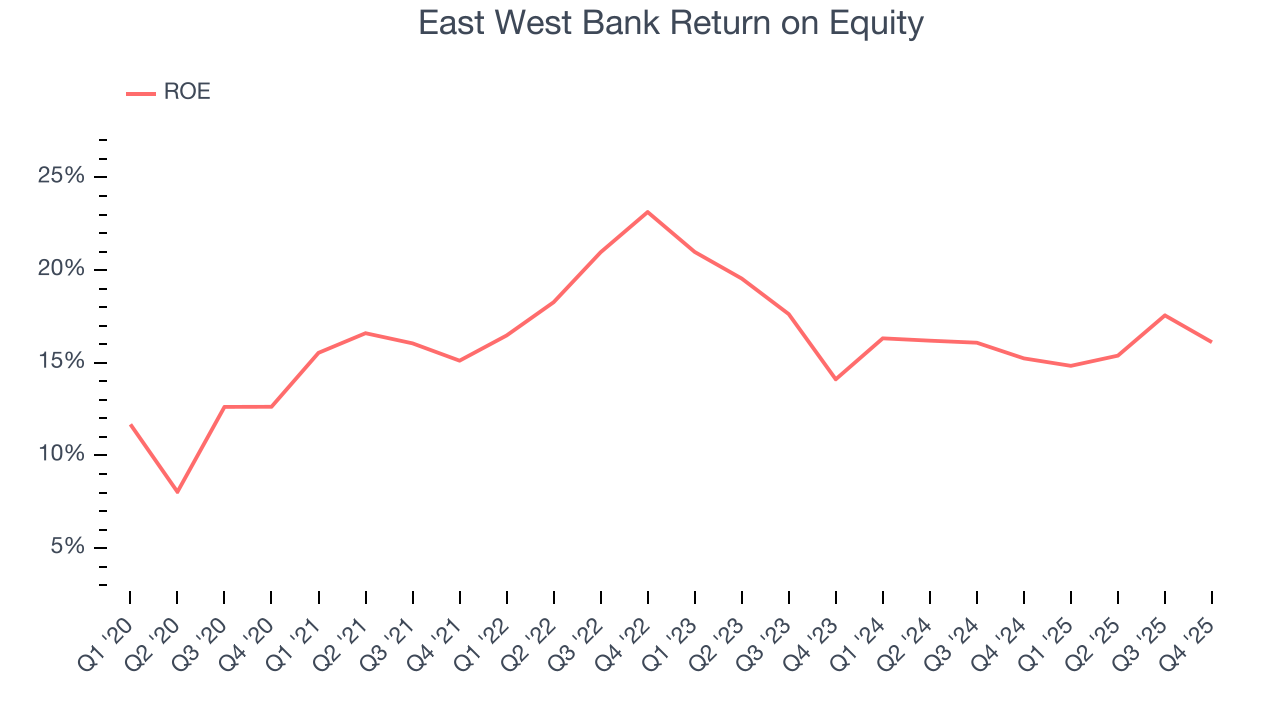
Over the last five years, East West Bank has averaged an ROE of 17.1%, excellent for a company operating in a sector where the average shakes out around 7.5% and those putting up 15%+ are greatly admired. This is a bright spot for East West Bank.
11. Key Takeaways from East West Bank’s Q4 Results
It was encouraging to see East West Bank beat analysts’ revenue expectations this quarter. We were also happy its net interest income narrowly outperformed Wall Street’s estimates. On the other hand, its EPS slightly beat. Zooming out, we think this was a mixed quarter. The stock remained flat at $115.88 immediately following the results.
12. Is Now The Time To Buy East West Bank?
Updated: March 16, 2026 at 1:08 AM EDT
Before deciding whether to buy East West Bank or pass, we urge investors to consider business quality, valuation, and the latest quarterly results.
There are some bright spots in East West Bank’s fundamentals, but its business quality ultimately falls short. To kick things off, its revenue growth was solid over the last five years. And while East West Bank’s declining net interest margin shows its loan book is becoming less profitable, its astounding EPS growth over the last five years shows its profits are trickling down to shareholders.
East West Bank’s P/B ratio based on the next 12 months is 1.5x. While this valuation is fair, the upside isn’t great compared to the potential downside. We're pretty confident there are more exciting stocks to buy at the moment.
Wall Street analysts have a consensus one-year price target of $133.20 on the company (compared to the current share price of $104.62).