Funko (FNKO)
Funko is up against the odds. Not only has its sales growth been weak but also its negative returns on capital show it destroyed value.― StockStory Analyst Team
1. News


2. Summary
Why We Think Funko Will Underperform
Boasting partnerships with media franchises like Marvel and One Piece, Funko (NASDAQ:FNKO) is a company specializing in creating and distributing licensed pop culture collectibles.
- Lackluster 6.8% annual revenue growth over the last five years indicates the company is losing ground to competitors
- Incremental sales over the last five years were much less profitable as its earnings per share fell by 31.6% annually while its revenue grew
- Short cash runway increases the probability of a capital raise that dilutes existing shareholders


Funko’s quality doesn’t meet our bar. We believe there are better opportunities elsewhere.


3. Funko (FNKO) Research Report: Q4 CY2025 Update
Pop culture collectibles manufacturer Funko (NASDAQ:FNKO) reported Q4 CY2025 results exceeding the market’s revenue expectations, but sales fell by 7% year on year to $273.1 million. Its non-GAAP profit of $0.05 per share was $0.02 above analysts’ consensus estimates.
Funko (FNKO) Q4 CY2025 Highlights:
- Revenue: $273.1 million vs analyst estimates of $260.7 million (7% year-on-year decline, 4.8% beat)
- Adjusted EPS: $0.05 vs analyst estimates of $0.04 ($0.02 beat)
- Adjusted EBITDA: $23.34 million vs analyst estimates of $23.53 million (8.5% margin, 0.8% miss)
- EBITDA guidance for the upcoming financial year 2026 is $75 million at the midpoint, below analyst estimates of $81.11 million
- Operating Margin: 2.2%, in line with the same quarter last year
- Free Cash Flow Margin: 7%, down from 16.1% in the same quarter last year
- Market Capitalization: $246.1 million
Company Overview
Boasting partnerships with media franchises like Marvel and One Piece, Funko (NASDAQ:FNKO) is a company specializing in creating and distributing licensed pop culture collectibles.
Funko was born from toy collector Mike Becker's desire to bring back low-tech, whimsically designed toys and collectibles from the past. Over time, Funko evolved from a nostalgia-focused concept to a leading pop culture product company, driven by its mission to connect fans with their favorite pop culture characters and stories.
Funko's core product line comprises collectibles like vinyl figures, bobbleheads, and plush items, underpinned by a wide array of licensing agreements with major entertainment companies. These products cater to the increasing demand for pop culture merchandise, tapping into fans’ desires to own physical representations of their favorite characters.
Revenue for Funko is generated through multiple channels, including specialty retailers, mass-market stores, and direct-to-consumer sales through its website. Its products appeal to a broad spectrum of consumers, from avid collectors and enthusiasts to casual fans.
4. Consumer Discretionary - Toys and Electronics
The Consumer Discretionary sector, by definition, is made up of companies selling non-essential goods and services. When economic conditions deteriorate or tastes shift, consumers can easily cut back or eliminate these purchases. For long-term investors with five-year holding periods, this creates a structural challenge: the sector is inherently hit-driven, with low switching costs and fickle customers. As a result, only a handful of companies can reliably grow demand and compound earnings over long periods, which is why our bar is high and High Quality ratings are rare.
Toys and electronic entertainment companies design and sell physical toys, board games, video game hardware, and related digital content, relying on intellectual property, licensed characters, and innovation to drive sales. Tailwinds include evergreen demand from children's demographics, growing adult-collector segments, and digital extensions that create new revenue streams from established franchises. Headwinds are considerable: demand is intensely seasonal (concentrated around holidays) making inventory planning risky. Children's attention is increasingly captured by screen-based entertainment and social media, reducing traditional toy engagement. Hit dependency on blockbuster franchises creates revenue volatility, while tariff exposure on imported goods and rising input costs compress margins.
5. Revenue Growth
Reviewing a company’s long-term sales performance reveals insights into its quality. Any business can put up a good quarter or two, but many enduring ones grow for years. Regrettably, Funko’s sales grew at a weak 6.8% compounded annual growth rate over the last five years. This fell short of our benchmark for the consumer discretionary sector and is a poor baseline for our analysis.
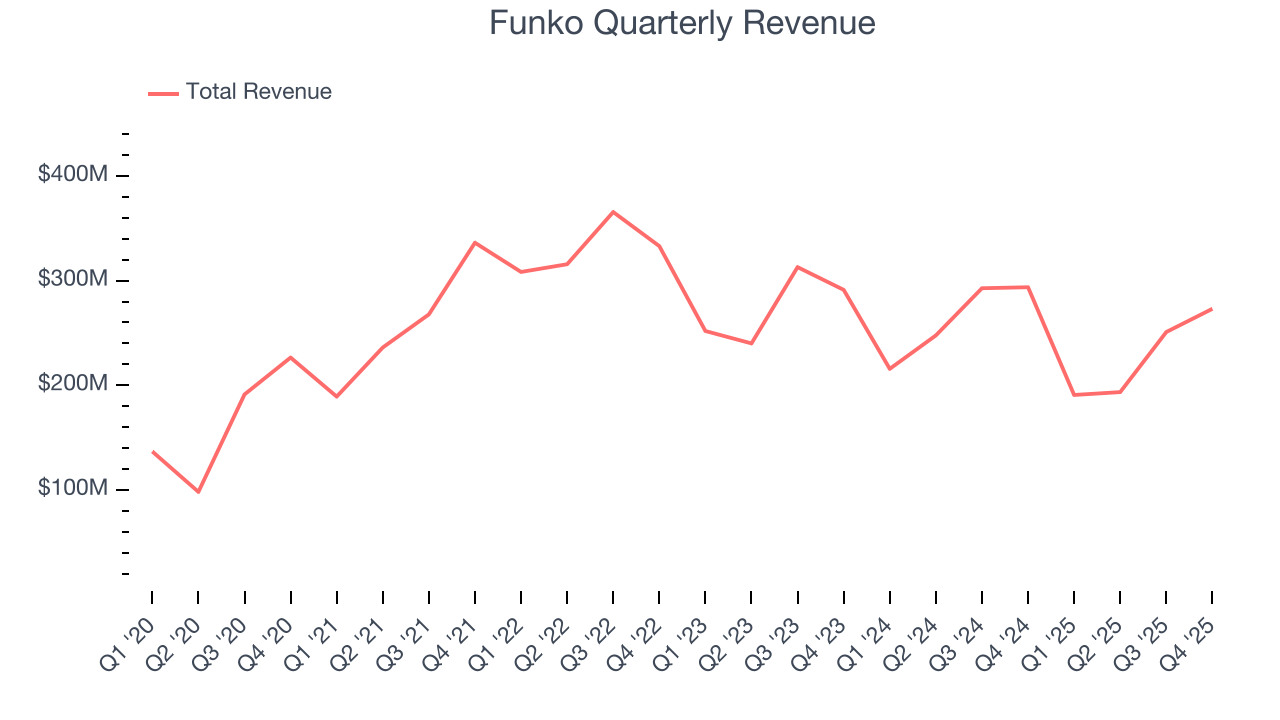
Long-term growth is the most important, but within consumer discretionary, product cycles are short and revenue can be hit-driven due to rapidly changing trends and consumer preferences. Funko’s performance shows it grew in the past but relinquished its gains over the last two years, as its revenue fell by 9% annually. 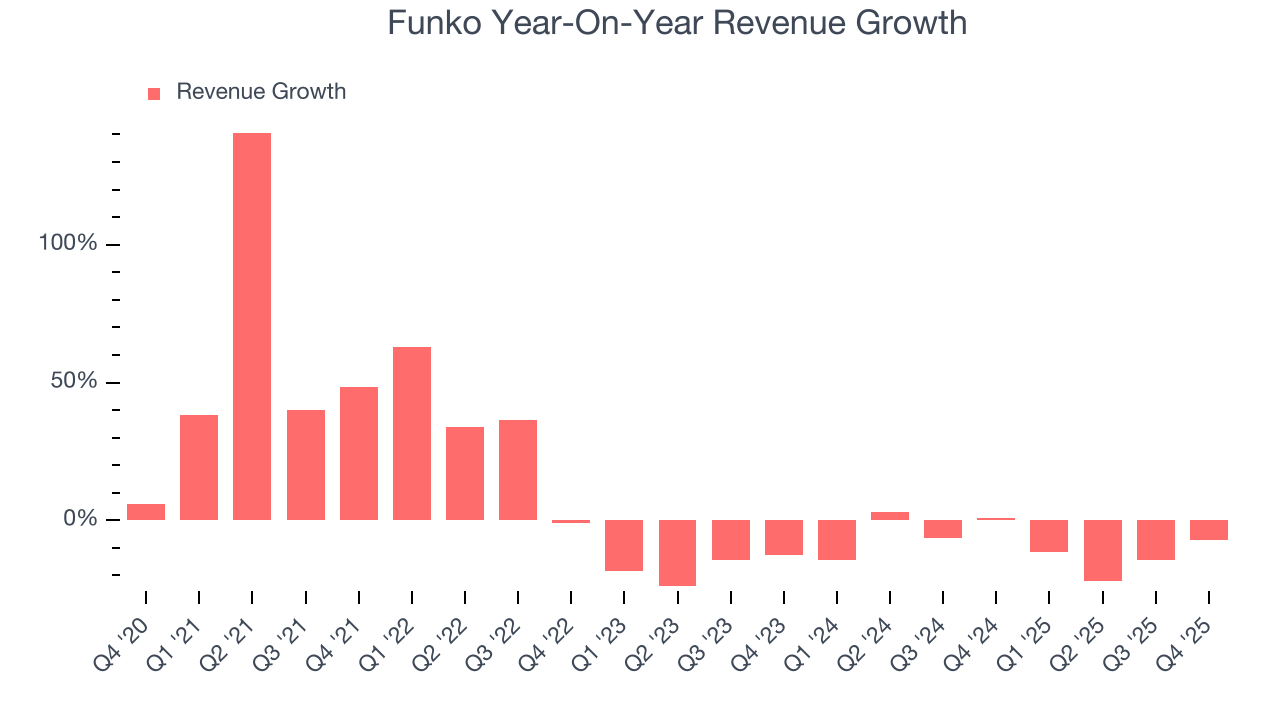
This quarter, Funko’s revenue fell by 7% year on year to $273.1 million but beat Wall Street’s estimates by 4.8%.
Looking ahead, sell-side analysts expect revenue to grow 9% over the next 12 months. While this projection suggests its newer products and services will spur better top-line performance, it is still below the sector average.
6. Operating Margin
Operating margin is a key measure of profitability. Think of it as net income - the bottom line - excluding the impact of taxes and interest on debt, which are less connected to business fundamentals.
Funko’s operating margin has shrunk over the last 12 months and averaged negative 1.7% over the last two years. Unprofitable consumer discretionary companies with falling margins deserve extra scrutiny because they’re spending loads of money to stay relevant, an unsustainable practice.
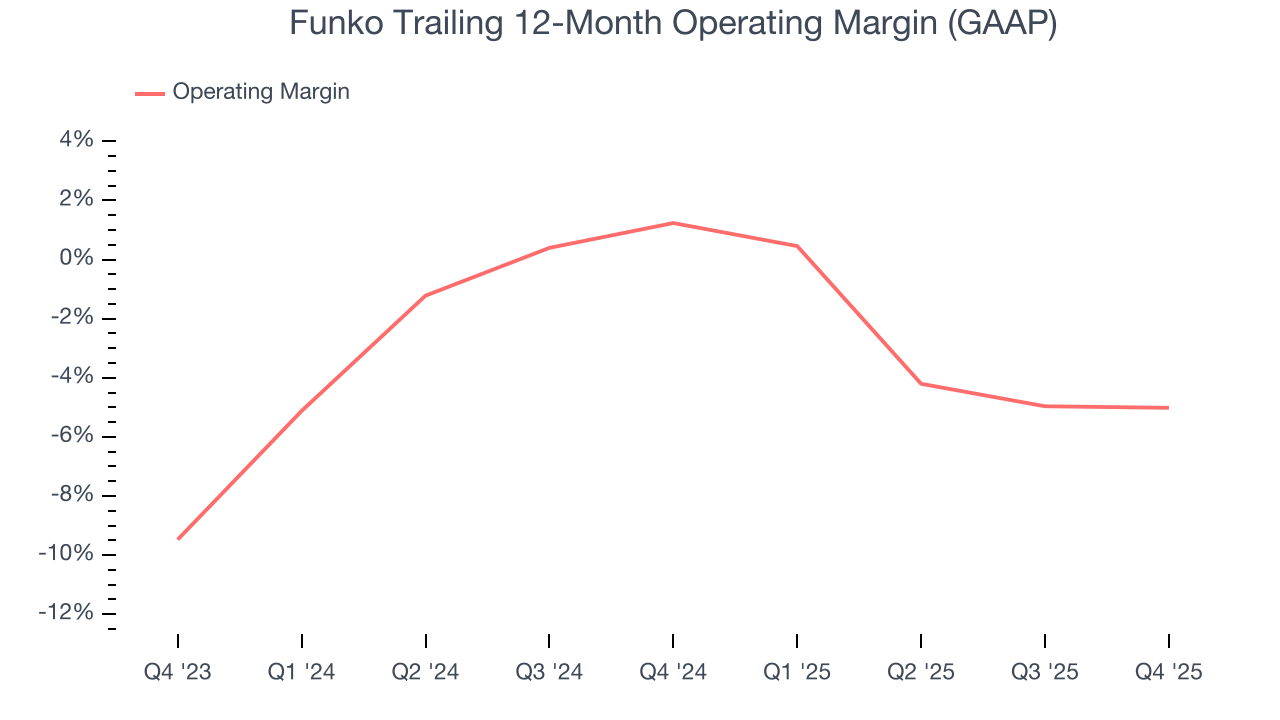
In Q4, Funko generated an operating margin profit margin of 2.2%, in line with the same quarter last year. This indicates the company’s overall cost structure has been relatively stable.
7. Earnings Per Share
We track the long-term change in earnings per share (EPS) for the same reason as long-term revenue growth. Compared to revenue, however, EPS highlights whether a company’s growth is profitable.
Sadly for Funko, its EPS declined by 31.6% annually over the last five years while its revenue grew by 6.8%. This tells us the company became less profitable on a per-share basis as it expanded.
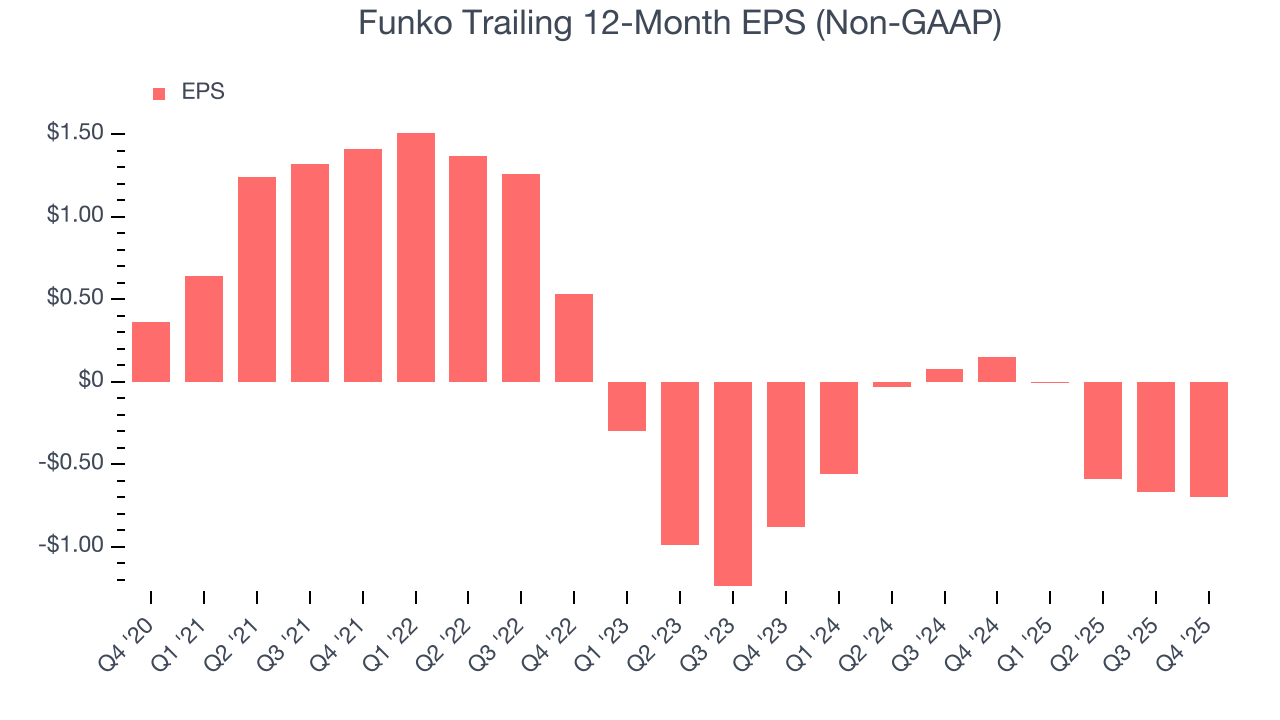
In Q4, Funko reported adjusted EPS of $0.05, down from $0.08 in the same quarter last year. Despite falling year on year, this print easily cleared analysts’ estimates. Over the next 12 months, Wall Street is optimistic. Analysts forecast Funko’s full-year EPS of negative $0.70 will flip to positive $0.10.
8. Cash Is King
Free cash flow isn't a prominently featured metric in company financials and earnings releases, but we think it's telling because it accounts for all operating and capital expenses, making it tough to manipulate. Cash is king.
Funko has shown poor cash profitability relative to peers over the last two years, giving the company fewer opportunities to return capital to shareholders. Its free cash flow margin averaged 2.8%, below what we’d expect for a consumer discretionary business.
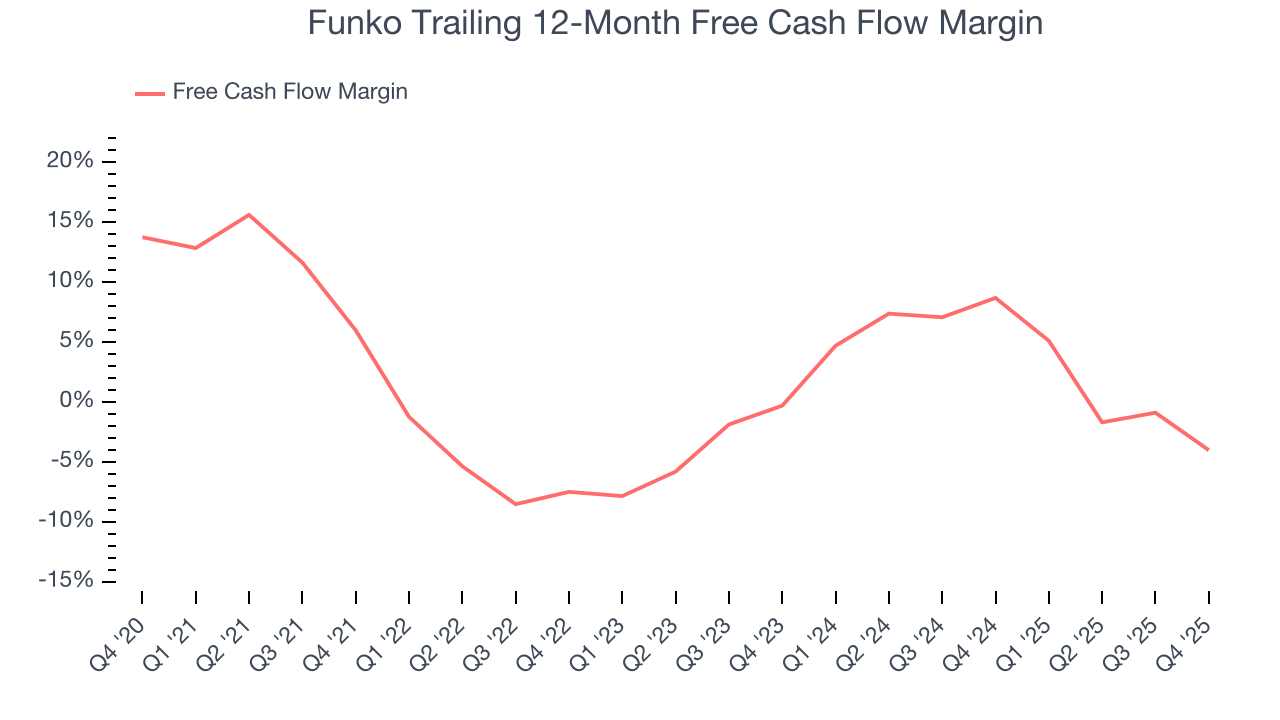
Funko’s free cash flow clocked in at $19.19 million in Q4, equivalent to a 7% margin. The company’s cash profitability regressed as it was 9.1 percentage points lower than in the same quarter last year, but it’s still above its two-year average. We wouldn’t read too much into this quarter’s decline because investment needs can be seasonal, leading to short-term swings. Long-term trends carry greater meaning.
9. Return on Invested Capital (ROIC)
EPS and free cash flow tell us whether a company was profitable while growing its revenue. But was it capital-efficient? A company’s ROIC explains this by showing how much operating profit it makes compared to the money it has raised (debt and equity).
Funko’s five-year average ROIC was negative 1.5%, meaning management lost money while trying to expand the business. Its returns were among the worst in the consumer discretionary sector.
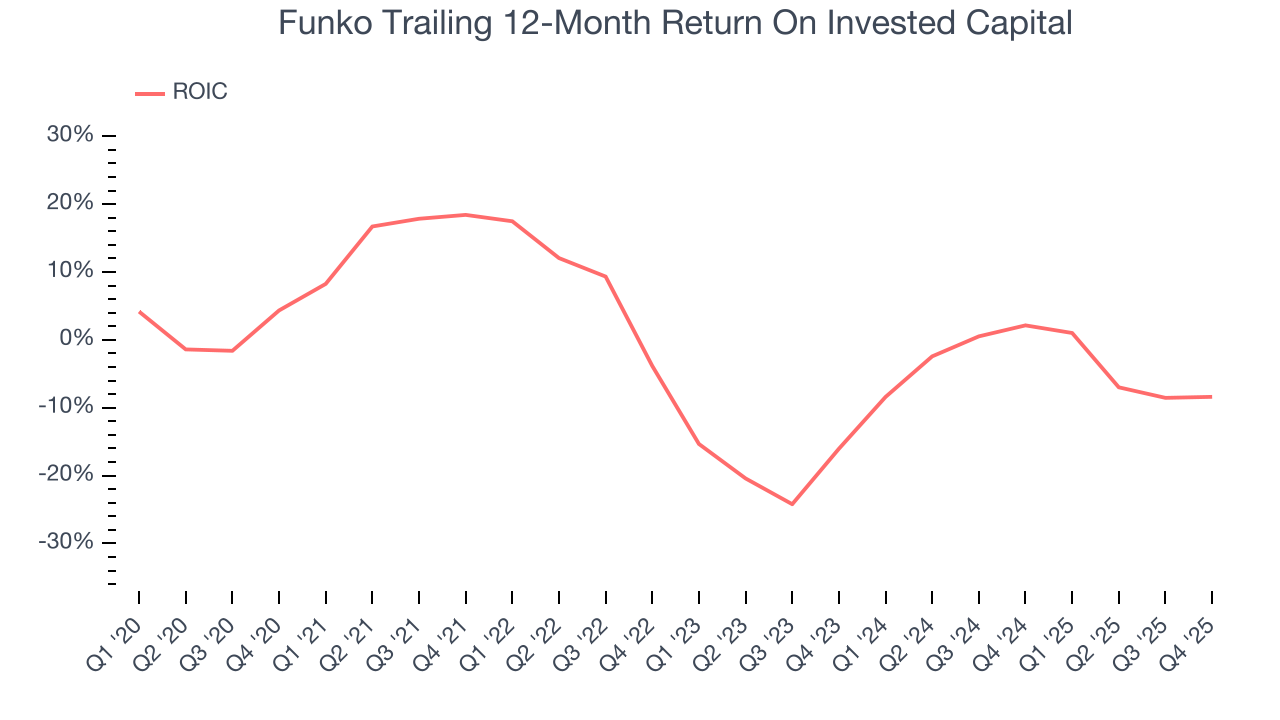
We like to invest in businesses with high returns, but the trend in a company’s ROIC is what often surprises the market and moves the stock price. Unfortunately, Funko’s ROIC has decreased significantly over the last few years. Paired with its already low returns, these declines suggest its profitable growth opportunities are few and far between.
10. Balance Sheet Risk
As long-term investors, the risk we care about most is the permanent loss of capital, which can happen when a company goes bankrupt or raises money from a disadvantaged position. This is separate from short-term stock price volatility, something we are much less bothered by.
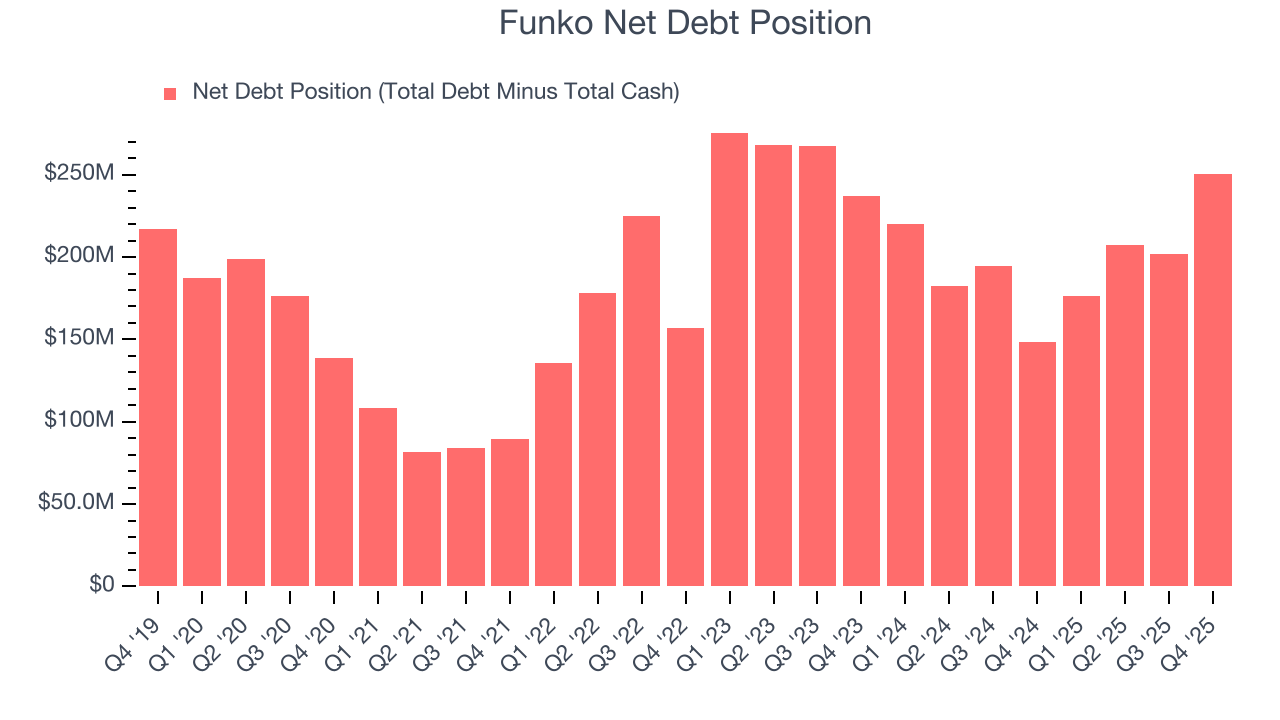
Funko burned through $36.45 million of cash over the last year, and its $292.8 million of debt exceeds the $42.15 million of cash on its balance sheet. This is a deal breaker for us because indebted loss-making companies spell trouble.
Unless the Funko’s fundamentals change quickly, it might find itself in a position where it must raise capital from investors to continue operating. Whether that would be favorable is unclear because dilution is a headwind for shareholder returns.
We remain cautious of Funko until it generates consistent free cash flow or any of its announced financing plans materialize on its balance sheet.
11. Key Takeaways from Funko’s Q4 Results
It was good to see Funko beat analysts’ EPS expectations this quarter. We were also glad its revenue outperformed Wall Street’s estimates. On the other hand, its full-year EBITDA guidance missed. Zooming out, we think this was a mixed quarter. The stock traded up 2.6% to $4.42 immediately following the results.
12. Is Now The Time To Buy Funko?
Updated: March 12, 2026 at 11:05 PM EDT
Are you wondering whether to buy Funko or pass? We urge investors to not only consider the latest earnings results but also longer-term business quality and valuation as well.
Funko doesn’t pass our quality test. While its projected EPS for the next year implies the company’s fundamentals will improve, the downside is its declining EPS over the last five years makes it a less attractive asset to the public markets. On top of that, its relatively low ROIC suggests management has struggled to find compelling investment opportunities.
Funko’s P/E ratio based on the next 12 months is 42.8x. While this valuation is fair, the upside isn’t great compared to the potential downside. There are better investments elsewhere.
Wall Street analysts have a consensus one-year price target of $4.25 on the company (compared to the current share price of $4.41).