
Fulton Financial (FULT)
Fulton Financial doesn’t excite us. Its sluggish sales growth shows demand is soft, a worrisome sign for investors in high-quality stocks.― StockStory Analyst Team
1. News


2. Summary
Why We Think Fulton Financial Will Underperform
Tracing its roots back to 1882 in the heart of Pennsylvania, Fulton Financial (NASDAQ:FULT) is a financial holding company that provides banking, lending, and wealth management services to consumers and businesses across five Mid-Atlantic states.
- Projected 2.5 percentage point efficiency ratio increase over the next year signals its day-to-day expenses will rise
- Projected tangible book value per share growth of 8.9% for the next 12 months suggests sluggish capital generation
- On the bright side, its non-interest operating profits increased over the last five years as the firm gained some leverage on its fixed costs and became more efficient


Fulton Financial falls short of our quality standards. We’re looking for better stocks elsewhere.
Why There Are Better Opportunities Than Fulton Financial


At $19.60 per share, Fulton Financial trades at 1x forward P/B. Fulton Financial’s multiple may seem like a great deal among banking peers, but we think there are valid reasons why it’s this cheap.
It’s better to pay up for high-quality businesses with higher long-term earnings potential rather than to buy lower-quality stocks because they appear cheap. These challenged businesses often don’t re-rate, a phenomenon known as a “value trap”.
3. Fulton Financial (FULT) Research Report: Q4 CY2025 Update
Regional banking company Fulton Financial (NASDAQ:FULT) met Wall Streets revenue expectations in Q4 CY2025, with sales up 3% year on year to $336 million. Its non-GAAP profit of $0.55 per share was 7.8% above analysts’ consensus estimates.
Fulton Financial (FULT) Q4 CY2025 Highlights:
- Net Interest Income: $266 million vs analyst estimates of $266.5 million (4.9% year-on-year growth, in line)
- Net Interest Margin: 3.6% vs analyst estimates of 3.5% (7.3 basis point beat)
- Revenue: $336 million vs analyst estimates of $335.7 million (3% year-on-year growth, in line)
- Efficiency Ratio: 60% vs analyst estimates of 58.9% (115 basis point miss)
- Adjusted EPS: $0.55 vs analyst estimates of $0.51 (7.8% beat)
- Market Capitalization: $3.55 billion
Company Overview
Tracing its roots back to 1882 in the heart of Pennsylvania, Fulton Financial (NASDAQ:FULT) is a financial holding company that provides banking, lending, and wealth management services to consumers and businesses across five Mid-Atlantic states.
Fulton Bank, the company's primary subsidiary, operates over 200 financial centers throughout Pennsylvania, Delaware, Maryland, New Jersey, and Virginia. The bank serves both consumers and businesses with a particular focus on small and medium-sized enterprises with annual revenues under $150 million.
For individual customers, Fulton offers standard retail banking products including checking and savings accounts, certificates of deposit, and various loan options. Its consumer lending portfolio includes home equity products, residential mortgages, automobile loans, personal loans, and student loans.
On the commercial side, Fulton provides business loans, commercial real estate financing, construction loans, equipment leasing, cash management services, and letters of credit. A business owner might use Fulton's services to secure financing for expanding their manufacturing facility, manage their company's cash flow, or finance the purchase of new equipment.
Fulton also maintains a wealth management division through Fulton Financial Advisors and Fulton Private Bank, offering investment management, trust services, brokerage, insurance, and financial advisory services to both individuals and businesses.
The company generates revenue primarily through interest income on loans and investment securities, as well as through fees from its various banking and wealth management services. Customers can access their accounts and conduct transactions through traditional branch visits, ATMs, telephone banking, or digital channels including online and mobile banking platforms.
4. Regional Banks
Regional banks, financial institutions operating within specific geographic areas, serve as intermediaries between local depositors and borrowers. They benefit from rising interest rates that improve net interest margins (the difference between loan yields and deposit costs), digital transformation reducing operational expenses, and local economic growth driving loan demand. However, these banks face headwinds from fintech competition, deposit outflows to higher-yielding alternatives, credit deterioration (increasing loan defaults) during economic slowdowns, and regulatory compliance costs. Recent concerns about regional bank stability following high-profile failures and significant commercial real estate exposure present additional challenges.
Fulton Financial competes with other regional banks operating in the Mid-Atlantic region, including M&T Bank (NYSE:MTB), PNC Financial Services (NYSE:PNC), Truist Financial (NYSE:TFC), and smaller community banks throughout its five-state footprint.
5. Sales Growth
Net interest income and and fee-based revenue are the two pillars supporting bank earnings. The former captures profit from the gap between lending rates and deposit costs, while the latter encompasses charges for banking services, credit products, wealth management, and trading activities. Over the last five years, Fulton Financial grew its revenue at a mediocre 8.6% compounded annual growth rate. This fell short of our benchmark for the banking sector and is a tough starting point for our analysis.
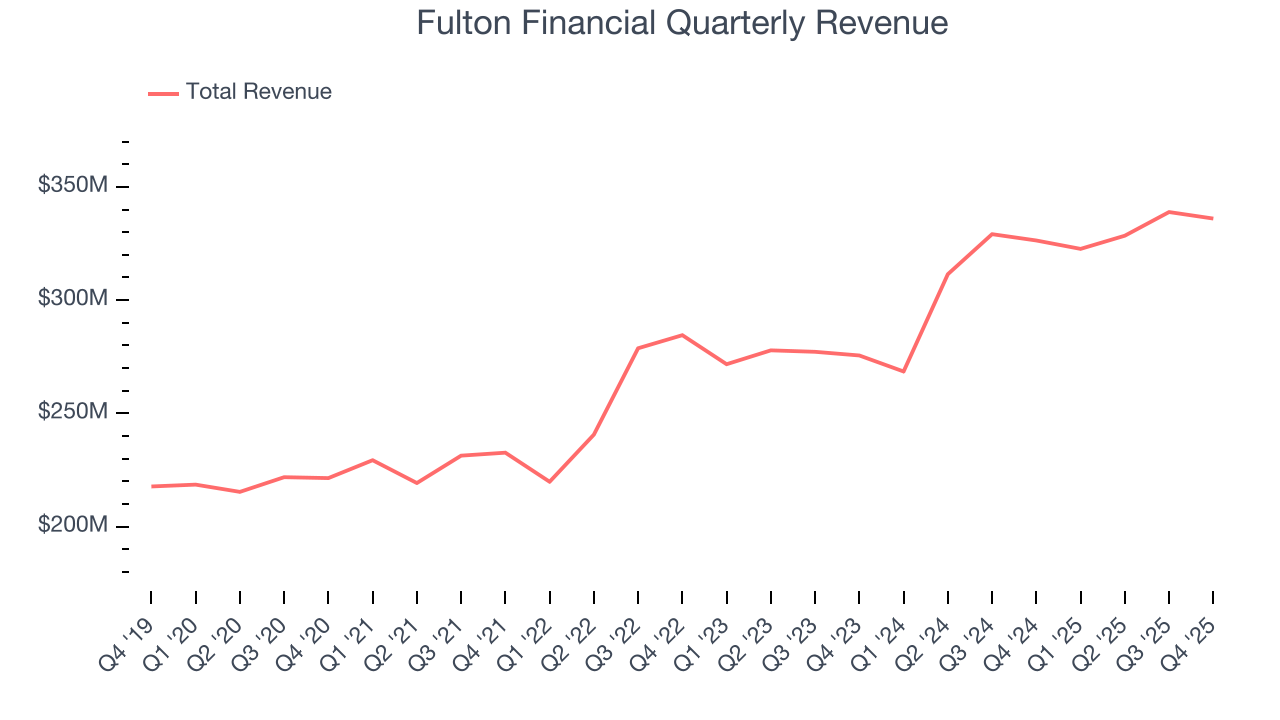
Long-term growth is the most important, but within financials, a half-decade historical view may miss recent interest rate changes and market returns. Fulton Financial’s annualized revenue growth of 9.7% over the last two years is above its five-year trend, but we were still disappointed by the results. 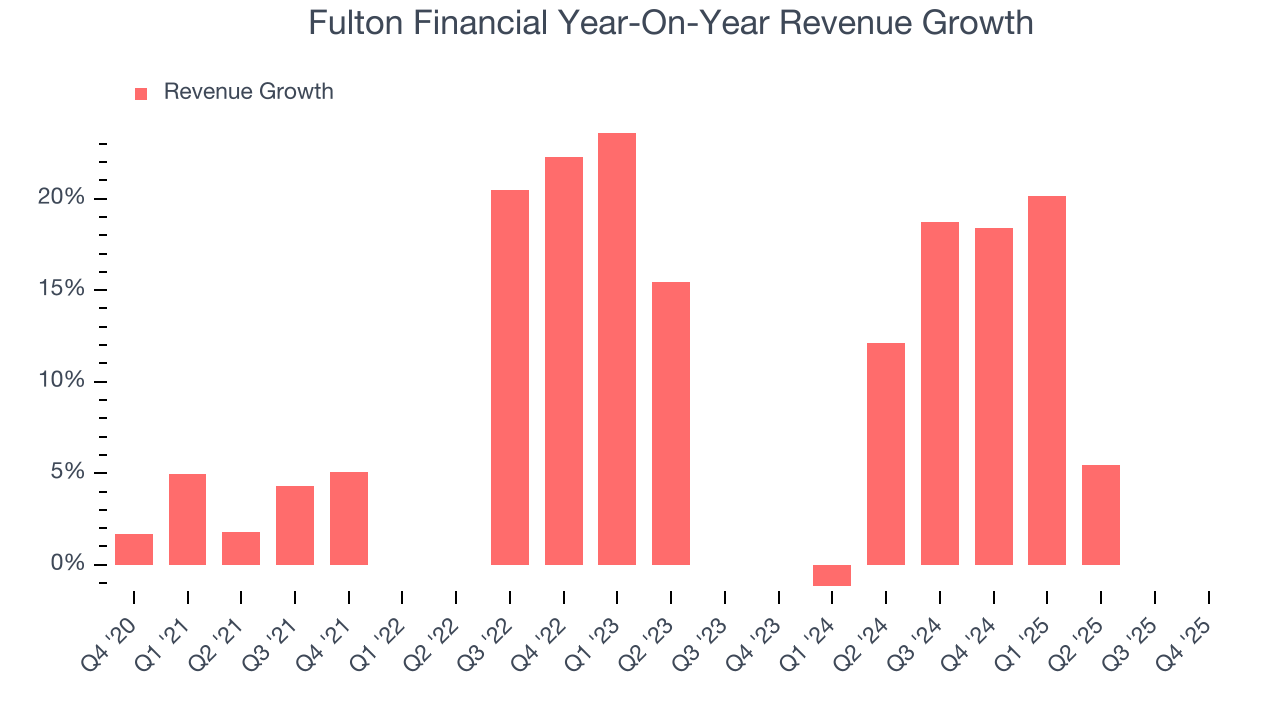 Note: Quarters not shown were determined to be outliers, impacted by outsized investment gains/losses that are not indicative of the recurring fundamentals of the business.
This quarter, Fulton Financial grew its revenue by 3% year on year, and its $336 million of revenue was in line with Wall Street’s estimates.
Net interest income made up 76.4% of the company’s total revenue during the last five years, meaning lending operations are Fulton Financial’s largest source of revenue.
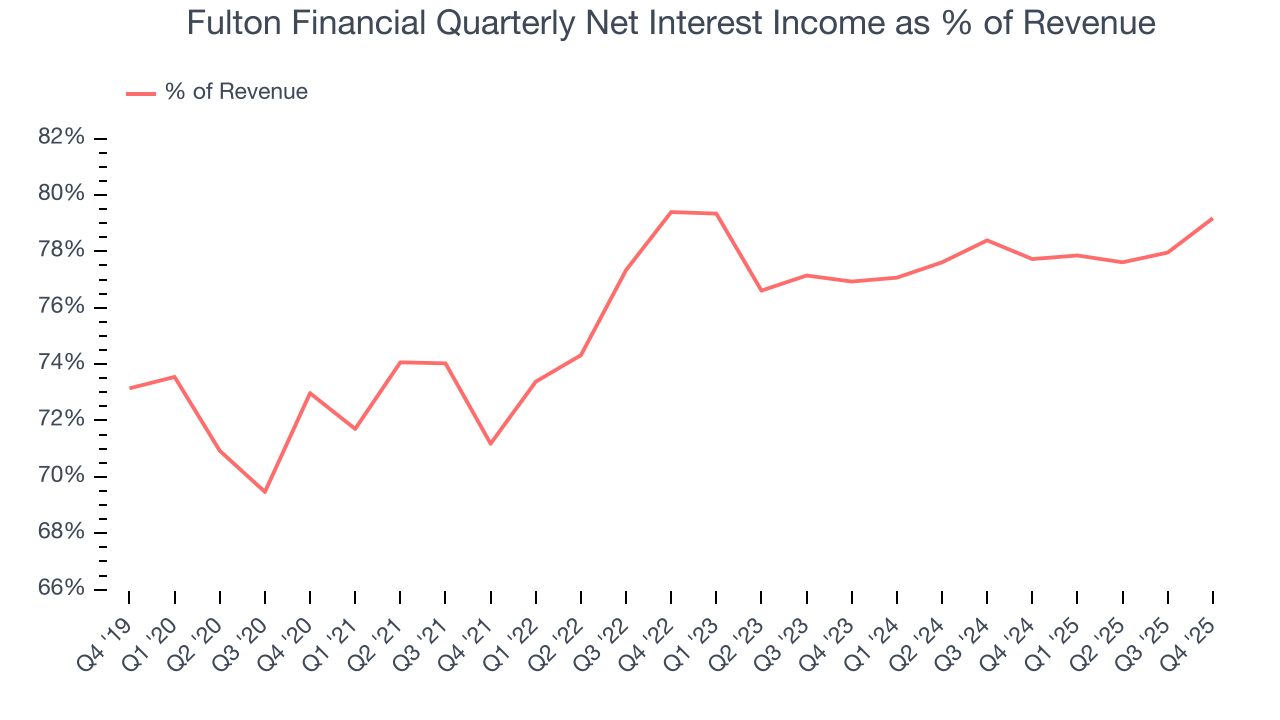
Markets consistently prioritize net interest income growth over fee-based revenue, recognizing its superior quality and recurring nature compared to the more unpredictable non-interest income streams.
6. Efficiency Ratio
Topline growth is certainly important, but the overall profitability of this growth matters for the bottom line. For banks, we look at efficiency ratio, which is non-interest expense (salaries, rent, IT, marketing, excluding interest paid out to depositors) as a percentage of total revenue.
Investors place greater emphasis on efficiency ratio movements than absolute values, understanding that expense structures reflect revenue mix variations. Lower ratios represent better operational performance since they show banks generating more revenue per dollar of expense.
Over the last five years, Fulton Financial’s efficiency ratio has swelled by 6.7 percentage points, going from 62.4% to 57.6%. Said differently, the company’s expenses have grown at a slower rate than revenue, which typically signals prudent management.
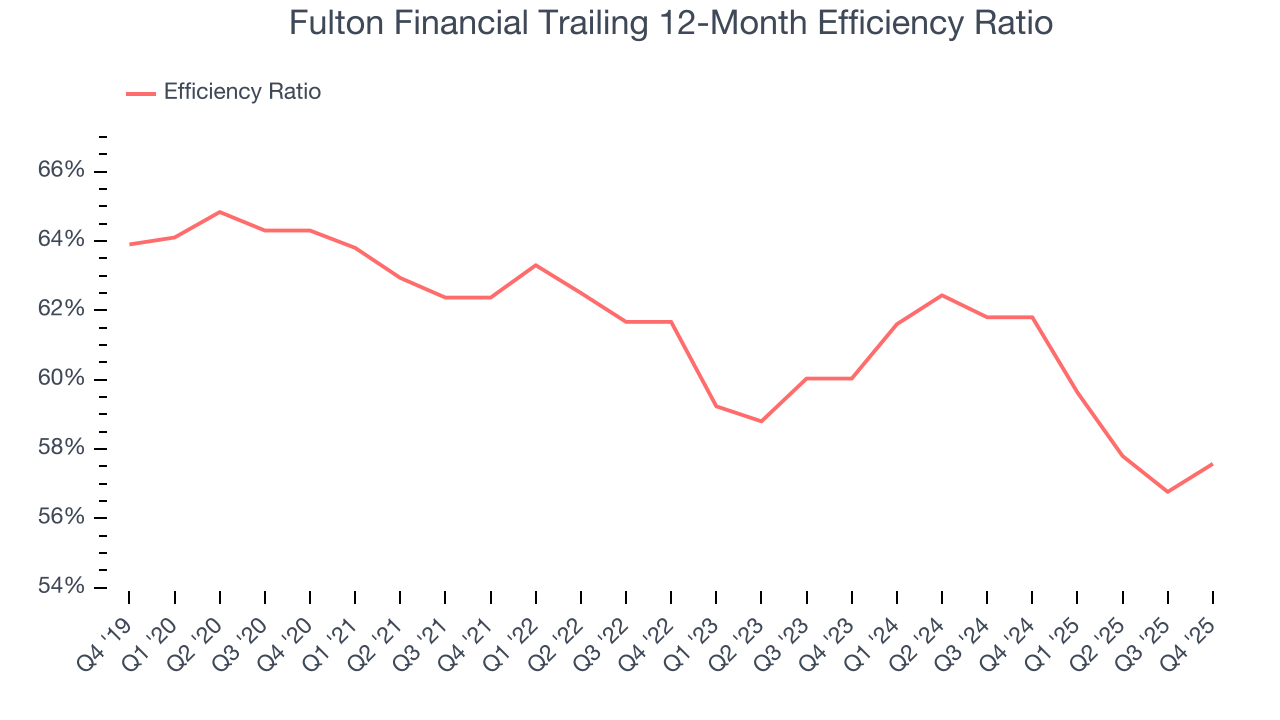
Fulton Financial’s efficiency ratio came in at 60% this quarter, falling short of analysts’ expectations by 115 basis points (100 basis points = 1 percentage point).
For the next 12 months, Wall Street expects Fulton Financial to become less profitable as it anticipates an efficiency ratio of 59.7%.
7. Earnings Per Share
We track the long-term change in earnings per share (EPS) for the same reason as long-term revenue growth. Compared to revenue, however, EPS highlights whether a company’s growth is profitable.
Fulton Financial’s EPS grew at a remarkable 13.3% compounded annual growth rate over the last five years, higher than its 8.6% annualized revenue growth. However, we take this with a grain of salt because its efficiency ratio didn’t improve and it didn’t repurchase its shares, meaning the delta came from factors we consider non-core or less sustainable over the long term.
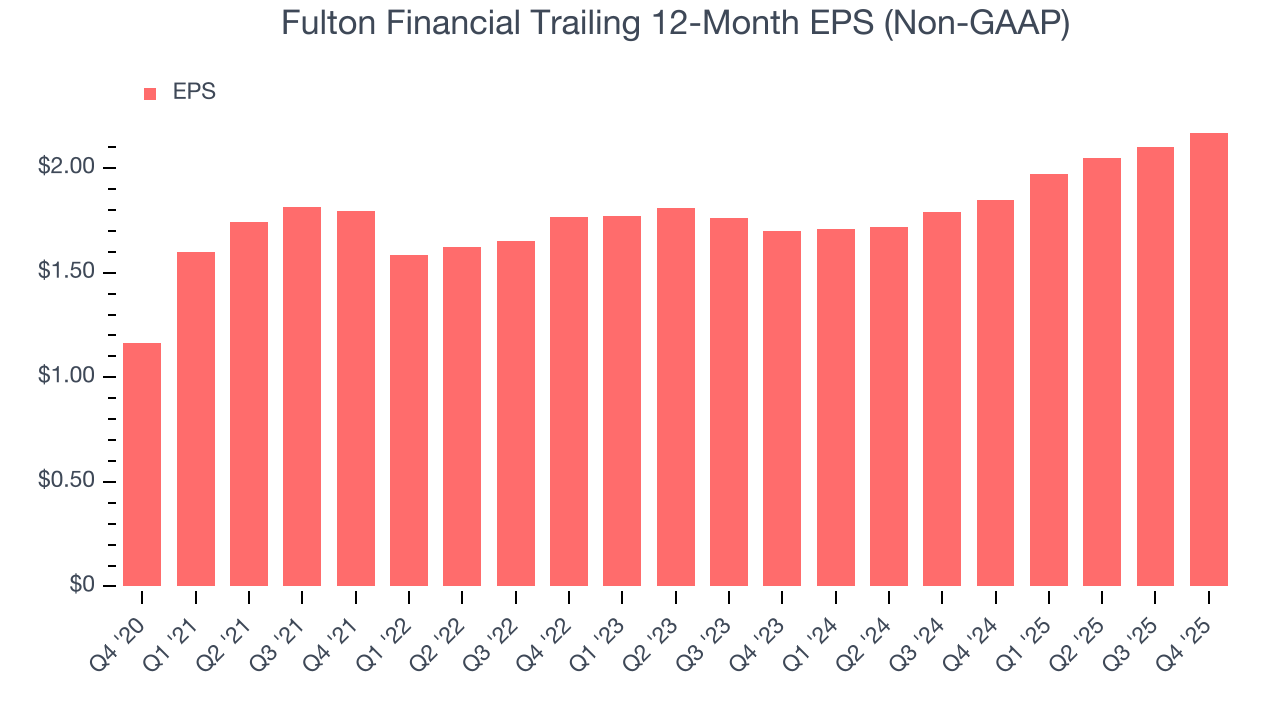
Like with revenue, we analyze EPS over a shorter period to see if we are missing a change in the business.
For Fulton Financial, its two-year annual EPS growth of 13% is similar to its five-year trend, implying stable earnings power.
In Q4, Fulton Financial reported adjusted EPS of $0.55, up from $0.48 in the same quarter last year. This print beat analysts’ estimates by 7.8%. Over the next 12 months, Wall Street expects Fulton Financial’s full-year EPS of $2.17 to shrink by 6.5%. This is unusual as its revenue and operating margin are anticipated to increase, signaling the fall likely stems from "below-the-line" items such as taxes.
8. Tangible Book Value Per Share (TBVPS)
Banks are balance sheet-driven businesses because they generate earnings primarily through borrowing and lending. They’re also valued based on their balance sheet strength and ability to compound book value (another name for shareholders’ equity) over time.
When analyzing banks, tangible book value per share (TBVPS) takes precedence over many other metrics. This measure isolates genuine per-share value by removing intangible assets of debatable liquidation worth. Traditional metrics like EPS are helpful but face distortion from M&A activity and loan loss accounting rules.
Fulton Financial’s TBVPS grew at a decent 5.1% annual clip over the last five years. TBVPS growth has accelerated recently, growing by 10.4% annually over the last two years from $12.25 to $14.92 per share.
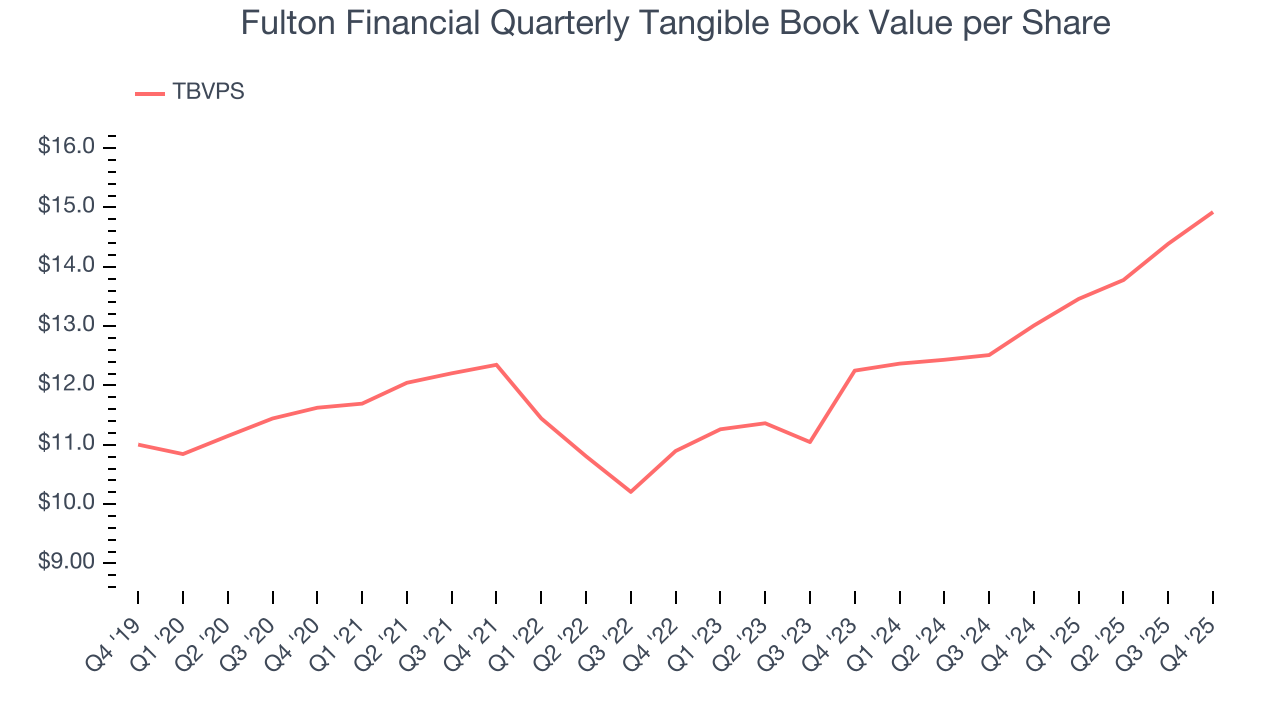
Over the next 12 months, Consensus estimates call for Fulton Financial’s TBVPS to grow by 6.7% to $15.92, lousy growth rate.
9. Balance Sheet Assessment
Leverage is core to a financial firm’s business model (loans funded by deposits). To ensure economic stability and avoid a repeat of the 2008 GFC, regulators require certain levels of capital and liquidity, focusing on the Tier 1 capital ratio.
Tier 1 capital is the highest-quality capital that a firm holds, consisting primarily of common stock and retained earnings, but also physical gold. It serves as the primary cushion against losses and is the first line of defense in times of financial distress.
This capital is divided by risk-weighted assets to derive the Tier 1 capital ratio. Risk-weighted means that cash and US treasury securities are assigned little risk while unsecured consumer loans and equity investments get much higher risk weights, for example.
New regulation after the 2008 financial crisis requires that all firms must maintain a Tier 1 capital ratio greater than 4.5%. On top of this, there are additional buffers based on scale, risk profile, and other regulatory classifications, so that at the end of the day, firms generally must maintain a 7-10% ratio at minimum.
Over the last two years, Fulton Financial has averaged a Tier 1 capital ratio of 11%, which is considered safe and well capitalized in the event that macro or market conditions suddenly deteriorate.
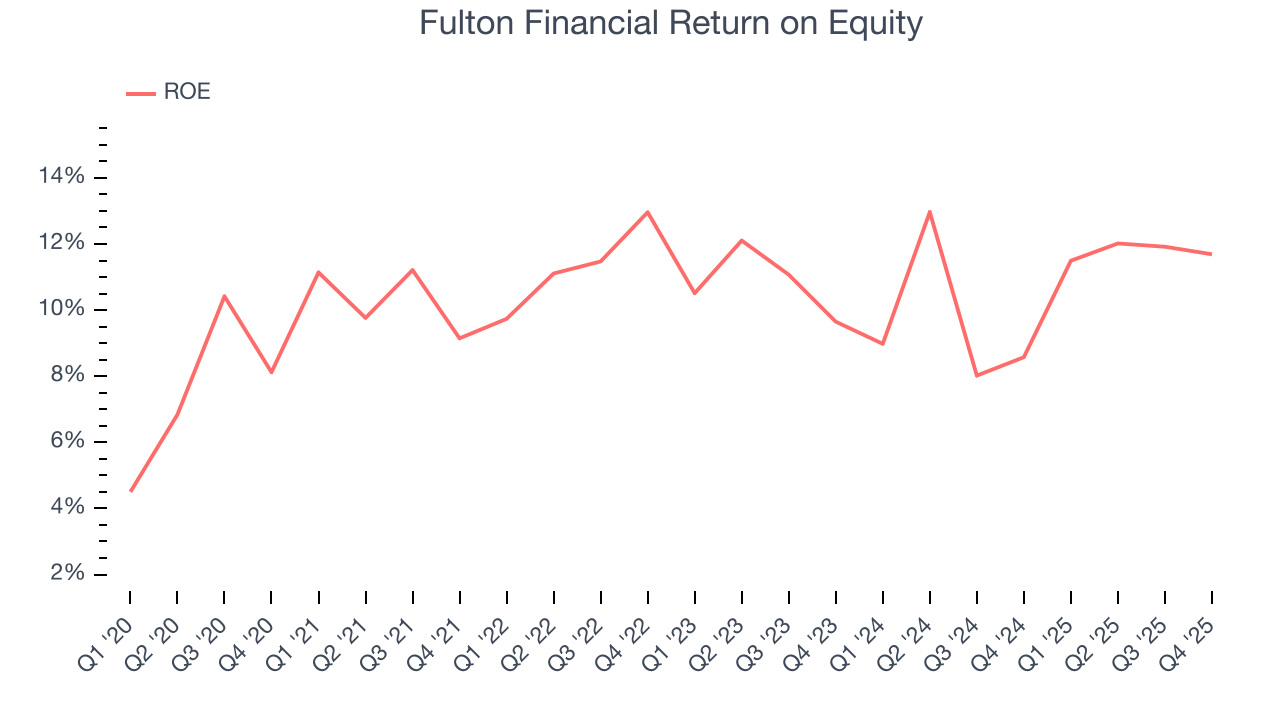
10. Return on Equity
Return on equity (ROE) measures how effectively banks generate profit from each dollar of shareholder equity - a critical funding source. High-ROE institutions typically compound shareholder wealth faster over time through retained earnings, share repurchases, and dividend payments.
Over the last five years, Fulton Financial has averaged an ROE of 10.8%, respectable for a company operating in a sector where the average shakes out around 7.5% and those putting up 15%+ are greatly admired.
11. Key Takeaways from Fulton Financial’s Q4 Results
It was good to see Fulton Financial beat analysts’ EPS expectations this quarter. Zooming out, we think this was a decent quarter. The stock traded up 1.7% to $20.86 immediately after reporting.
12. Is Now The Time To Buy Fulton Financial?
Updated: March 18, 2026 at 12:50 AM EDT
We think that the latest earnings result is only one piece of the bigger puzzle. If you’re deciding whether to own Fulton Financial, you should also grasp the company’s longer-term business quality and valuation.
Fulton Financial isn’t a terrible business, but it isn’t one of our picks. To kick things off, its revenue growth was mediocre over the last five years, and analysts expect its demand to deteriorate over the next 12 months. While its improving efficiency ratio shows the business has become more productive, the downside is its projected EPS for the next year is lacking. On top of that, its anticipated efficiency ratio over the next year signals its day-to-day expenses will rise.
Fulton Financial’s P/B ratio based on the next 12 months is 1x. This valuation is reasonable, but the company’s shakier fundamentals present too much downside risk. We're fairly confident there are better investments elsewhere.
Wall Street analysts have a consensus one-year price target of $23.25 on the company (compared to the current share price of $19.60).
Although the price target is bullish, readers should exercise caution because analysts tend to be overly optimistic. The firms they work for, often big banks, have relationships with companies that extend into fundraising, M&A advisory, and other rewarding business lines. As a result, they typically hesitate to say bad things for fear they will lose out. We at StockStory do not suffer from such conflicts of interest, so we’ll always tell it like it is.