
Garrett Motion (GTX)
We’re not sold on Garrett Motion. Its weak revenue growth and gross margin show it not only lacks demand but also decent unit economics.― StockStory Analyst Team
1. News


2. Summary
Why Garrett Motion Is Not Exciting
A key player in the transition to cleaner vehicles, Garrett Motion (NYSE:GTX) designs and manufactures turbochargers, air compressors, and electric motor technologies for vehicle manufacturers and industrial applications.
- Gross margin of 19.8% is below its competitors, leaving less money to invest in areas like marketing and R&D
- Anticipated sales growth of 3.3% for the next year implies demand will be shaky
- A bright spot is that its industry-leading 64.2% return on capital demonstrates management’s skill in finding high-return investments, and its rising returns show it’s making even more lucrative bets


Garrett Motion doesn’t meet our quality criteria. We’re looking for better stocks elsewhere.
Why There Are Better Opportunities Than Garrett Motion


Garrett Motion’s stock price of $18.44 implies a valuation ratio of 10x forward P/E. This certainly seems like a cheap stock, but we think there are valid reasons why it trades this way.
Our advice is to pay up for elite businesses whose advantages are tailwinds to earnings growth. Don’t get sucked into lower-quality businesses just because they seem like bargains. These mediocre businesses often never achieve a higher multiple as hoped, a phenomenon known as a “value trap”.
3. Garrett Motion (GTX) Research Report: Q4 CY2025 Update
Turbocharger technology company Garrett Motion (NYSE:GTX) reported Q4 CY2025 results beating Wall Street’s revenue expectations, with sales up 5.6% year on year to $891 million. The company expects the full year’s revenue to be around $3.7 billion, close to analysts’ estimates. Its GAAP profit of $0.42 per share was 18.6% above analysts’ consensus estimates.
Garrett Motion (GTX) Q4 CY2025 Highlights:
- Revenue: $891 million vs analyst estimates of $875.2 million (5.6% year-on-year growth, 1.8% beat)
- EPS (GAAP): $0.42 vs analyst estimates of $0.35 (18.6% beat)
- Adjusted EBITDA: $159 million vs analyst estimates of $156.6 million (17.8% margin, 1.6% beat)
- EBITDA guidance for the upcoming financial year 2026 is $672 million at the midpoint, in line with analyst expectations
- Operating Margin: 11.6%, down from 15.3% in the same quarter last year
- Free Cash Flow Margin: 8.8%, down from 12.9% in the same quarter last year
- Market Capitalization: $4.00 billion
Company Overview
A key player in the transition to cleaner vehicles, Garrett Motion (NYSE:GTX) designs and manufactures turbochargers, air compressors, and electric motor technologies for vehicle manufacturers and industrial applications.
The company's core business revolves around turbochargers that enhance engine performance while reducing emissions for both gasoline and diesel engines. These technologies are crucial for automakers striving to meet increasingly stringent environmental regulations while maintaining vehicle performance. Garrett's product portfolio has evolved beyond traditional turbochargers to include electric boosting systems for hybrid vehicles and specialized compressors for hydrogen fuel cell vehicles.
Garrett serves a global customer base of automotive manufacturers including BMW and Ford, who rely on its components to improve fuel economy and reduce carbon emissions. For example, an SUV manufacturer might use Garrett's variable geometry turbochargers to maintain power output while downsizing engine displacement, resulting in better fuel efficiency without sacrificing performance.
The company generates revenue primarily through direct sales to original equipment manufacturers (OEMs), with additional income from its aftermarket business serving the replacement parts market through a network of distributors. Garrett is investing heavily in electrification technologies, focusing more than half of its R&D budget on solutions for hybrid and electric vehicles, including components for thermal management and electric powertrains that leverage its expertise in high-speed motors and power electronics.
4. Electrical Systems
Like many equipment and component manufacturers, electrical systems companies are buoyed by secular trends such as connectivity and industrial automation. More specific pockets of strong demand include Internet of Things (IoT) connectivity and the 5G telecom upgrade cycle, which can benefit companies whose cables and conduits fit those needs. But like the broader industrials sector, these companies are also at the whim of economic cycles. Interest rates, for example, can greatly impact projects that drive demand for these products.
Garrett Motion competes with other turbocharger and automotive technology suppliers such as BorgWarner (NYSE:BWA), Mitsubishi Heavy Industries (TYO:7011), IHI Corporation (TYO:7013), and Continental AG (ETR:CON), particularly in the growing electric vehicle and hydrogen fuel cell components markets.
5. Revenue Growth
Reviewing a company’s long-term sales performance reveals insights into its quality. Even a bad business can shine for one or two quarters, but a top-tier one grows for years. Unfortunately, Garrett Motion’s 3.4% annualized revenue growth over the last five years was sluggish. This fell short of our benchmark for the industrials sector and is a rough starting point for our analysis.
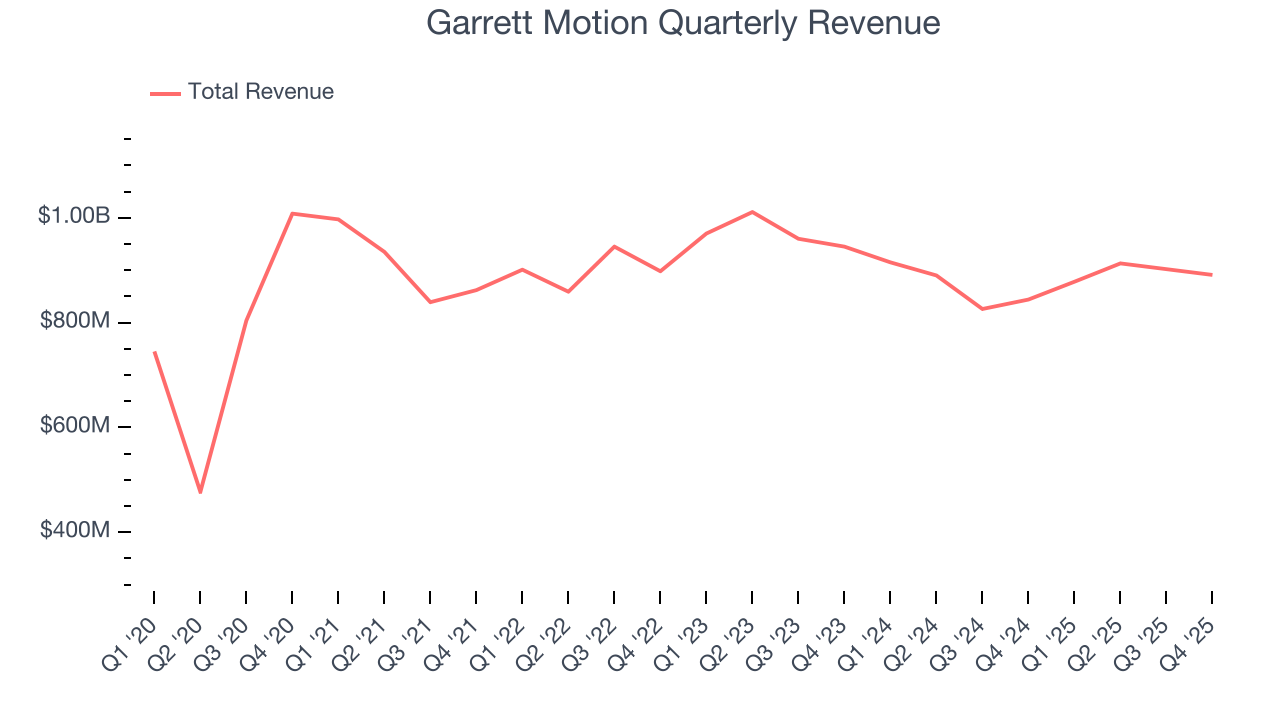
We at StockStory place the most emphasis on long-term growth, but within industrials, a half-decade historical view may miss cycles, industry trends, or a company capitalizing on catalysts such as a new contract win or a successful product line. Garrett Motion’s performance shows it grew in the past but relinquished its gains over the last two years, as its revenue fell by 4% annually. 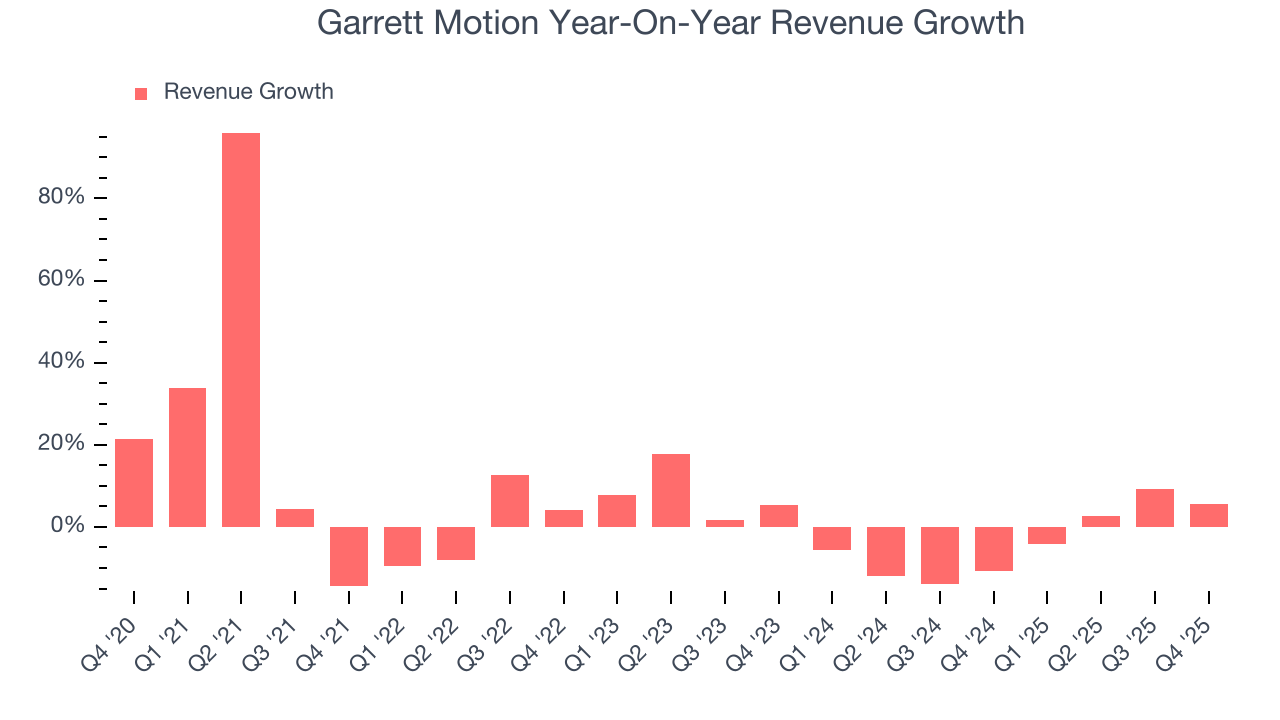
This quarter, Garrett Motion reported year-on-year revenue growth of 5.6%, and its $891 million of revenue exceeded Wall Street’s estimates by 1.8%.
Looking ahead, sell-side analysts expect revenue to grow 1.3% over the next 12 months. While this projection implies its newer products and services will spur better top-line performance, it is still below the sector average.
6. Gross Margin & Pricing Power
For industrials businesses, cost of sales is usually comprised of the direct labor, raw materials, and supplies needed to offer a product or service. These costs can be impacted by inflation and supply chain dynamics in the short term and a company’s purchasing power and scale over the long term.
Garrett Motion has bad unit economics for an industrials business, signaling it operates in a competitive market. As you can see below, it averaged a 19.8% gross margin over the last five years. Said differently, Garrett Motion had to pay a chunky $80.21 to its suppliers for every $100 in revenue. 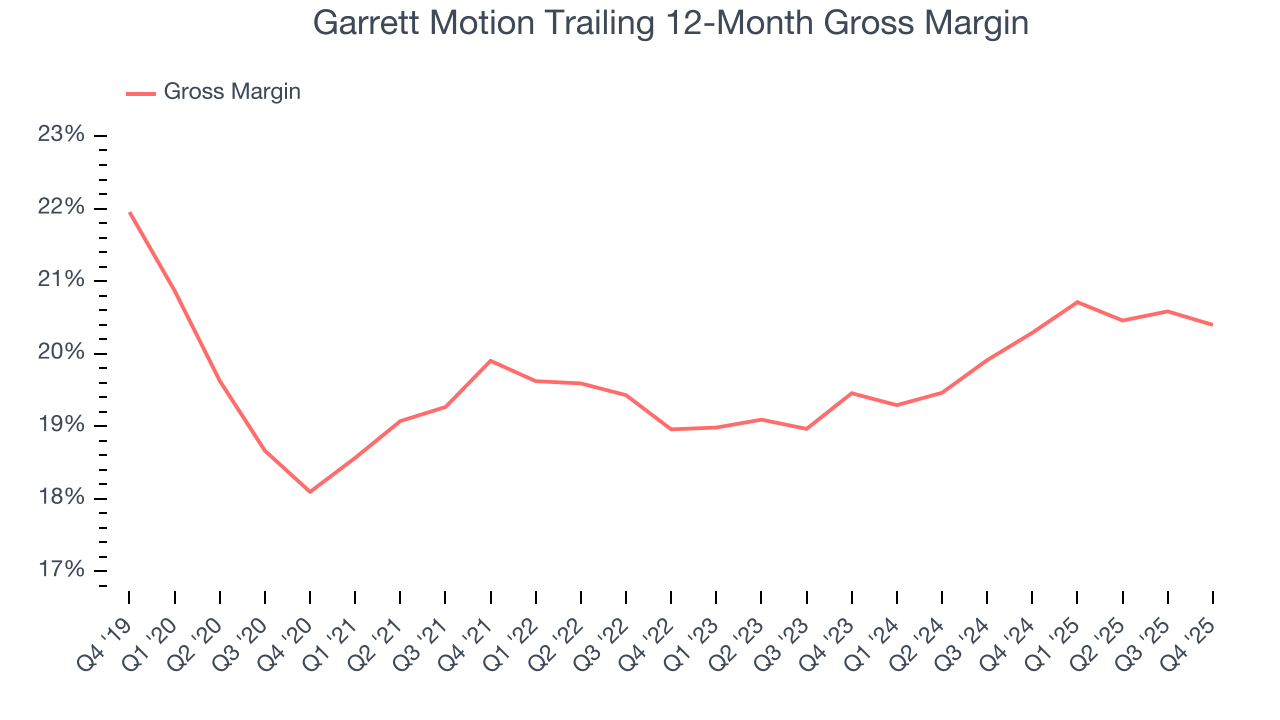
This quarter, Garrett Motion’s gross profit margin was 20.8%, in line with the same quarter last year. On a wider time horizon, the company’s full-year margin has remained steady over the past four quarters, suggesting its input costs (such as raw materials and manufacturing expenses) have been stable and it isn’t under pressure to lower prices.
7. Operating Margin
Garrett Motion has been an efficient company over the last five years. It was one of the more profitable businesses in the industrials sector, boasting an average operating margin of 13.7%. This result was particularly impressive because of its low gross margin, which is mostly a factor of what it sells and takes huge shifts to move meaningfully. Companies have more control over their operating margins, and it’s a show of well-managed operations if they’re high when gross margins are low.
Analyzing the trend in its profitability, Garrett Motion’s operating margin decreased by 1.1 percentage points over the last five years. This raises questions about the company’s expense base because its revenue growth should have given it leverage on its fixed costs, resulting in better economies of scale and profitability.
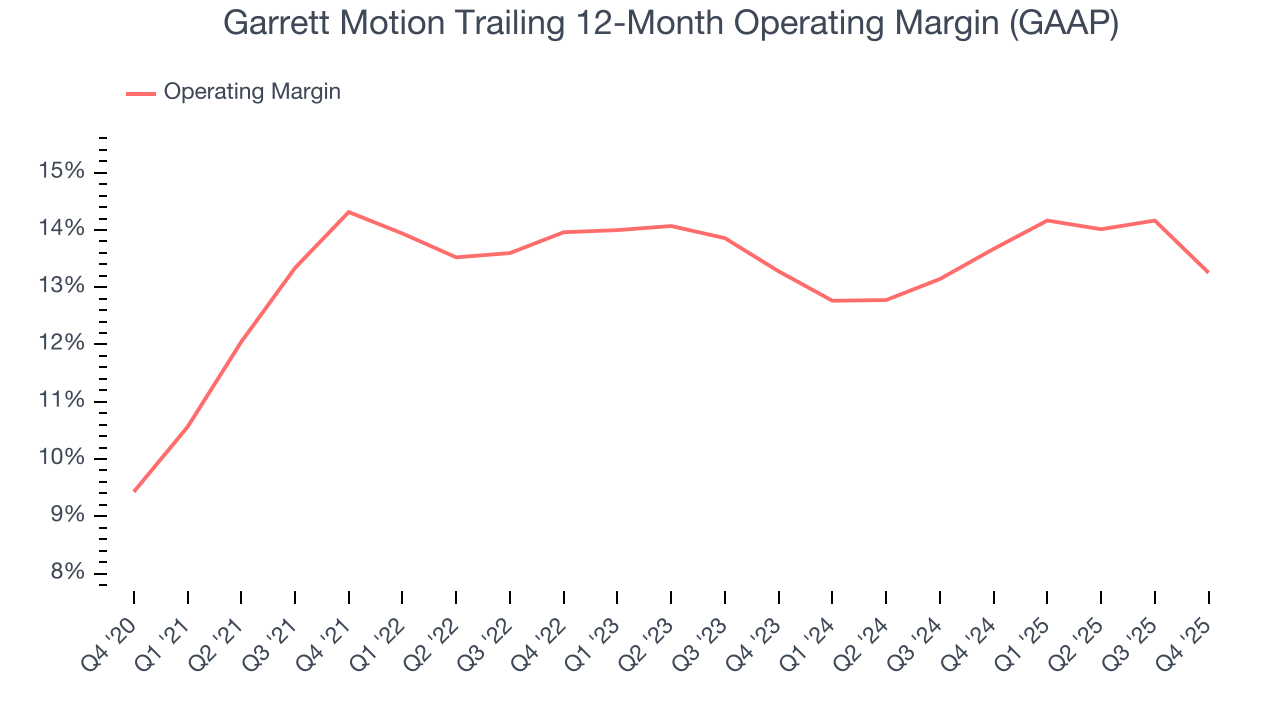
In Q4, Garrett Motion generated an operating margin profit margin of 11.6%, down 3.7 percentage points year on year. Since Garrett Motion’s operating margin decreased more than its gross margin, we can assume it was less efficient because expenses such as marketing, R&D, and administrative overhead increased.
8. Earnings Per Share
Revenue trends explain a company’s historical growth, but the long-term change in earnings per share (EPS) points to the profitability of that growth – for example, a company could inflate its sales through excessive spending on advertising and promotions.
Garrett Motion’s unimpressive 5.2% annual EPS growth over the last five years aligns with its revenue performance. On the bright side, this tells us its incremental sales were profitable.
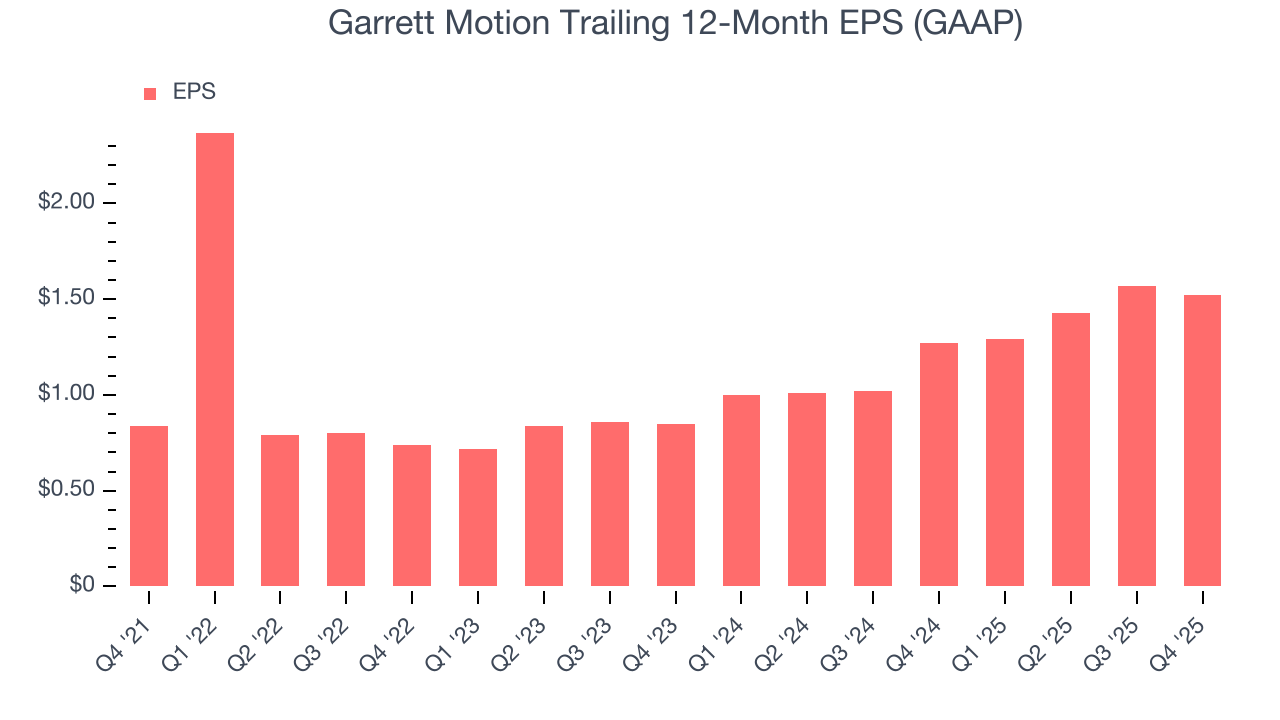
Like with revenue, we analyze EPS over a more recent period because it can provide insight into an emerging theme or development for the business.
Garrett Motion’s two-year annual EPS growth of 33.8% was fantastic and topped its two-year revenue performance.
Diving into Garrett Motion’s quality of earnings can give us a better understanding of its performance. A two-year view shows that Garrett Motion has repurchased its stock, shrinking its share count by 18.5%. This tells us its EPS outperformed its revenue not because of increased operational efficiency but financial engineering, as buybacks boost per share earnings. 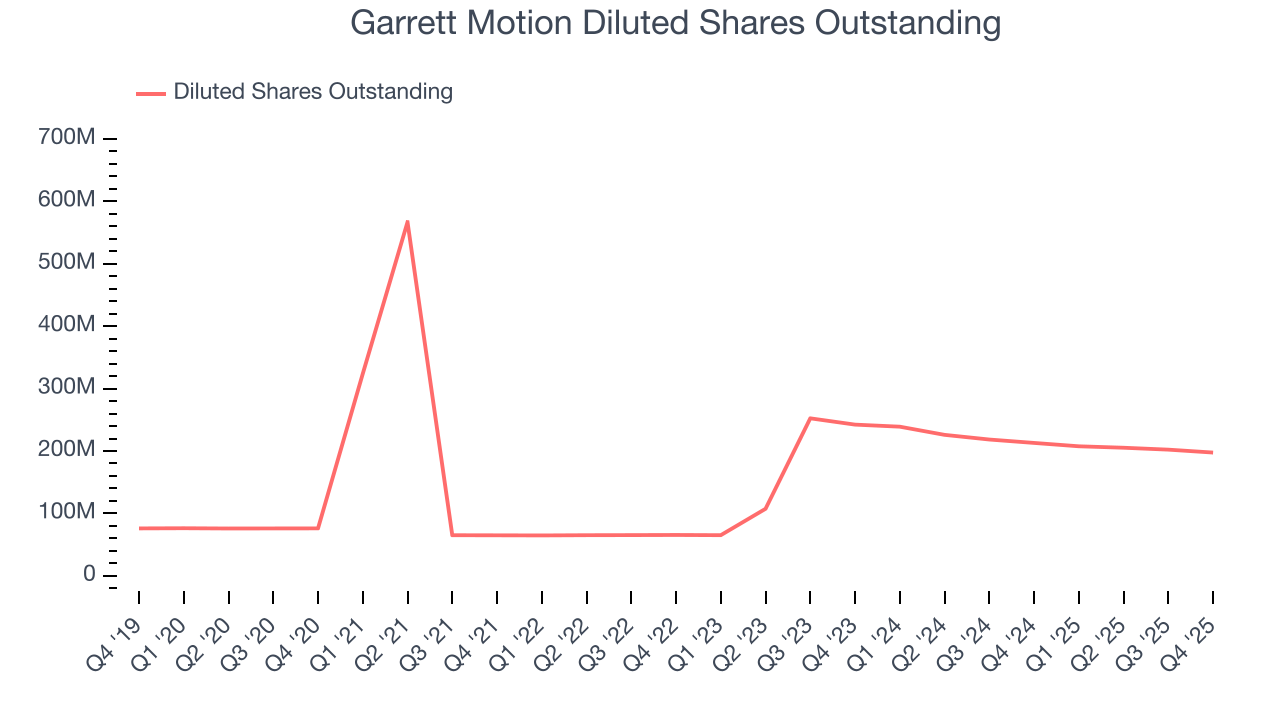
In Q4, Garrett Motion reported EPS of $0.42, down from $0.47 in the same quarter last year. Despite falling year on year, this print easily cleared analysts’ estimates. Over the next 12 months, Wall Street expects Garrett Motion’s full-year EPS of $1.52 to grow 3.2%.
9. Cash Is King
Free cash flow isn't a prominently featured metric in company financials and earnings releases, but we think it's telling because it accounts for all operating and capital expenses, making it tough to manipulate. Cash is king.
Garrett Motion has shown impressive cash profitability, enabling it to ride out cyclical downturns more easily while maintaining its investments in new and existing offerings. The company’s free cash flow margin averaged 9.1% over the last five years, better than the broader industrials sector.
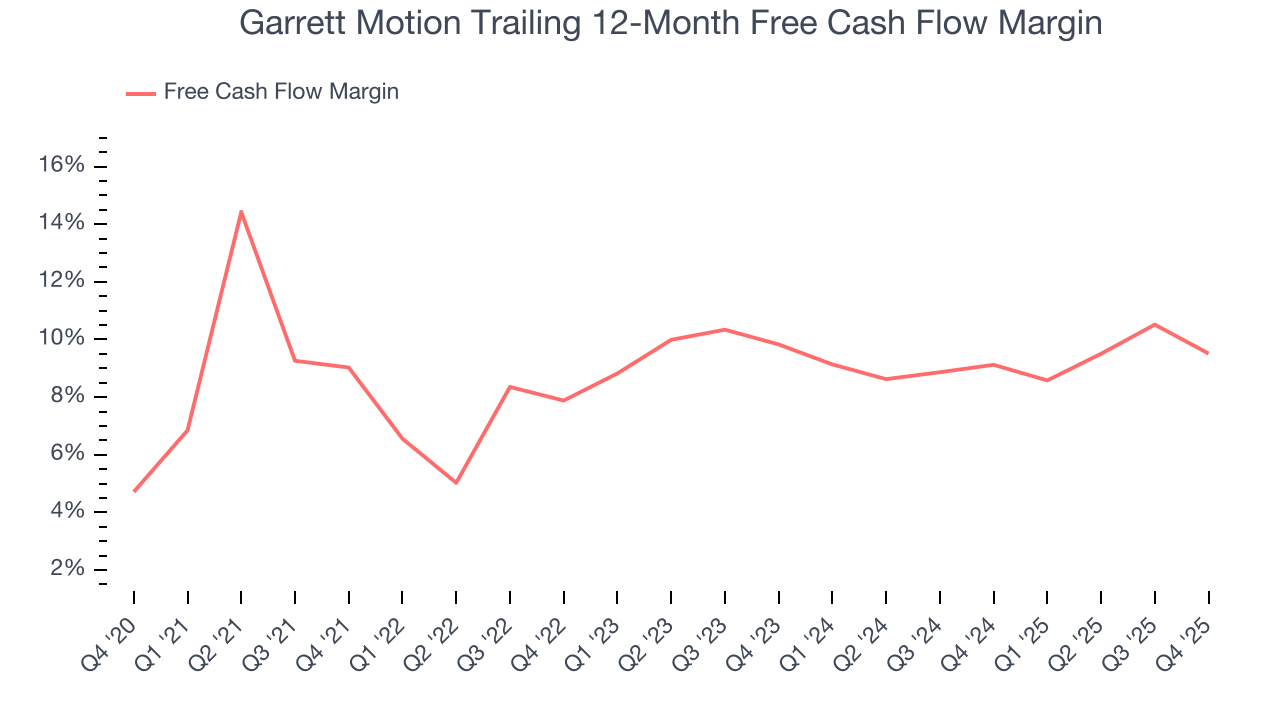
Garrett Motion’s free cash flow clocked in at $78 million in Q4, equivalent to a 8.8% margin. The company’s cash profitability regressed as it was 4.2 percentage points lower than in the same quarter last year, prompting us to pay closer attention. Short-term fluctuations typically aren’t a big deal because investment needs can be seasonal, but we’ll be watching to see if the trend extrapolates into future quarters.
10. Return on Invested Capital (ROIC)
EPS and free cash flow tell us whether a company was profitable while growing its revenue. But was it capital-efficient? Enter ROIC, a metric showing how much operating profit a company generates relative to the money it has raised (debt and equity).
Although Garrett Motion hasn’t been the highest-quality company lately because of its poor top-line performance, it found a few growth initiatives in the past that worked out wonderfully. Its four-year average ROIC was 62.9%, splendid for an industrials business.
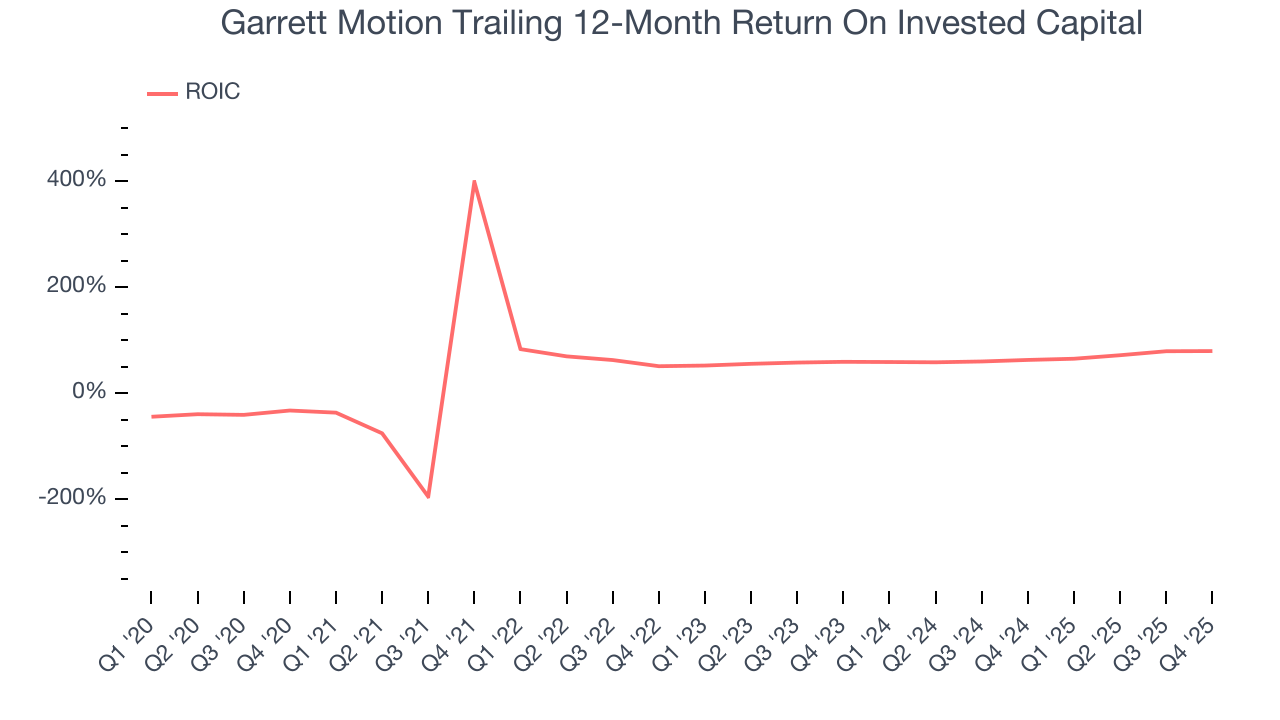
We like to invest in businesses with high returns, but the trend in a company’s ROIC is what often surprises the market and moves the stock price. Fortunately, Garrett Motion’s ROIC has increased significantly over the last few years. This is a good sign, and we hope the company can keep improving.
11. Balance Sheet Assessment
Garrett Motion reported $177 million of cash and $1.42 billion of debt on its balance sheet in the most recent quarter. As investors in high-quality companies, we primarily focus on two things: 1) that a company’s debt level isn’t too high and 2) that its interest payments are not excessively burdening the business.
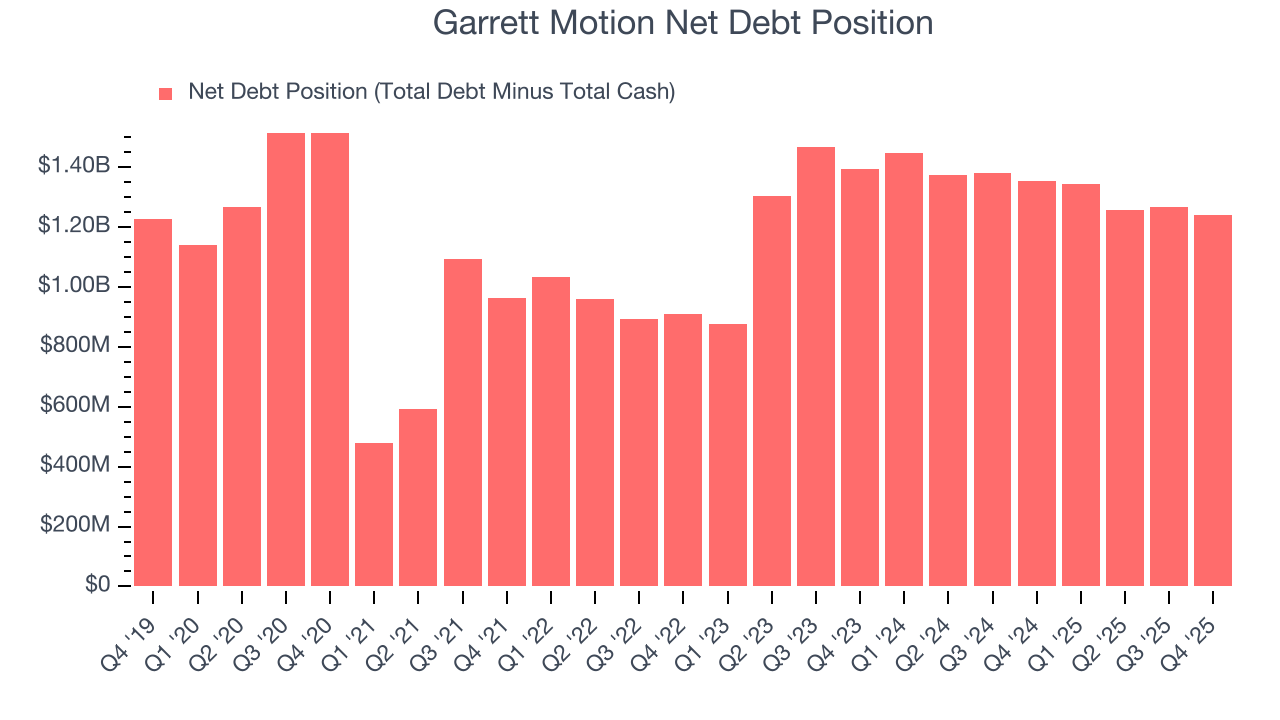
With $616 million of EBITDA over the last 12 months, we view Garrett Motion’s 2.0× net-debt-to-EBITDA ratio as safe. We also see its $58 million of annual interest expenses as appropriate. The company’s profits give it plenty of breathing room, allowing it to continue investing in growth initiatives.
12. Key Takeaways from Garrett Motion’s Q4 Results
It was good to see Garrett Motion beat analysts’ EPS expectations this quarter. We were also glad its revenue outperformed Wall Street’s estimates. Overall, we think this was a solid quarter with some key areas of upside. Investors were likely hoping for more, and shares traded down 5.3% to $19.50 immediately following the results.
13. Is Now The Time To Buy Garrett Motion?
Updated: March 10, 2026 at 1:33 AM EDT
Before investing in or passing on Garrett Motion, we urge you to understand the company’s business quality (or lack thereof), valuation, and the latest quarterly results - in that order.
Garrett Motion isn’t a bad business, but we’re not clamoring to buy it here and now. Although its revenue growth was weak over the last five years, its rising cash profitability gives it more optionality. Tread carefully with this one, however, as its low gross margins indicate some combination of competitive pressures and high production costs.
Garrett Motion’s P/E ratio based on the next 12 months is 10x. While this valuation is reasonable, we don’t really see a big opportunity at the moment. We're fairly confident there are better stocks to buy right now.
Wall Street analysts have a consensus one-year price target of $22.20 on the company (compared to the current share price of $18.41).