
Honeywell (HON)
We’re cautious of Honeywell. Its weak sales growth and declining returns on capital show its demand and profits are shrinking.― StockStory Analyst Team
1. News
2. Summary
Why We Think Honeywell Will Underperform
Originally founded in 1906 as a thermostat company, Honeywell (NASDAQ:HON) is a multinational conglomerate known for its aerospace systems, building technologies, performance materials, and safety and productivity solutions.
- Sizable revenue base leads to growth challenges as its 2.1% annual revenue increases over the last five years fell short of other industrials companies
- Organic sales performance over the past two years indicates the company may need to make strategic adjustments or rely on M&A to catalyze faster growth
- A consolation is that its healthy operating margin shows it’s a well-run company with efficient processes


Honeywell fails to meet our quality criteria. We see more lucrative opportunities elsewhere.
Why There Are Better Opportunities Than Honeywell


At $217.00 per share, Honeywell trades at 21.8x forward P/E. Honeywell’s multiple may seem like a great deal among industrials peers, but we think there are valid reasons why it’s this cheap.
Cheap stocks can look like a great deal at first glance, but they can be value traps. They often have less earnings power, meaning there is more reliance on a re-rating to generate good returns - an unlikely scenario for low-quality companies.
3. Honeywell (HON) Research Report: Q4 CY2025 Update
Industrial conglomerate Honeywell (NASDAQ:HON) missed Wall Street’s revenue expectations in Q4 CY2025, but sales rose 6.4% year on year to $9.76 billion. The company’s full-year revenue guidance of $39.3 billion at the midpoint came in 0.8% below analysts’ estimates. Its non-GAAP profit of $2.59 per share was 2.1% above analysts’ consensus estimates.
Honeywell (HON) Q4 CY2025 Highlights:
- Revenue: $9.76 billion vs analyst estimates of $9.91 billion (6.4% year-on-year growth, 1.6% miss)
- Adjusted EPS: $2.59 vs analyst estimates of $2.54 (2.1% beat)
- Adjusted EPS guidance for the upcoming financial year 2026 is $10.50 at the midpoint, beating analyst estimates by 0.8%
- Operating Margin: 10.2%, down from 17.6% in the same quarter last year
- Free Cash Flow Margin: 9.2%, down from 20.6% in the same quarter last year
- Organic Revenue rose 11% year on year (beat)
- Market Capitalization: $137.5 billion
Company Overview
Originally founded in 1906 as a thermostat company, Honeywell (NASDAQ:HON) is a multinational conglomerate known for its aerospace systems, building technologies, performance materials, and safety and productivity solutions.
Honeywell's history dates back to 1906 when Honeywell Heating Specialty was founded, focusing initially on the development of water heating systems. As the company evolved, it merged with Minneapolis Heat Regulator Company in 1927, creating Minneapolis-Honeywell Regulator, which quickly became a leader in the field of environmental control technology for buildings. Throughout the 20th century, Honeywell engaged in numerous acquisitions, diversifying into aerospace, home and building technologies, performance materials, and safety products. In the late 1990s and early 2000s, Honeywell underwent significant transformations, including a merger with AlliedSignal, an aerospace, automotive and engineering company, which retained the Honeywell name due to its brand recognition.
Today, Honeywell offers a diverse array of products across several key industries. Its offerings include aerospace systems like jet engines and avionics, building technologies such as climate controls and security systems, and performance materials like specialty chemicals and materials for industrial use. Honeywell also provides safety and productivity solutions including personal protective equipment and warehouse automation technologies. These products serve a variety of end markets including aerospace, building technologies, manufacturing, safety, and productivity sectors.
Honeywell also provides software solutions across its diverse business segments, enhancing operational efficiency and connectivity. For instance, Honeywell Forge offers integrated data analytics and predictive maintenance capabilities, turning raw data into actionable insights for better fleet management and optimized building operations.
Honeywell generates revenue through the sale of its products and services across its diverse business units. The company also benefits from recurring revenue streams through long-term service contracts, software updates, and maintenance services, which provide ongoing support and enhancements for its base of products.
Honeywell is actively enhancing its portfolio through significant acquisitions, including the $5 billion acquisition of Carrier Global Corporation's Global Access Solutions business. Moving forward, the company intends to continue optimizing its portfolio by pursuing strategic bolt-on acquisitions that align with its long-term growth and product development objectives.
4. General Industrial Machinery
Automation that increases efficiency and connected equipment that collects analyzable data have been trending, creating new demand for general industrial machinery companies. Those who innovate and create digitized solutions can spur sales and speed up replacement cycles, but all general industrial machinery companies are still at the whim of economic cycles. Consumer spending and interest rates, for example, can greatly impact the industrial production that drives demand for these companies’ offerings.
Competitors offering similar products include Siemens AG (NYSE:SIE), Johnson Controls International (NYSE:JCI), Emerson Electric (NYSE:EMR), and Raytheon Technologies (NYSE:RTX).
5. Revenue Growth
Reviewing a company’s long-term sales performance reveals insights into its quality. Any business can have short-term success, but a top-tier one grows for years. Over the last five years, Honeywell grew its sales at a sluggish 2.8% compounded annual growth rate. This was below our standards and is a tough starting point for our analysis.
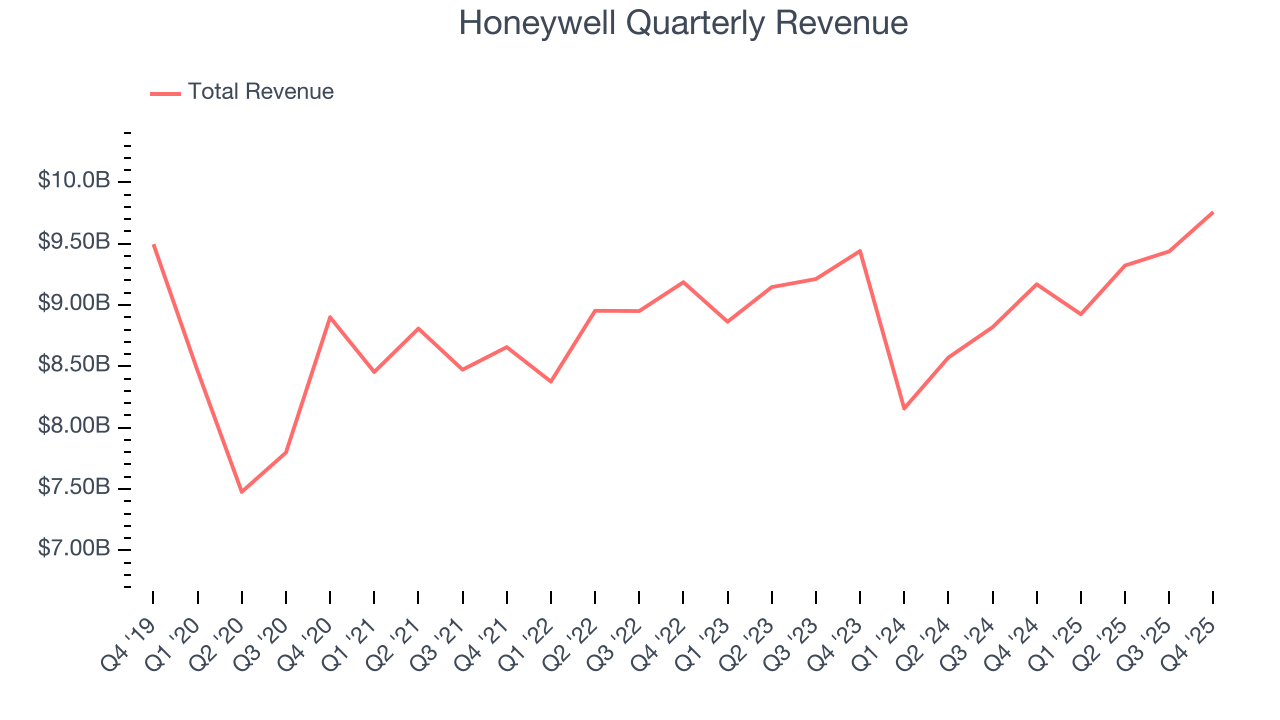
We at StockStory place the most emphasis on long-term growth, but within industrials, a half-decade historical view may miss cycles, industry trends, or a company capitalizing on catalysts such as a new contract win or a successful product line. Honeywell’s recent performance shows its demand has slowed as its annualized revenue growth of 1.1% over the last two years was below its five-year trend. 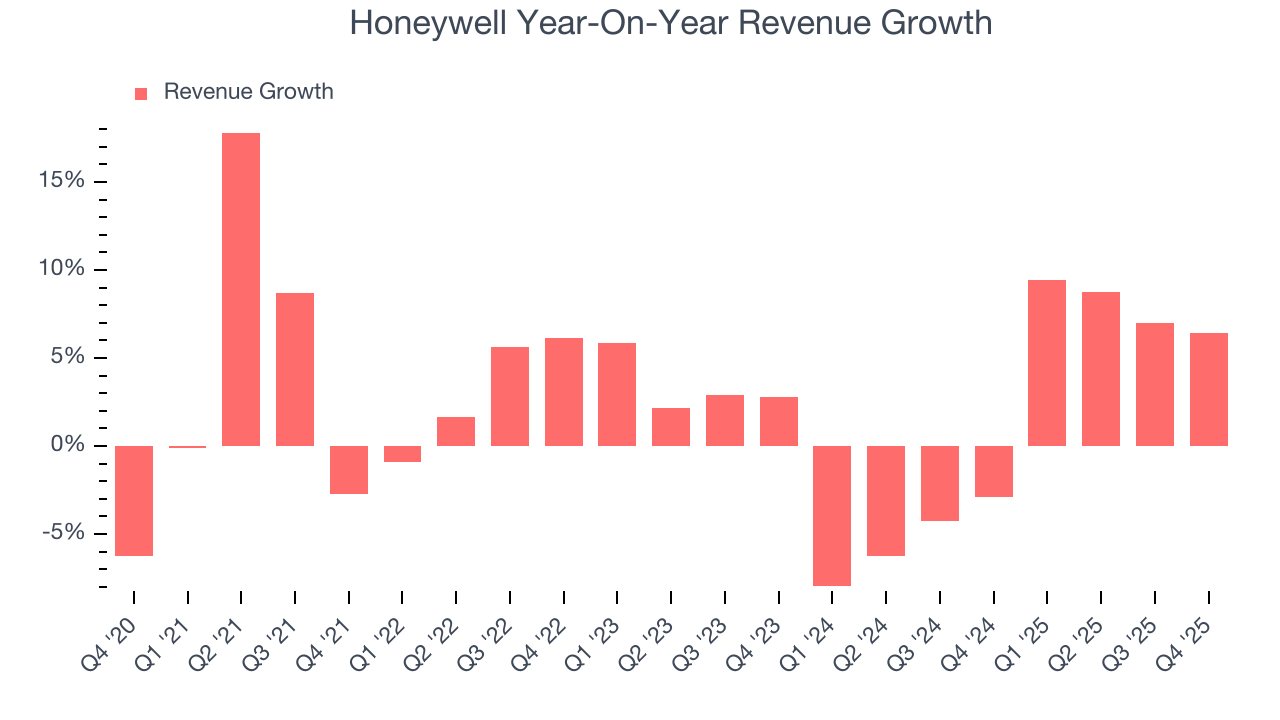
We can dig further into the company’s sales dynamics by analyzing its organic revenue, which strips out one-time events like acquisitions and currency fluctuations that don’t accurately reflect its fundamentals. Over the last two years, Honeywell’s organic revenue averaged 5.1% year-on-year growth. Because this number is better than its two-year revenue growth, we can see that some mixture of divestitures and foreign exchange rates dampened its headline results. 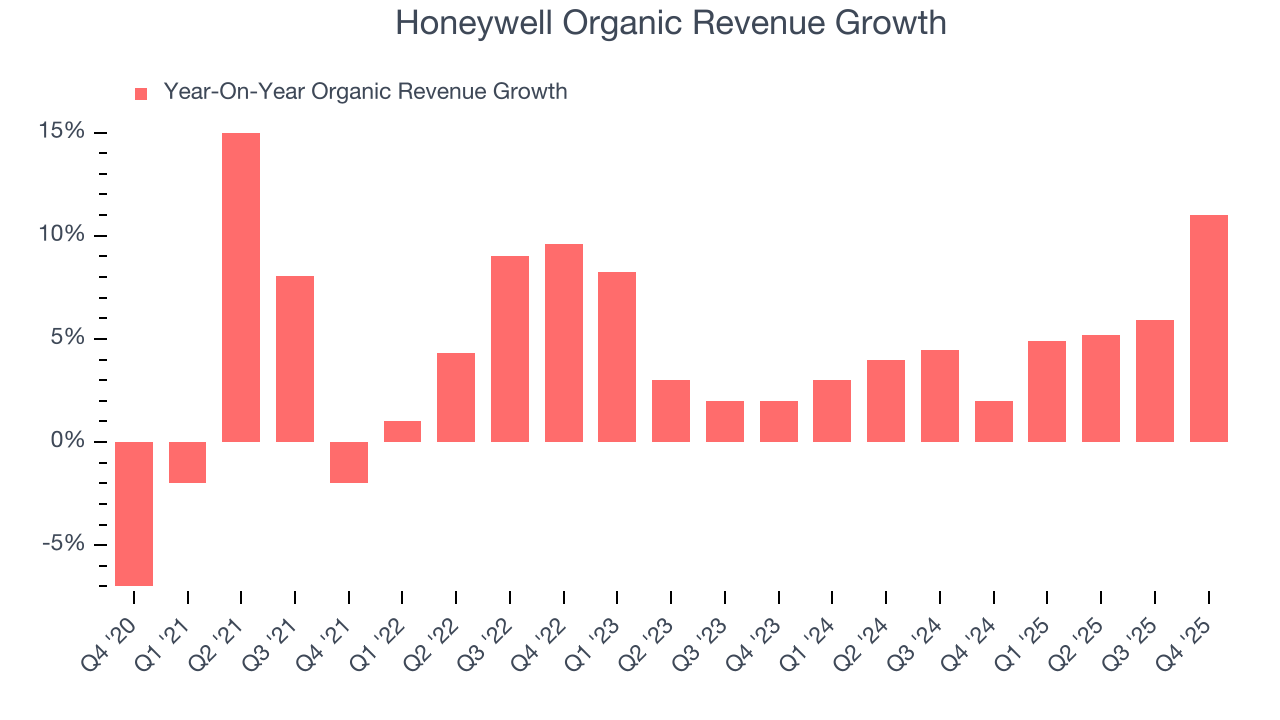
This quarter, Honeywell’s revenue grew by 6.4% year on year to $9.76 billion, missing Wall Street’s estimates.
Looking ahead, sell-side analysts expect revenue to grow 5.7% over the next 12 months. While this projection indicates its newer products and services will catalyze better top-line performance, it is still below average for the sector.
6. Gross Margin & Pricing Power
All else equal, we prefer higher gross margins because they usually indicate that a company sells more differentiated products and commands stronger pricing power.
Honeywell’s gross margin is good compared to other industrials businesses and signals it sells differentiated products, not commodities. As you can see below, it averaged an impressive 33.9% gross margin over the last five years. That means for every $100 in revenue, roughly $33.91 was left to spend on selling, marketing, R&D, and general administrative overhead. 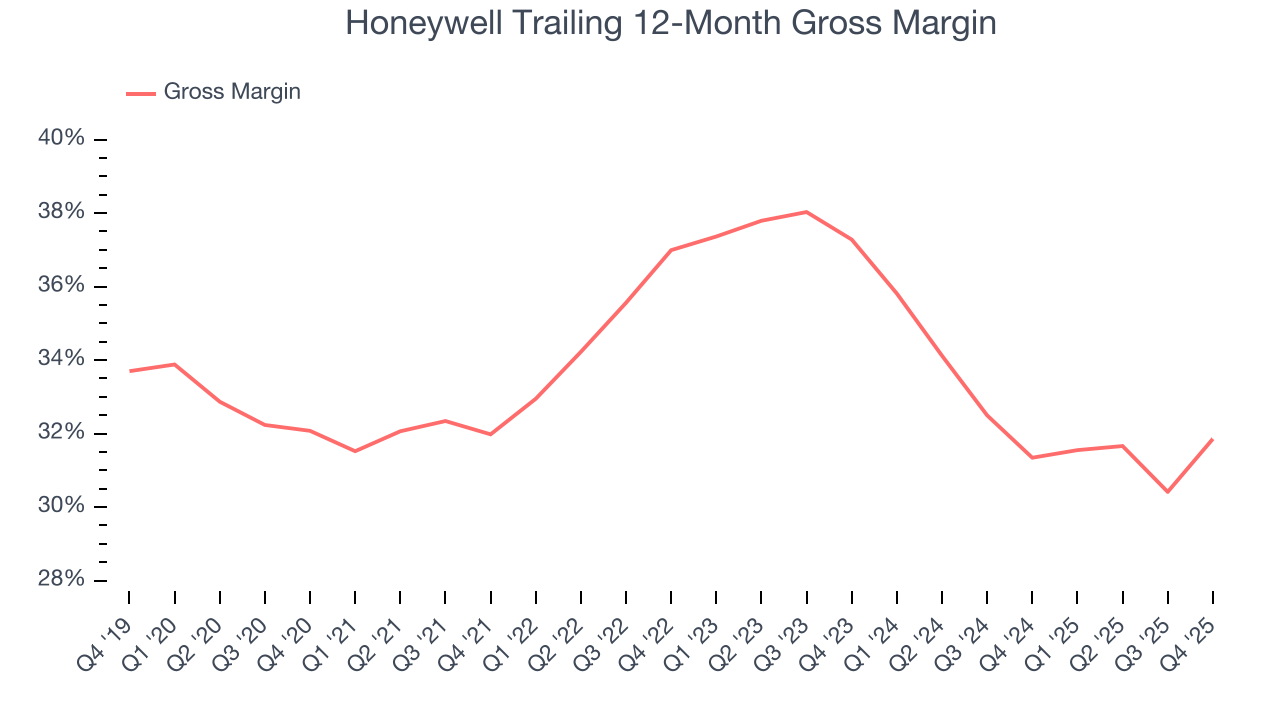
This quarter, Honeywell’s gross profit margin was 35.6%, marking a 5.6 percentage point increase from 30% in the same quarter last year. Zooming out, the company’s full-year margin has remained steady over the past 12 months, suggesting its input costs (such as raw materials and manufacturing expenses) have been stable and it isn’t under pressure to lower prices.
7. Operating Margin
Honeywell has been a well-oiled machine over the last five years. It demonstrated elite profitability for an industrials business, boasting an average operating margin of 20.6%. This result isn’t too surprising as its gross margin gives it a favorable starting point.
Looking at the trend in its profitability, Honeywell’s operating margin decreased by 2.9 percentage points over the last five years. This raises questions about the company’s expense base because its revenue growth should have given it leverage on its fixed costs, resulting in better economies of scale and profitability.
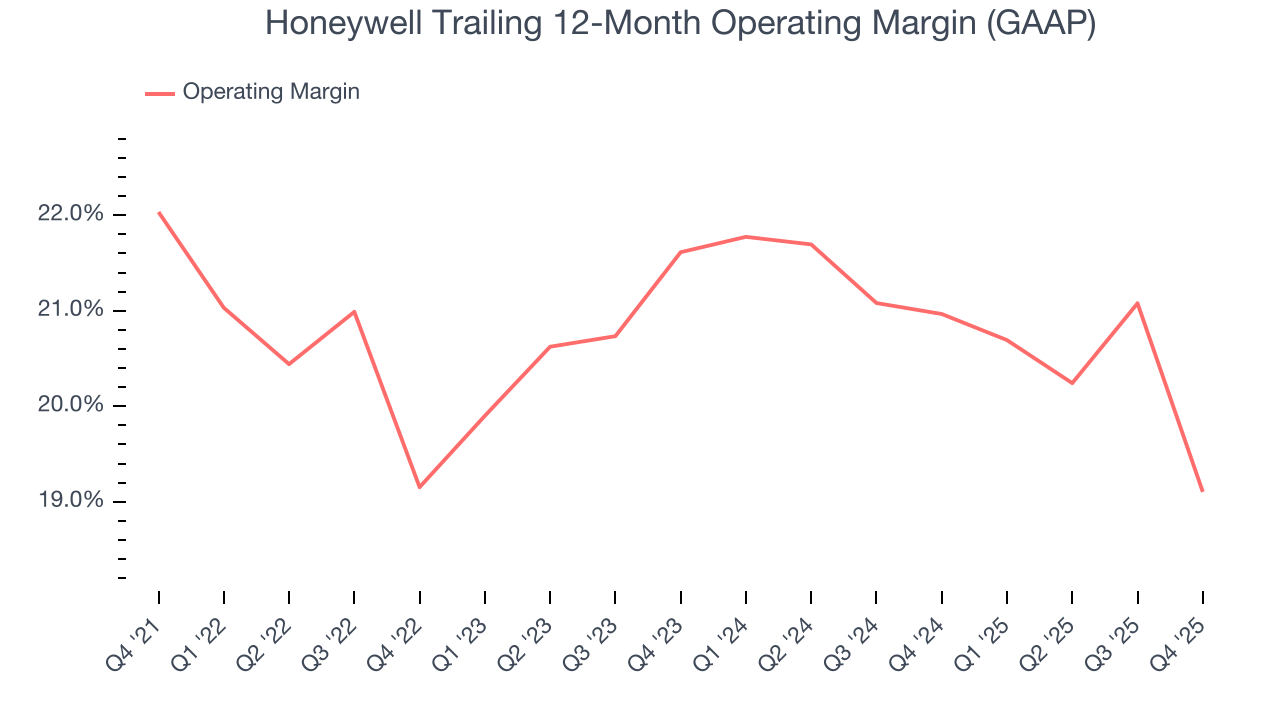
In Q4, Honeywell generated an operating margin profit margin of 10.2%, down 7.4 percentage points year on year. Conversely, its revenue and gross margin actually rose, so we can assume it was less efficient because its operating expenses like marketing, R&D, and administrative overhead grew faster than its revenue.
8. Earnings Per Share
Revenue trends explain a company’s historical growth, but the long-term change in earnings per share (EPS) points to the profitability of that growth – for example, a company could inflate its sales through excessive spending on advertising and promotions.
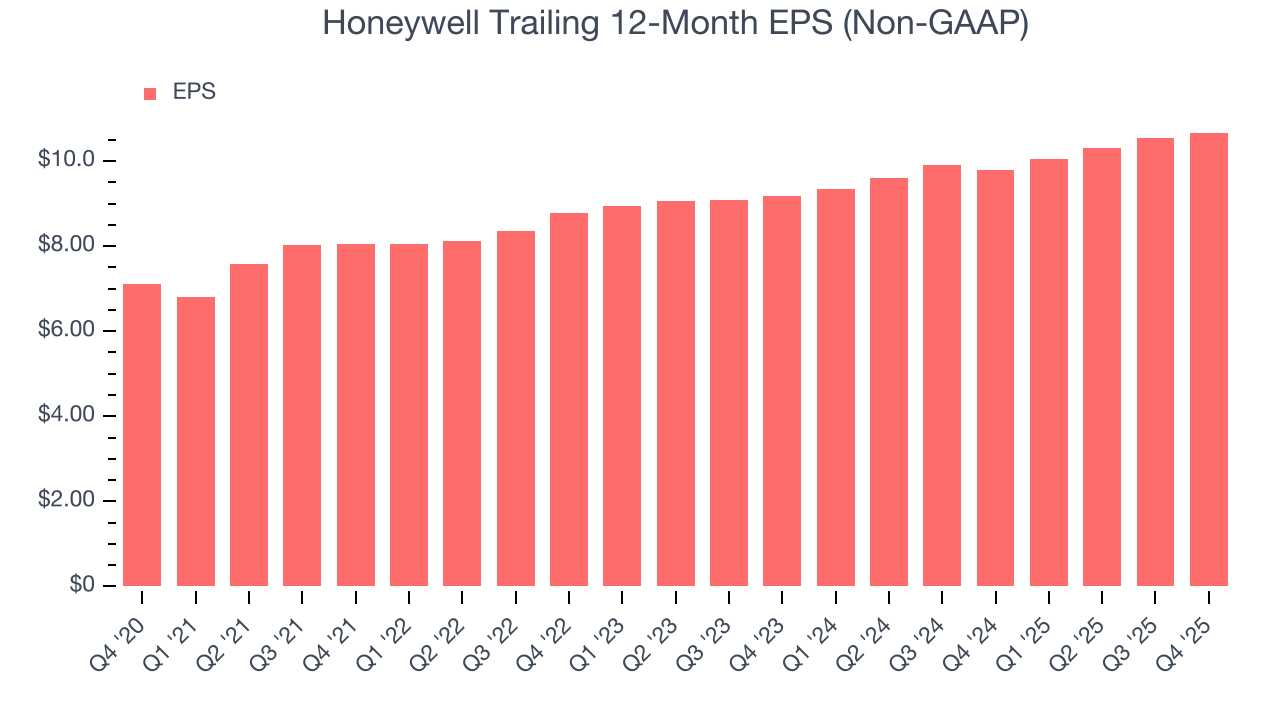
Honeywell’s EPS grew at a decent 8.5% compounded annual growth rate over the last five years, higher than its 2.8% annualized revenue growth. However, this alone doesn’t tell us much about its business quality because its operating margin didn’t improve.
Diving into Honeywell’s quality of earnings can give us a better understanding of its performance. A five-year view shows that Honeywell has repurchased its stock, shrinking its share count by 10.1%. This tells us its EPS outperformed its revenue not because of increased operational efficiency but financial engineering, as buybacks boost per share earnings. 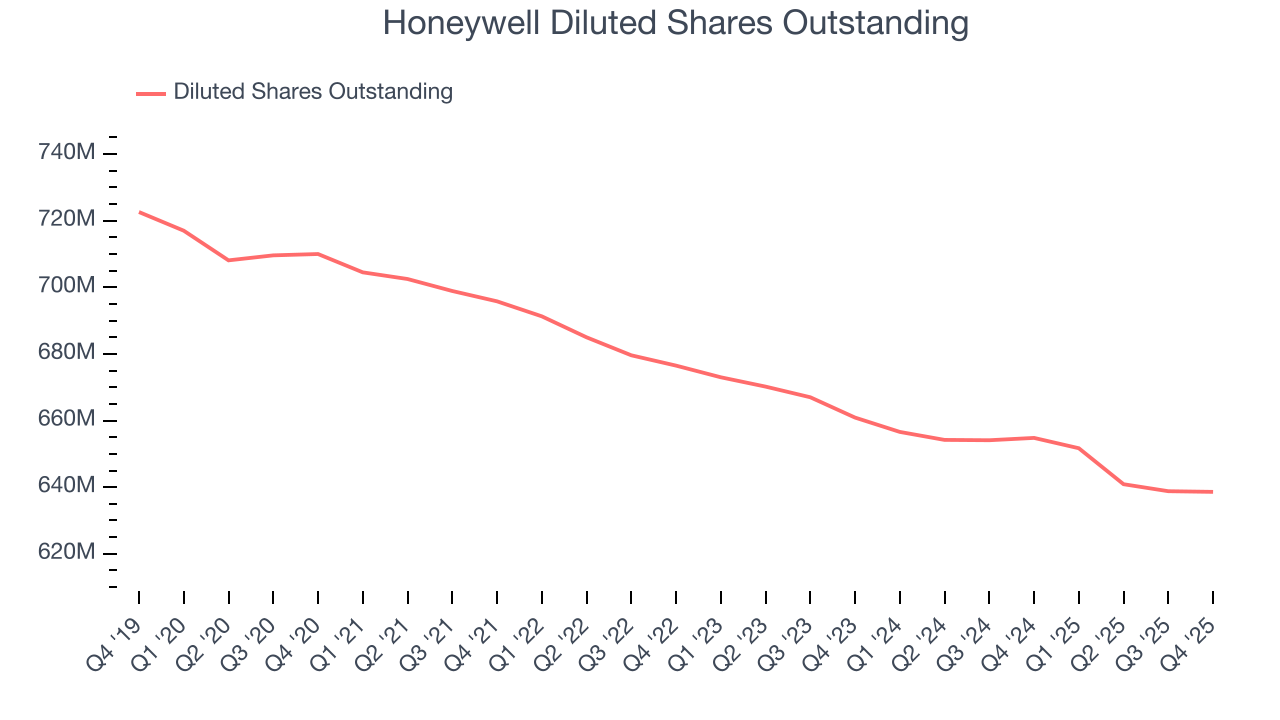
Like with revenue, we analyze EPS over a shorter period to see if we are missing a change in the business.
For Honeywell, its two-year annual EPS growth of 7.9% is similar to its five-year trend, implying stable earnings.
In Q4, Honeywell reported adjusted EPS of $2.59, up from $2.47 in the same quarter last year. This print beat analysts’ estimates by 2.1%. Over the next 12 months, Wall Street expects Honeywell’s full-year EPS of $10.67 to shrink by 2.2%.
9. Cash Is King
Free cash flow isn't a prominently featured metric in company financials and earnings releases, but we think it's telling because it accounts for all operating and capital expenses, making it tough to manipulate. Cash is king.
Honeywell has shown terrific cash profitability, putting it in an advantageous position to invest in new products, return capital to investors, and consolidate the market during industry downturns. The company’s free cash flow margin was among the best in the industrials sector, averaging 13.5% over the last five years.
Taking a step back, we can see that Honeywell’s margin dropped by 1.1 percentage points during that time. Continued declines could signal it is in the middle of an investment cycle.
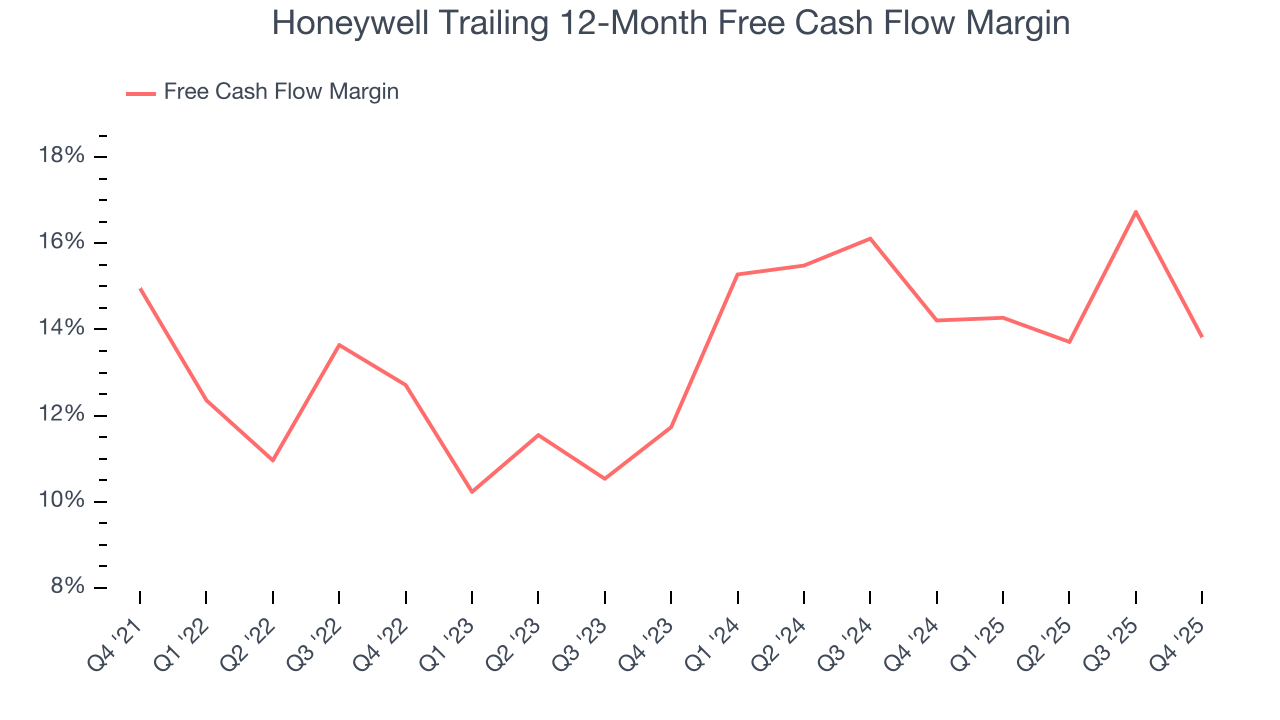
Honeywell’s free cash flow clocked in at $898 million in Q4, equivalent to a 9.2% margin. The company’s cash profitability regressed as it was 11.4 percentage points lower than in the same quarter last year, suggesting its historical struggles have dragged on.
10. Return on Invested Capital (ROIC)
EPS and free cash flow tell us whether a company was profitable while growing its revenue. But was it capital-efficient? A company’s ROIC explains this by showing how much operating profit it makes compared to the money it has raised (debt and equity).
Although Honeywell hasn’t been the highest-quality company lately because of its poor top-line performance, it found a few growth initiatives in the past that worked out wonderfully. Its five-year average ROIC was 19.8%, splendid for an industrials business.
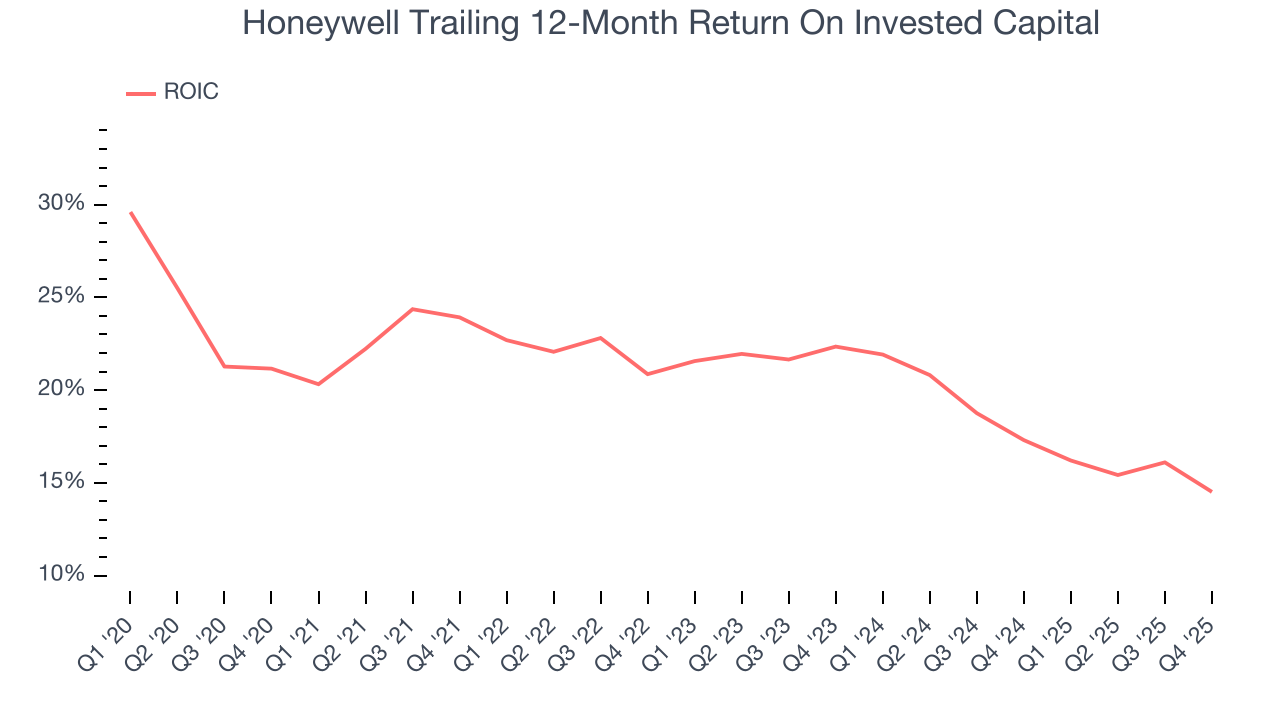
We like to invest in businesses with high returns, but the trend in a company’s ROIC is what often surprises the market and moves the stock price. Unfortunately, Honeywell’s ROIC has decreased over the last few years. We like what management has done in the past, but its declining returns are perhaps a symptom of fewer profitable growth opportunities.
11. Key Takeaways from Honeywell’s Q4 Results
We enjoyed seeing Honeywell beat analysts’ organic revenue expectations this quarter. We were also glad its full-year EPS guidance slightly exceeded Wall Street’s estimates. On the other hand, its revenue missed and its full-year revenue guidance fell slightly short of Wall Street’s estimates. Zooming out, we think this was a mixed quarter. The stock remained flat at $216.86 immediately after reporting.
12. Is Now The Time To Buy Honeywell?
Updated: January 29, 2026 at 6:28 AM EST
The latest quarterly earnings matters, sure, but we actually think longer-term fundamentals and valuation matter more. Investors should consider all these pieces before deciding whether or not to invest in Honeywell.
Honeywell doesn’t pass our quality test. First off, its revenue growth was weak over the last five years. And while its impressive operating margins show it has a highly efficient business model, the downside is its diminishing returns show management's prior bets haven't worked out. On top of that, its projected EPS for the next year is lacking.
Honeywell’s P/E ratio based on the next 12 months is 20.8x. At this valuation, there’s a lot of good news priced in - we think other companies feature superior fundamentals at the moment.
Wall Street analysts have a consensus one-year price target of $236.44 on the company (compared to the current share price of $216.86).