
Hub Group (HUBG)
Hub Group keeps us up at night. Its weak sales growth and declining returns on capital show its demand and profits are shrinking.― StockStory Analyst Team
1. News


2. Summary
Why We Think Hub Group Will Underperform
Started with $10,000, Hub Group (NASDAQ:HUBG) is a provider of intermodal, truck brokerage, and logistics services, facilitating transportation solutions for businesses worldwide.
- Customers postponed purchases of its products and services this cycle as its revenue declined by 9% annually over the last two years
- Earnings per share decreased by more than its revenue over the last two years, showing each sale was less profitable
- Sales are projected to be flat over the next 12 months and imply weak demand


Hub Group’s quality is inadequate. More profitable opportunities exist elsewhere.
Why There Are Better Opportunities Than Hub Group


Hub Group’s stock price of $35.50 implies a valuation ratio of 17.7x forward P/E. Hub Group’s multiple may seem like a great deal among industrials peers, but we think there are valid reasons why it’s this cheap.
Cheap stocks can look like a great deal at first glance, but they can be value traps. They often have less earnings power, meaning there is more reliance on a re-rating to generate good returns - an unlikely scenario for low-quality companies.
3. Hub Group (HUBG) Research Report: Q3 CY2025 Update
Logistics solutions provider Hub Group (NASDAQ:HUBG) beat Wall Street’s revenue expectations in Q3 CY2025, but sales fell by 5.3% year on year to $934.5 million. On the other hand, the company’s full-year revenue guidance of $3.65 billion at the midpoint came in 0.7% below analysts’ estimates. Its GAAP profit of $0.47 per share was 2.1% below analysts’ consensus estimates.
Hub Group (HUBG) Q3 CY2025 Highlights:
- Revenue: $934.5 million vs analyst estimates of $927.9 million (5.3% year-on-year decline, 0.7% beat)
- EPS (GAAP): $0.47 vs analyst expectations of $0.48 (2.1% miss)
- Adjusted EBITDA: $87.78 million vs analyst estimates of $81.54 million (9.4% margin, 7.7% beat)
- The company dropped its revenue guidance for the full year to $3.65 billion at the midpoint from $3.7 billion, a 1.4% decrease
- EPS (GAAP) guidance for the full year is $1.85 at the midpoint, beating analyst estimates by 1.8%
- Operating Margin: 4.2%, in line with the same quarter last year
- Free Cash Flow Margin: 2.4%, down from 3.6% in the same quarter last year
- Sales Volumes were flat year on year (12% in the same quarter last year)
- Market Capitalization: $2.68 billion
Company Overview
Started with $10,000, Hub Group (NASDAQ:HUBG) is a provider of intermodal, truck brokerage, and logistics services, facilitating transportation solutions for businesses worldwide.
Founded in 1971, the company was established with the vision of streamlining transportation processes and providing efficient solutions for businesses globally.
Hub Group offers transportation services, including intermodal shipping, truck brokerage, and logistics management. By combining various modes of transportation, such as rail, trucking, and ocean carriers, Hub Group provides integrated solutions to optimize supply chain efficiency. For example, the company's intermodal services allow customers to seamlessly transition between rail and truck transportation, reducing costs and transit times.
The primary revenue sources for Hub Group come from transportation services, including freight brokerage, intermodal, and logistics solutions. Hub Group caters to industries, including retail, consumer goods, automotive, and manufacturing, offering tailored transportation solutions to meet the needs of each client. Additionally, Hub Group utilizes digital platforms and technology-driven tools to enhance its sales process, providing customers with convenient access to transportation options and real-time tracking capabilities.
4. Air Freight and Logistics
The growth of e-commerce and global trade continues to drive demand for expedited shipping services, presenting opportunities for air freight companies. The industry continues to invest in advanced technologies such as automated sorting systems and real-time tracking solutions to enhance operational efficiency. Despite the advantages of speed and global reach, air freight and logistics companies are still at the whim of economic cycles. Consumer spending, for example, can greatly impact the demand for these companies’ offerings while fuel costs can influence profit margins.
Competitors in the logistics solutions industry include C.H. Robinson (NASDAQ:CHRW), GXO Logistics (NYSE:GXO), and Landstar System (NASDAQ:LSTR).
5. Revenue Growth
A company’s long-term sales performance is one signal of its overall quality. Any business can put up a good quarter or two, but many enduring ones grow for years. Regrettably, Hub Group’s sales grew at a sluggish 1.6% compounded annual growth rate over the last five years. This fell short of our benchmarks and is a tough starting point for our analysis.
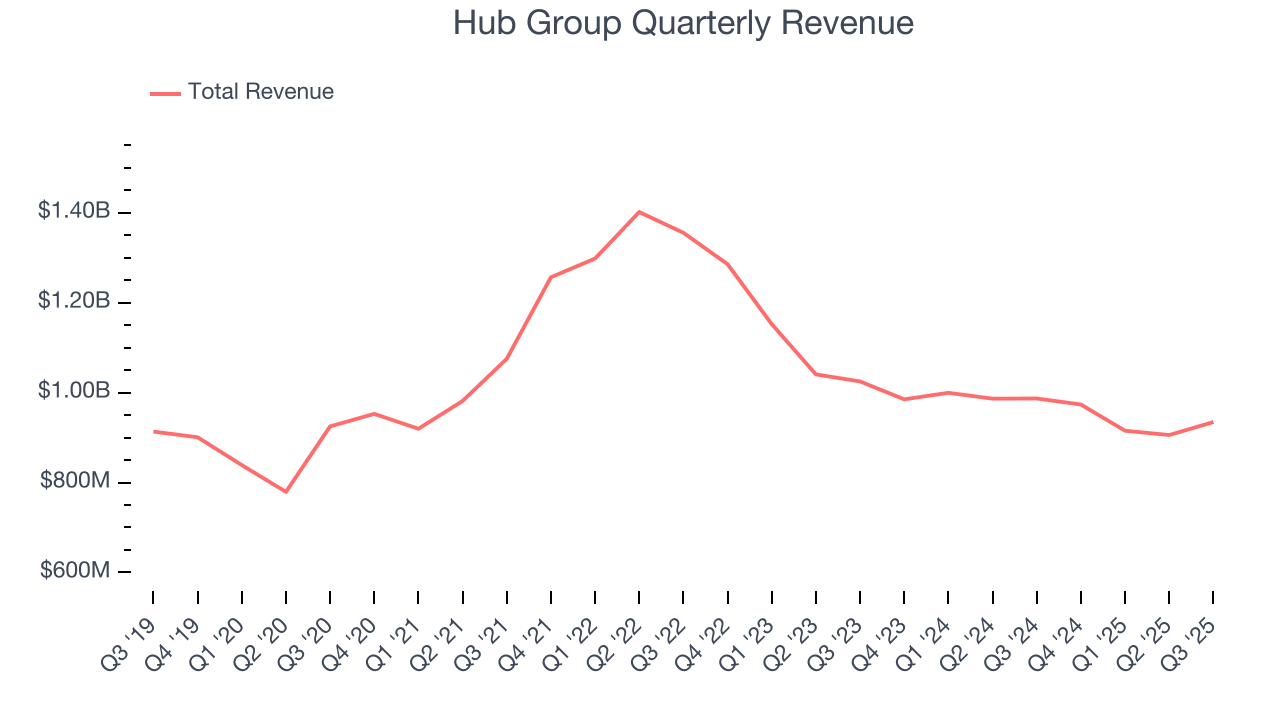
Long-term growth is the most important, but within industrials, a half-decade historical view may miss new industry trends or demand cycles. Hub Group’s performance shows it grew in the past but relinquished its gains over the last two years, as its revenue fell by 9% annually. Hub Group isn’t alone in its struggles as the Air Freight and Logistics industry experienced a cyclical downturn, with many similar businesses observing lower sales at this time. 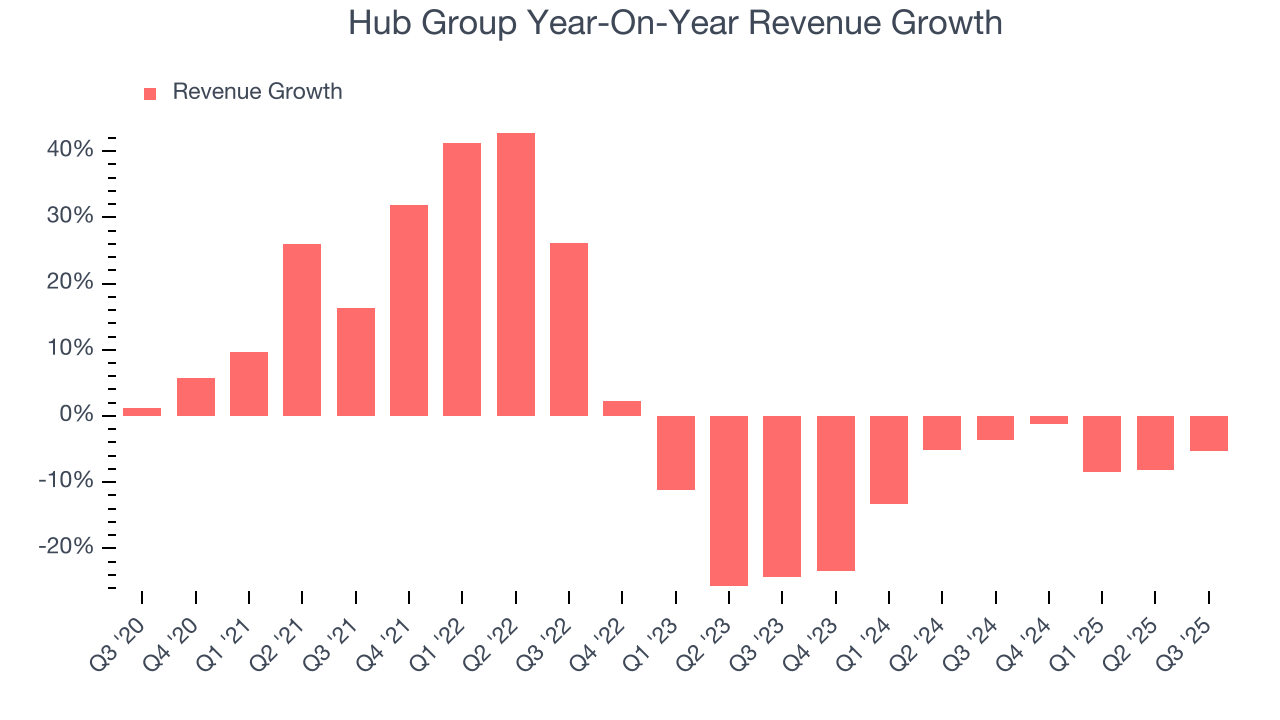
We can better understand the company’s revenue dynamics by analyzing its number of units sold. Over the last two years, Hub Group’s units sold averaged 2.7% year-on-year growth. Because this number is better than its revenue growth, we can see the company’s average selling price decreased. 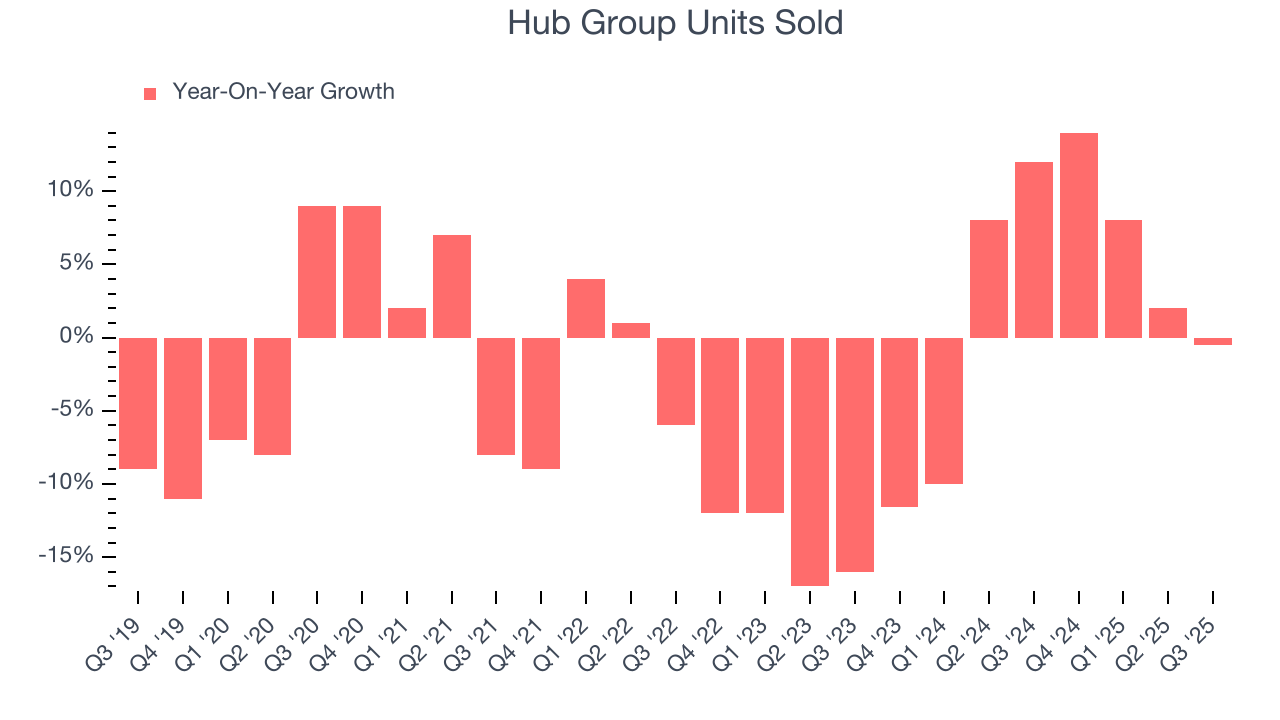
This quarter, Hub Group’s revenue fell by 5.3% year on year to $934.5 million but beat Wall Street’s estimates by 0.7%.
Looking ahead, sell-side analysts expect revenue to remain flat over the next 12 months. Although this projection implies its newer products and services will catalyze better top-line performance, it is still below average for the sector.
6. Gross Margin & Pricing Power
Hub Group has bad unit economics for an industrials business, signaling it operates in a competitive market. As you can see below, it averaged a 12.7% gross margin over the last five years. Said differently, Hub Group had to pay a chunky $87.26 to its suppliers for every $100 in revenue. 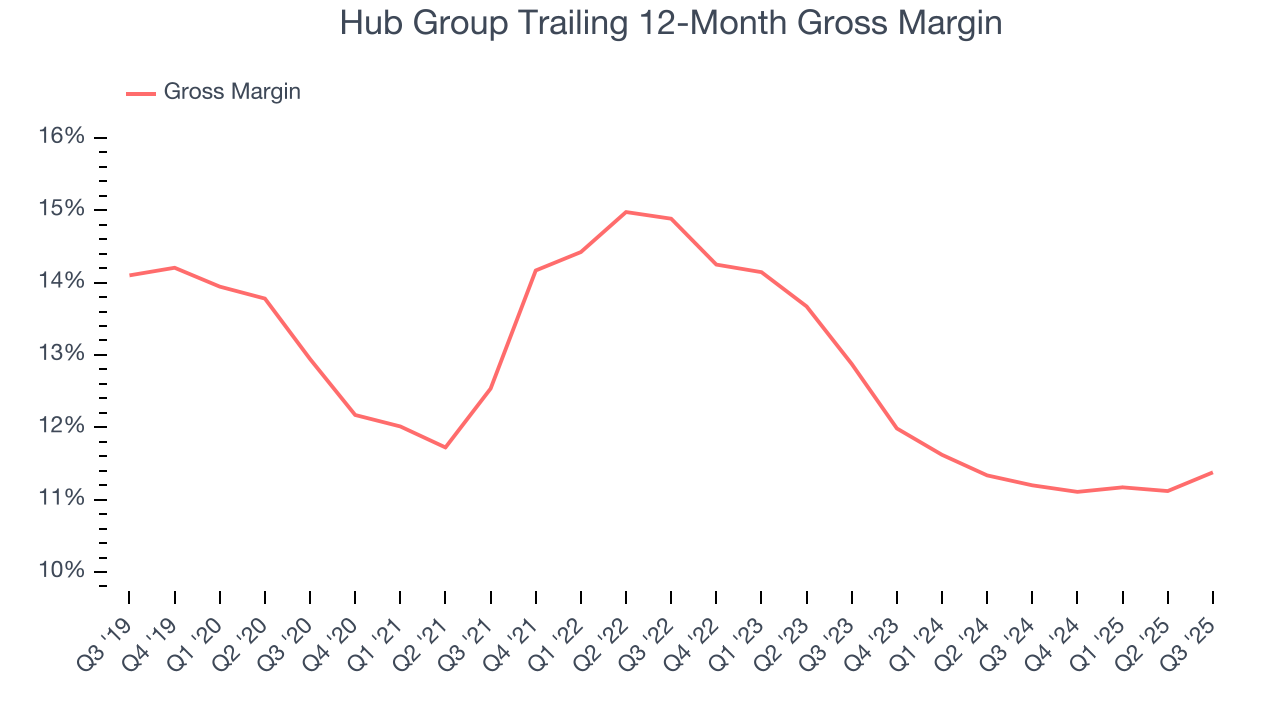
Hub Group produced a 11.5% gross profit margin in Q3, in line with the same quarter last year. On a wider time horizon, the company’s full-year margin has remained steady over the past four quarters, suggesting its input costs (such as raw materials and manufacturing expenses) have been stable and it isn’t under pressure to lower prices.
7. Operating Margin
Hub Group’s operating margin might fluctuated slightly over the last 12 months but has generally stayed the same, averaging 5.6% over the last five years. This profitability was paltry for an industrials business and caused by its suboptimal cost structureand low gross margin.
Analyzing the trend in its profitability, Hub Group’s operating margin might fluctuated slightly but has generally stayed the same over the last five years. This raises questions about the company’s expense base because its revenue growth should have given it leverage on its fixed costs, resulting in better economies of scale and profitability. Hub Group’s performance was poor, but we noticed this is a broad theme as many similar Air Freight and Logistics companies saw their margins fall (along with revenue, as mentioned above) because the cycle turned in the wrong direction.
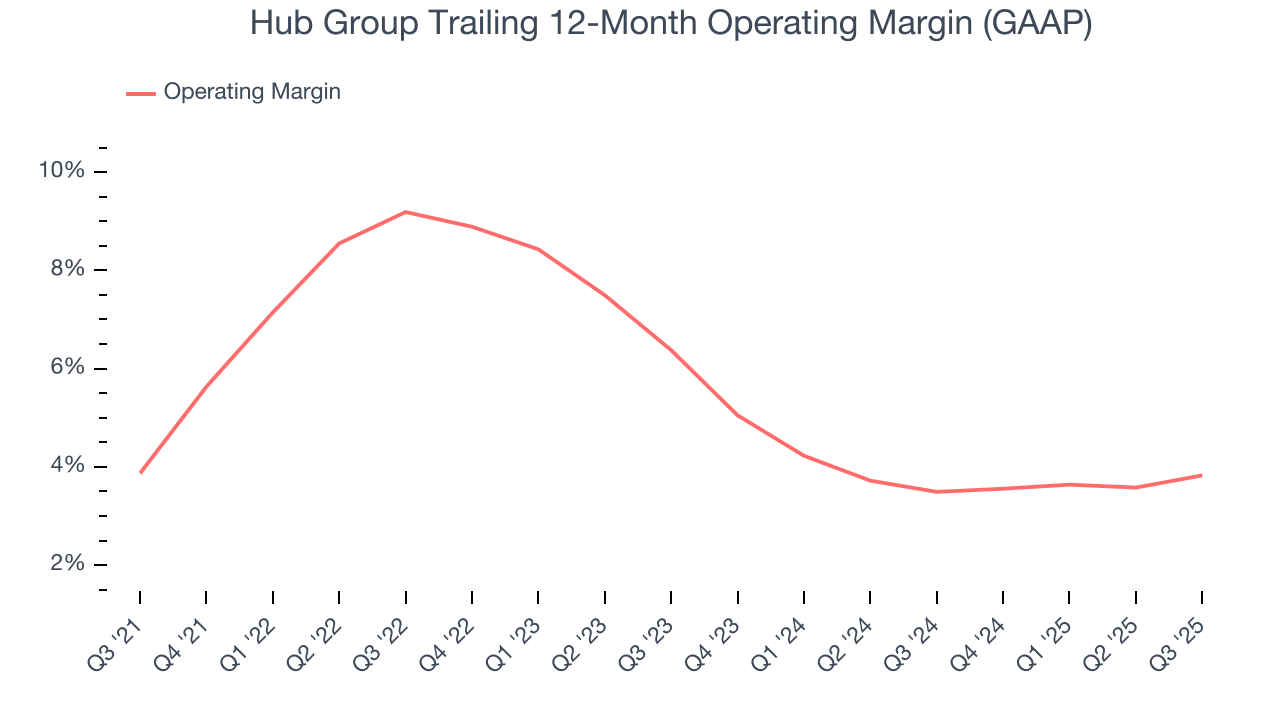
In Q3, Hub Group generated an operating margin profit margin of 4.2%, in line with the same quarter last year. This indicates the company’s cost structure has recently been stable.
8. Earnings Per Share
We track the long-term change in earnings per share (EPS) for the same reason as long-term revenue growth. Compared to revenue, however, EPS highlights whether a company’s growth is profitable.
Hub Group’s EPS grew at a decent 8% compounded annual growth rate over the last five years, higher than its 1.6% annualized revenue growth. However, this alone doesn’t tell us much about its business quality because its operating margin didn’t improve.
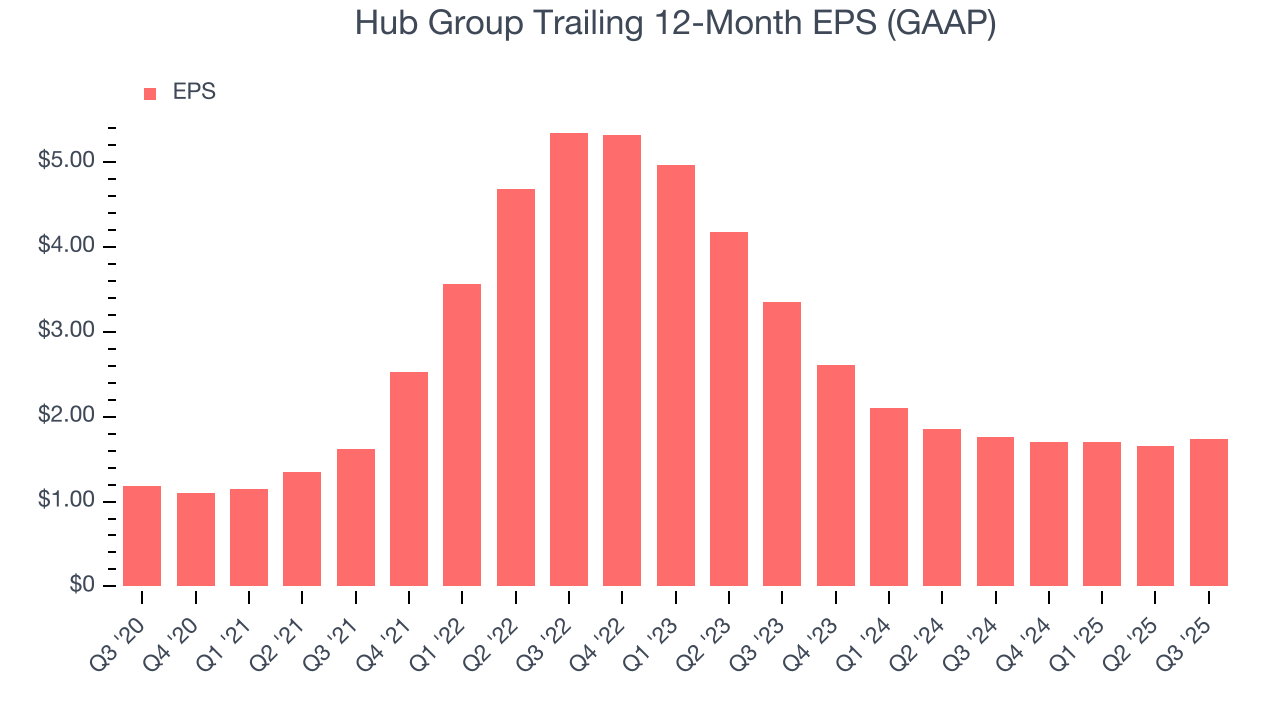
Diving into the nuances of Hub Group’s earnings can give us a better understanding of its performance. A five-year view shows that Hub Group has repurchased its stock, shrinking its share count by 10.2%. This tells us its EPS outperformed its revenue not because of increased operational efficiency but financial engineering, as buybacks boost per share earnings. 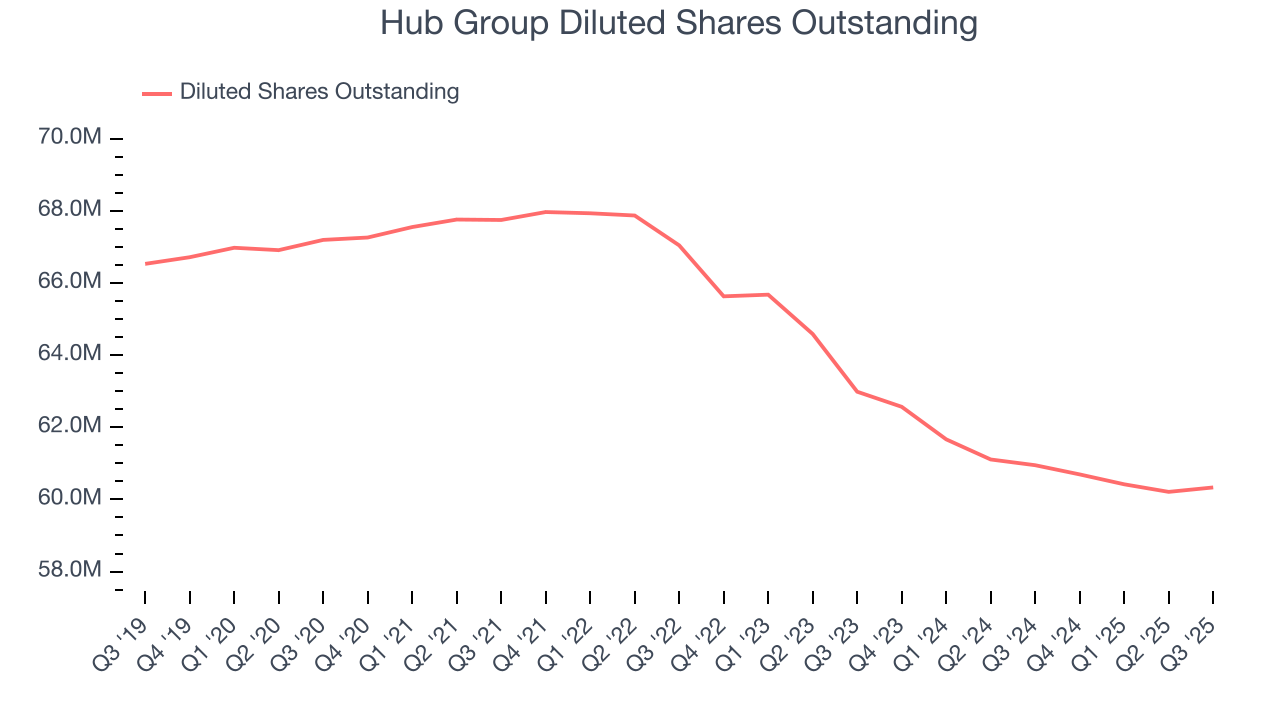
Like with revenue, we analyze EPS over a shorter period to see if we are missing a change in the business.
For Hub Group, its two-year annual EPS declines of 28% mark a reversal from its five-year trend. We hope Hub Group can return to earnings growth in the future.
In Q3, Hub Group reported EPS of $0.47, up from $0.39 in the same quarter last year. Despite growing year on year, this print missed analysts’ estimates, but we care more about long-term EPS growth than short-term movements. Over the next 12 months, Wall Street expects Hub Group’s full-year EPS of $1.74 to grow 15.9%.
9. Cash Is King
Although earnings are undoubtedly valuable for assessing company performance, we believe cash is king because you can’t use accounting profits to pay the bills.
Hub Group has shown mediocre cash profitability over the last five years, giving the company limited opportunities to return capital to shareholders. Its free cash flow margin averaged 4.8%, subpar for an industrials business.
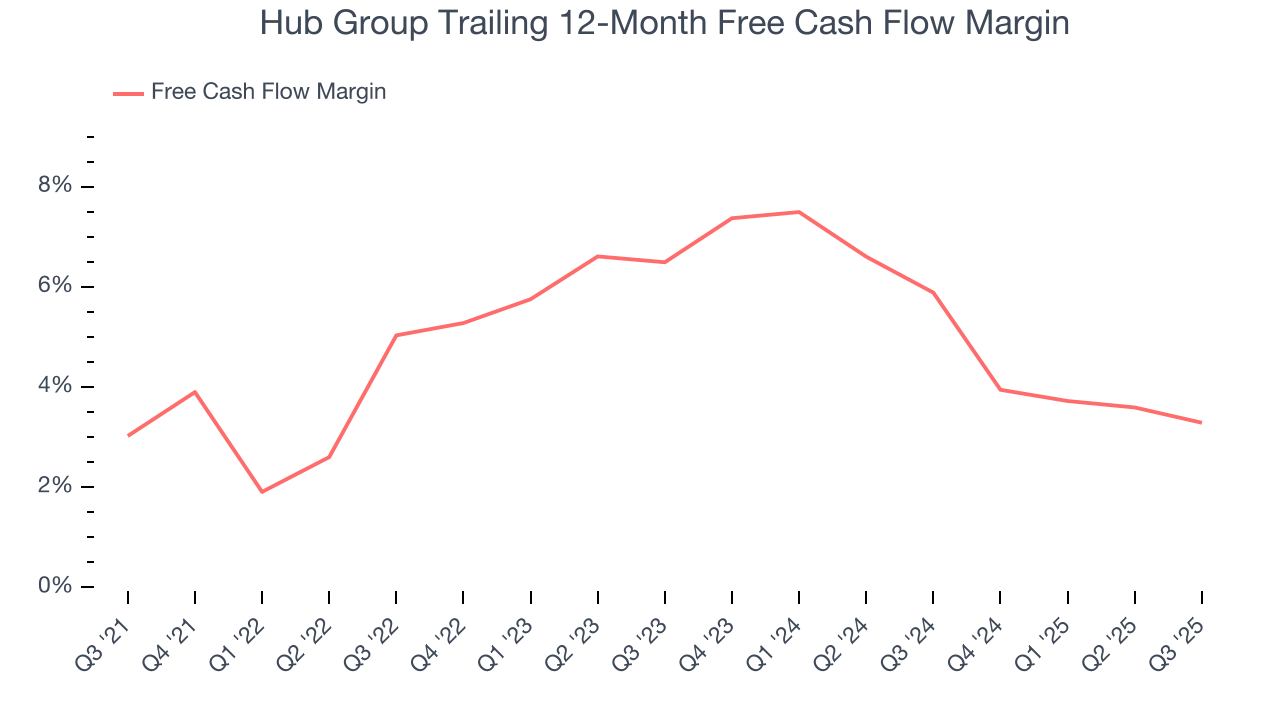
Hub Group’s free cash flow clocked in at $22.17 million in Q3, equivalent to a 2.4% margin. The company’s cash profitability regressed as it was 1.2 percentage points lower than in the same quarter last year, prompting us to pay closer attention. Short-term fluctuations typically aren’t a big deal because investment needs can be seasonal, but we’ll be watching to see if the trend extrapolates into future quarters.
10. Return on Invested Capital (ROIC)
EPS and free cash flow tell us whether a company was profitable while growing its revenue. But was it capital-efficient? A company’s ROIC explains this by showing how much operating profit it makes compared to the money it has raised (debt and equity).
Although Hub Group hasn’t been the highest-quality company lately because of its poor top-line performance, it historically found a few growth initiatives that worked. Its five-year average ROIC was 12.4%, higher than most industrials businesses.
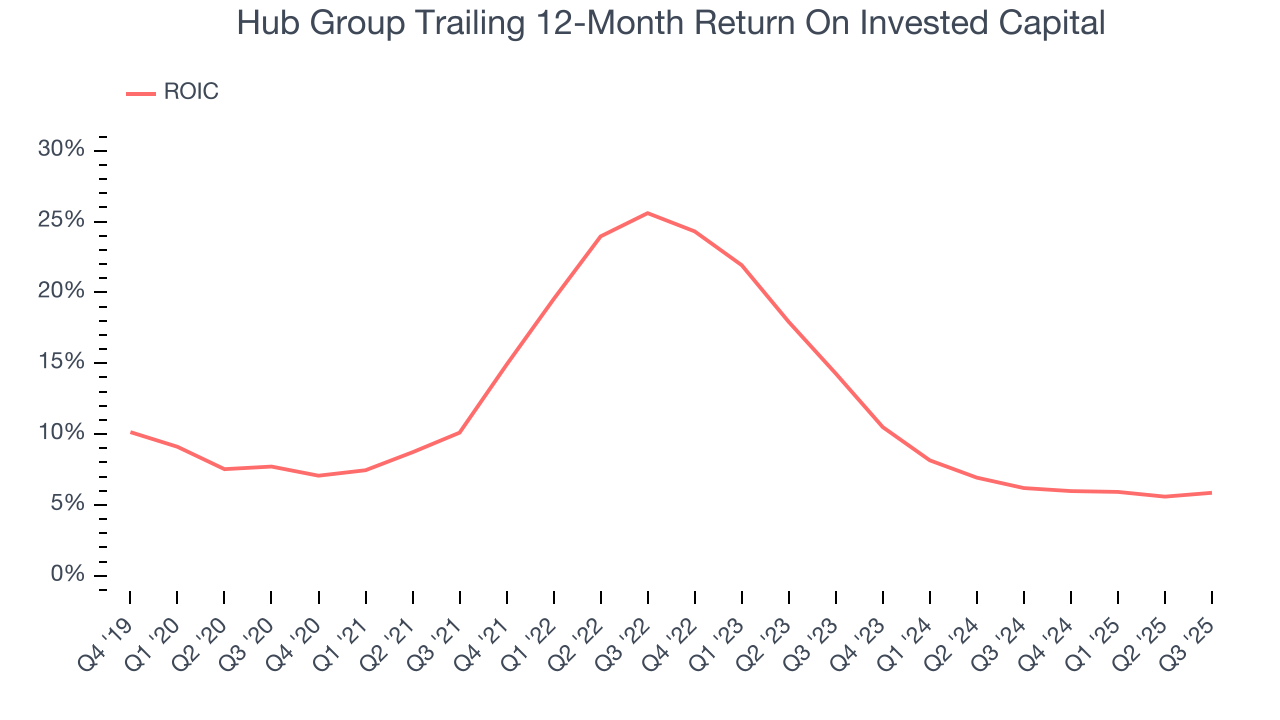
We like to invest in businesses with high returns, but the trend in a company’s ROIC is what often surprises the market and moves the stock price. Over the last few years, Hub Group’s ROIC has unfortunately decreased significantly. We like what management has done in the past, but its declining returns are perhaps a symptom of fewer profitable growth opportunities.
11. Balance Sheet Assessment
Hub Group reported $146.5 million of cash and $498.8 million of debt on its balance sheet in the most recent quarter. As investors in high-quality companies, we primarily focus on two things: 1) that a company’s debt level isn’t too high and 2) that its interest payments are not excessively burdening the business.
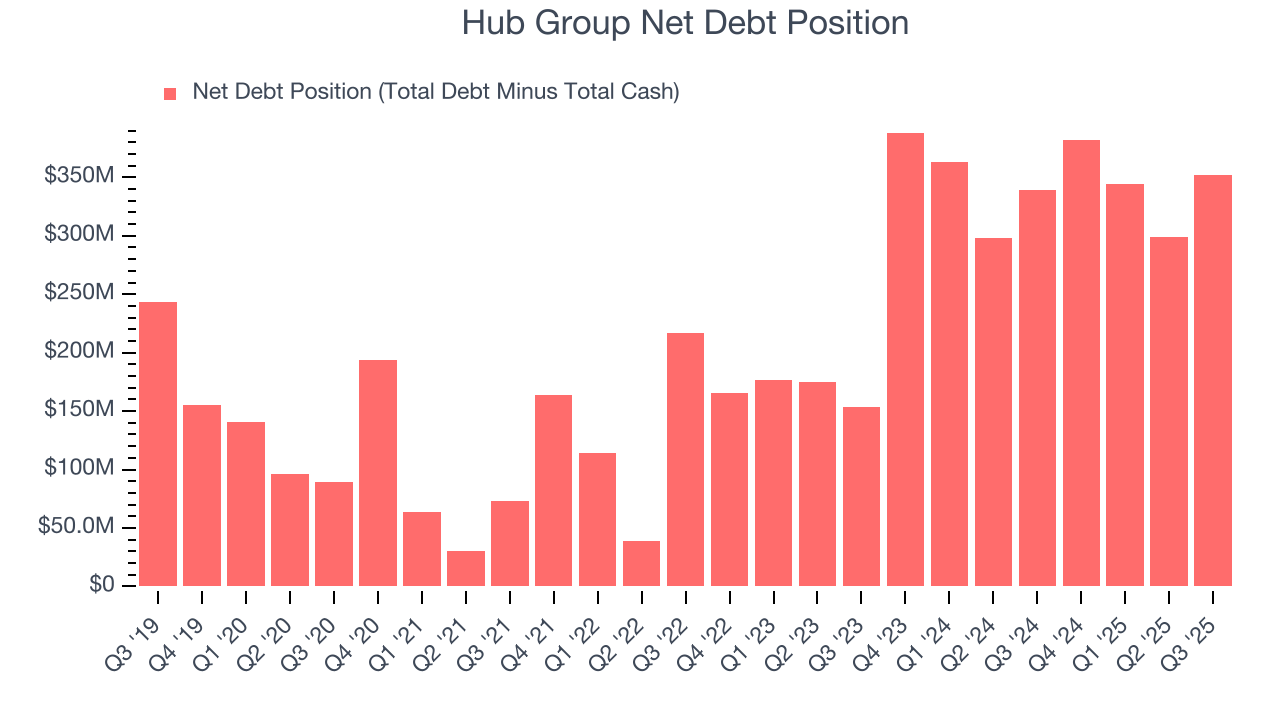
With $342.3 million of EBITDA over the last 12 months, we view Hub Group’s 1.0× net-debt-to-EBITDA ratio as safe. We also see its $7.64 million of annual interest expenses as appropriate. The company’s profits give it plenty of breathing room, allowing it to continue investing in growth initiatives.
12. Key Takeaways from Hub Group’s Q3 Results
We were impressed by how significantly Hub Group blew past analysts’ EBITDA expectations this quarter. We were also glad its full-year EPS guidance exceeded Wall Street’s estimates. On the other hand, its sales volume missed and its EPS fell short of Wall Street’s estimates. Overall, this quarter could have been better. The stock remained flat at $43.82 immediately after reporting.
13. Is Now The Time To Buy Hub Group?
Updated: March 22, 2026 at 11:53 PM EDT
A common mistake we notice when investors are deciding whether to buy a stock or not is that they simply look at the latest earnings results. Business quality and valuation matter more, so we urge you to understand these dynamics as well.
We cheer for all companies making their customers lives easier, but in the case of Hub Group, we’ll be cheering from the sidelines. First off, its revenue growth was weak over the last five years, and analysts expect its demand to deteriorate over the next 12 months. While its above-average ROIC suggests its management team has made good investment decisions, the downside is its diminishing returns show management's prior bets haven't worked out. On top of that, its low gross margins indicate some combination of competitive pressures and high production costs.
Hub Group’s P/E ratio based on the next 12 months is 17.7x. This valuation is reasonable, but the company’s shaky fundamentals present too much downside risk. There are superior stocks to buy right now.
Wall Street analysts have a consensus one-year price target of $45.67 on the company (compared to the current share price of $35.50).
Although the price target is bullish, readers should exercise caution because analysts tend to be overly optimistic. The firms they work for, often big banks, have relationships with companies that extend into fundraising, M&A advisory, and other rewarding business lines. As a result, they typically hesitate to say bad things for fear they will lose out. We at StockStory do not suffer from such conflicts of interest, so we’ll always tell it like it is.