
Malibu Boats (MBUU)
Malibu Boats is in for a bumpy ride. Its sales have underperformed and its low returns on capital show it has few growth opportunities.― StockStory Analyst Team
1. News


2. Summary
Why We Think Malibu Boats Will Underperform
Founded in California in 1982, Malibu Boats (NASDAQ:MBUU) is a manufacturer of high-performance sports boats and luxury watercrafts.
- Lackluster 3.9% annual revenue growth over the last five years indicates the company is losing ground to competitors
- Earnings per share fell by 20% annually over the last five years while its revenue grew, showing its incremental sales were much less profitable
- Persistent operating margin losses suggest the business manages its expenses poorly


Malibu Boats is skating on thin ice. There’s a wealth of better opportunities.
Why There Are Better Opportunities Than Malibu Boats


Malibu Boats is trading at $26.06 per share, or 15.3x forward P/E. This multiple is cheaper than most consumer discretionary peers, but we think this is justified.
It’s better to pay up for high-quality businesses with higher long-term earnings potential rather than to buy lower-quality stocks because they appear cheap. These challenged businesses often don’t re-rate, a phenomenon known as a “value trap”.
3. Malibu Boats (MBUU) Research Report: Q4 CY2025 Update
Recreational boats manufacturer Malibu Boats (NASDAQ:MBUU) reported Q4 CY2025 results beating Wall Street’s revenue expectations, but sales fell by 5.8% year on year to $188.6 million. Its non-GAAP loss of $0.02 per share was significantly below analysts’ consensus estimates.
Malibu Boats (MBUU) Q4 CY2025 Highlights:
- Revenue: $188.6 million vs analyst estimates of $181.4 million (5.8% year-on-year decline, 4% beat)
- Adjusted EPS: -$0.02 vs analyst estimates of $0.02 (significant miss)
- Adjusted EBITDA: $8.02 million vs analyst estimates of $8.99 million (4.3% margin, 10.8% miss)
- Operating Margin: -1.9%, down from 1.6% in the same quarter last year
- Market Capitalization: $665.4 million
Company Overview
Founded in California in 1982, Malibu Boats (NASDAQ:MBUU) is a manufacturer of high-performance sports boats and luxury watercrafts.
Malibu Boats was established to enhance the on-water experience. The company's initial objective was to produce boats that offered exceptional performance and quality for water skiing enthusiasts, leading to its recognition as a reputable brand among watermen.
Today, Malibu Boats offers a wide range of products including performance sport boats and luxury models across eight brands that cater to a more leisurely boating experience. The company's brands span namesake Malibu, Cobalt , Pursuit, and Cobia. Some of these brands were developed organically while others joined the company's portfolio through acquisitions.
Malibu Boats serves the watersport and marine enthusiast, and customers tend to be higher-income individuals or families that have the extra disposable income for a boat that is clearly not a primary vehicle. Malibu Boats generates most of its revenue from selling its range of watercraft, utilizing a broad dealer network and direct sales strategies. The company seeks to maintain its industry position by developing innovative features, such as its patented Surf Gate technology.
4. Leisure Products
Leisure products cover a wide range of goods in the consumer discretionary sector. Maintaining a strong brand is key to success, and those who differentiate themselves will enjoy customer loyalty and pricing power while those who don’t may find themselves in precarious positions due to the non-essential nature of their offerings.
Competitors in the sports boats and luxury watercraft market include Brunswick (NYSE:BC), Marine Products Corporation (NYSE:MPX), and MasterCraft Boat Holdings (NASDAQ:MCFT).
5. Revenue Growth
Reviewing a company’s long-term sales performance reveals insights into its quality. Any business can have short-term success, but a top-tier one grows for years. Unfortunately, Malibu Boats’s 3.9% annualized revenue growth over the last five years was weak. This was below our standard for the consumer discretionary sector and is a poor baseline for our analysis.
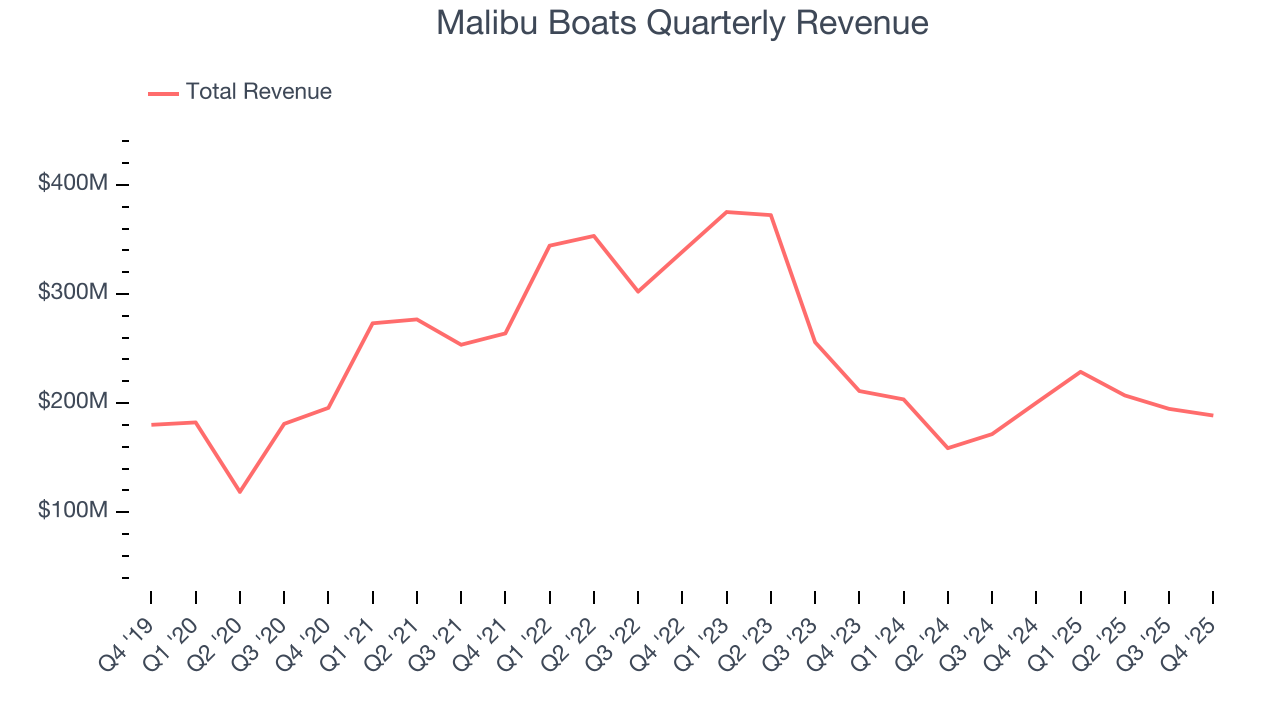
Long-term growth is the most important, but within consumer discretionary, product cycles are short and revenue can be hit-driven due to rapidly changing trends and consumer preferences. Malibu Boats’s performance shows it grew in the past but relinquished its gains over the last two years, as its revenue fell by 17.9% annually. 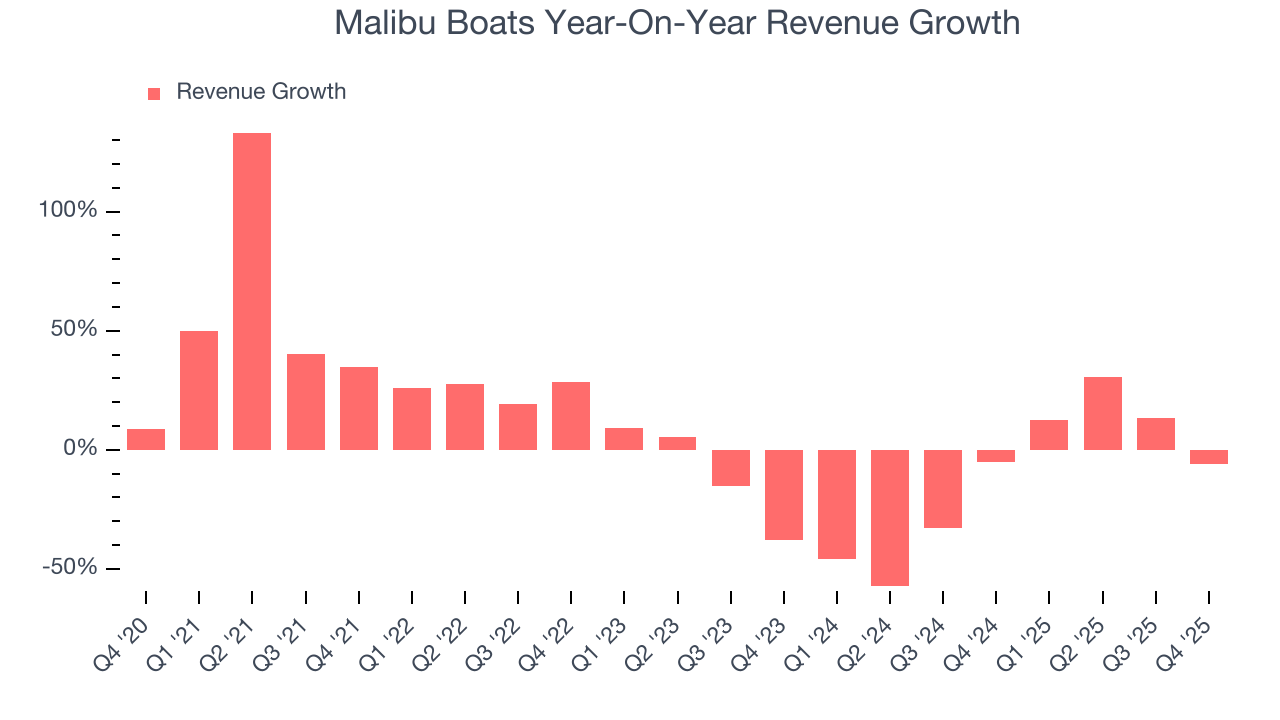
This quarter, Malibu Boats’s revenue fell by 5.8% year on year to $188.6 million but beat Wall Street’s estimates by 4%.
Looking ahead, sell-side analysts expect revenue to decline by 1.4% over the next 12 months. While this projection is better than its two-year trend, it’s tough to feel optimistic about a company facing demand difficulties.
6. Operating Margin
Operating margin is a key measure of profitability. Think of it as net income - the bottom line - excluding the impact of taxes and interest on debt, which are less connected to business fundamentals.
Malibu Boats’s operating margin has risen over the last 12 months, but it still averaged negative 5.3% over the last two years. This is due to its large expense base and inefficient cost structure.
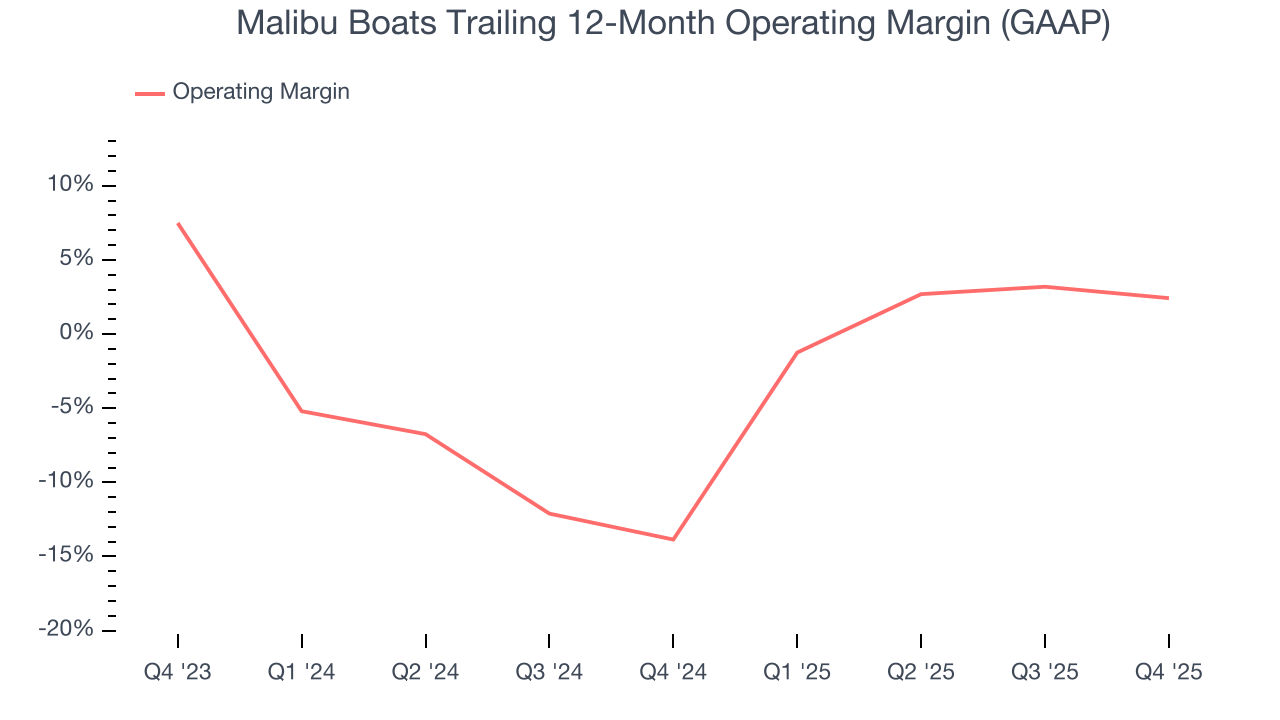
In Q4, Malibu Boats generated a negative 1.9% operating margin. The company's consistent lack of profits raise a flag.
7. Earnings Per Share
Revenue trends explain a company’s historical growth, but the long-term change in earnings per share (EPS) points to the profitability of that growth – for example, a company could inflate its sales through excessive spending on advertising and promotions.
Sadly for Malibu Boats, its EPS declined by 20% annually over the last five years while its revenue grew by 3.9%. This tells us the company became less profitable on a per-share basis as it expanded due to non-fundamental factors such as interest expenses and taxes.
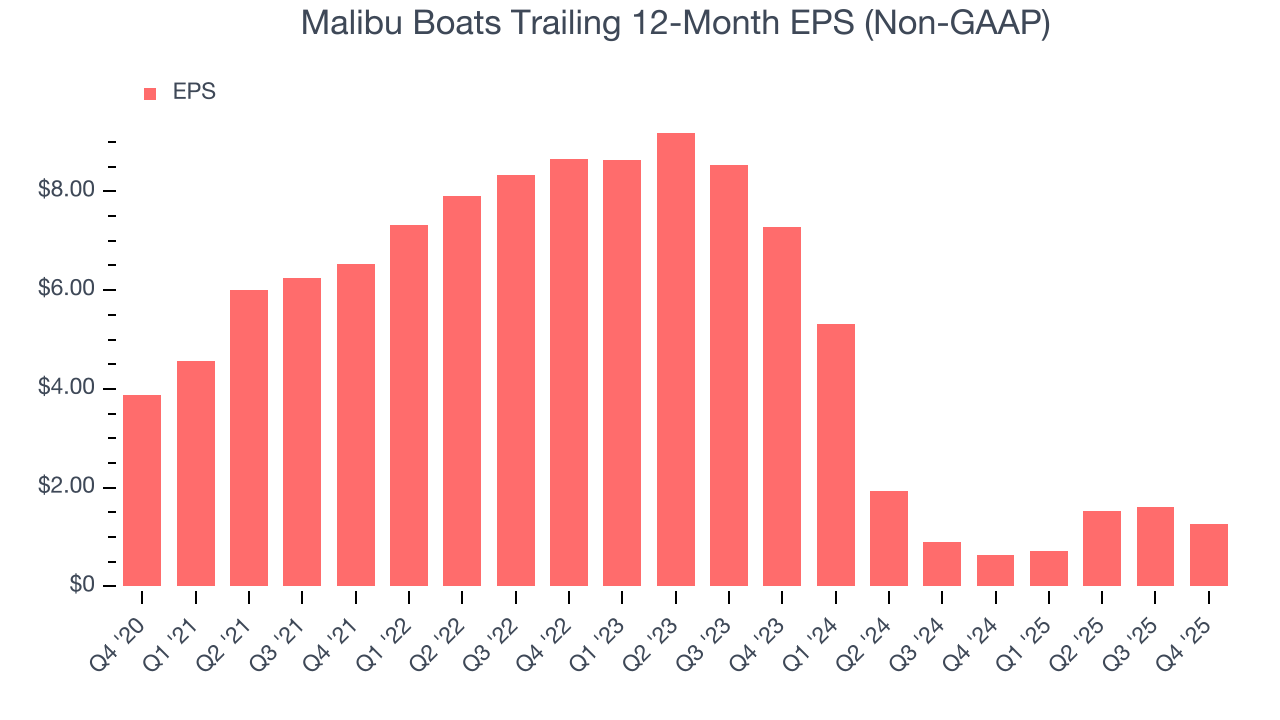
In Q4, Malibu Boats reported adjusted EPS of negative $0.02, down from $0.31 in the same quarter last year. This print missed analysts’ estimates. Over the next 12 months, Wall Street expects Malibu Boats’s full-year EPS of $1.27 to grow 17.1%.
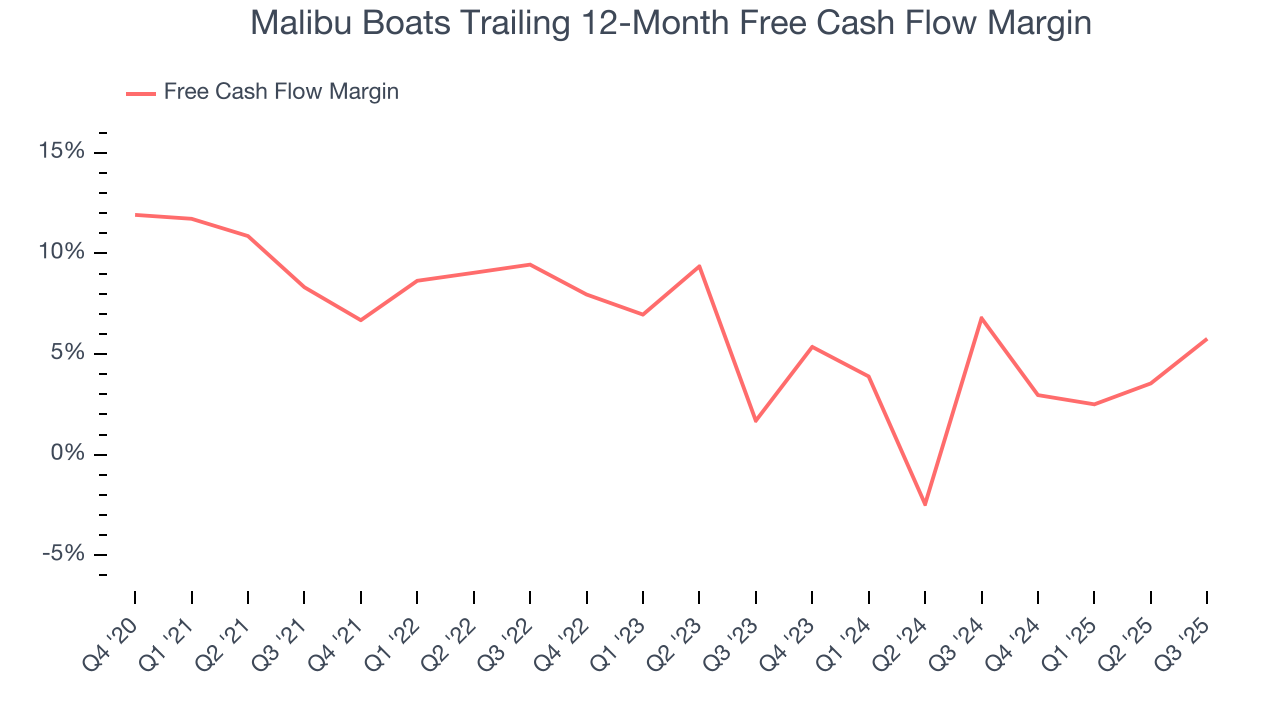
8. Cash Is King
If you’ve followed StockStory for a while, you know we emphasize free cash flow. Why, you ask? We believe that in the end, cash is king, and you can’t use accounting profits to pay the bills.
Malibu Boats has shown poor cash profitability over the last two years, giving the company limited opportunities to return capital to shareholders. Its free cash flow margin averaged 3.4%, lousy for a consumer discretionary business.
9. Return on Invested Capital (ROIC)
EPS and free cash flow tell us whether a company was profitable while growing its revenue. But was it capital-efficient? A company’s ROIC explains this by showing how much operating profit it makes compared to the money it has raised (debt and equity).
Malibu Boats historically did a mediocre job investing in profitable growth initiatives. Its five-year average ROIC was 10%, somewhat low compared to the best consumer discretionary companies that consistently pump out 25%+.
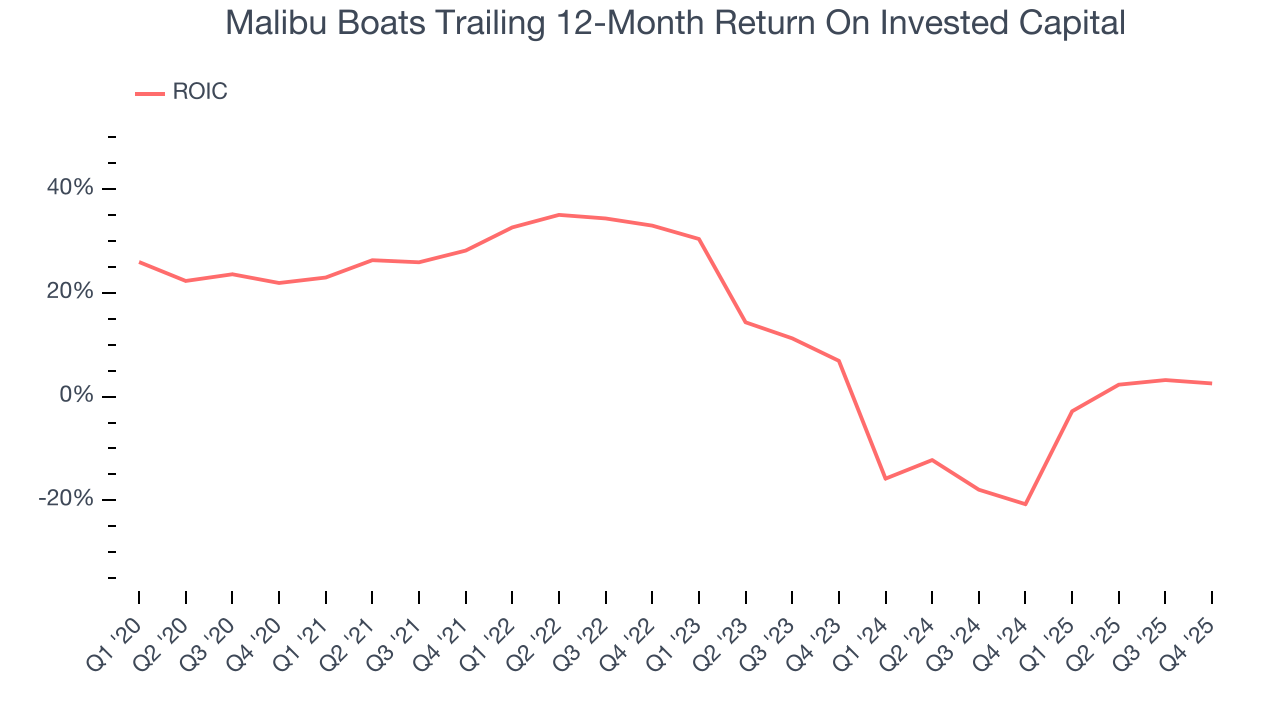
We like to invest in businesses with high returns, but the trend in a company’s ROIC is what often surprises the market and moves the stock price. Over the last few years, Malibu Boats’s ROIC has unfortunately decreased significantly. Paired with its already low returns, these declines suggest its profitable growth opportunities are few and far between.
10. Balance Sheet Assessment
One of the best ways to mitigate bankruptcy risk is to hold more cash than debt.
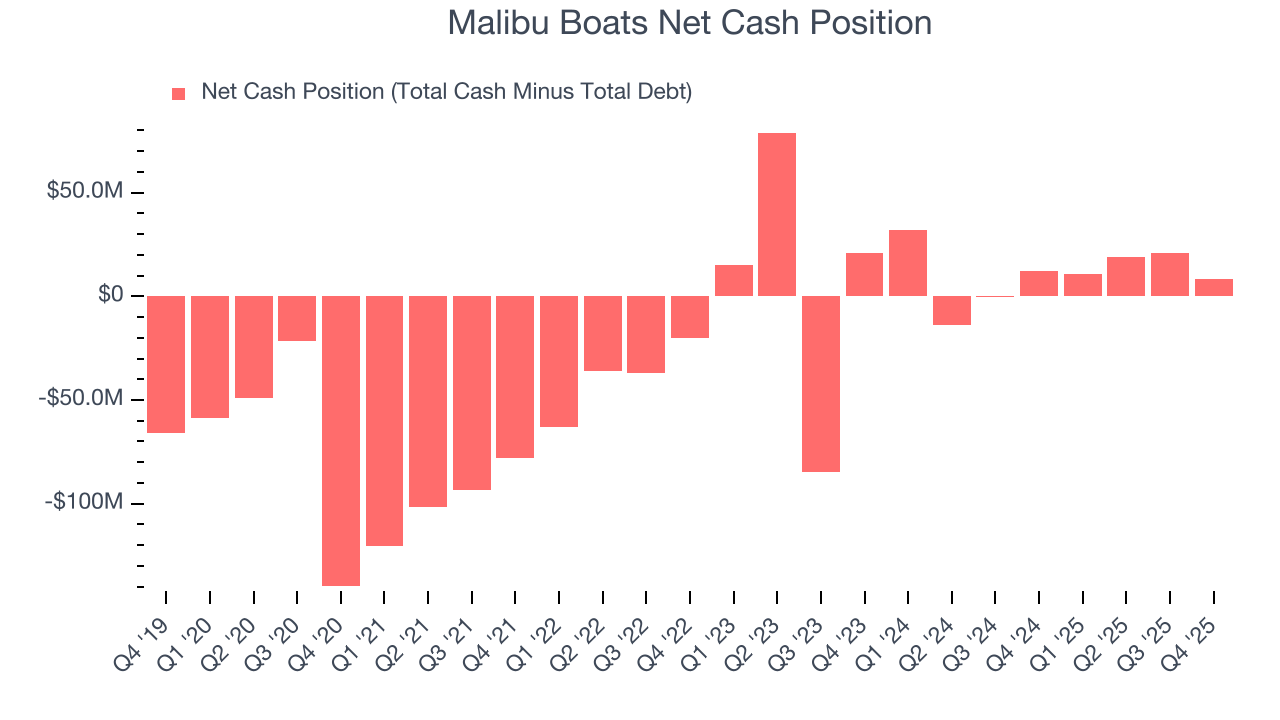
Malibu Boats is a profitable, well-capitalized company with $28.21 million of cash and $20 million of debt on its balance sheet. This $8.21 million net cash position gives it the freedom to borrow money, return capital to shareholders, or invest in growth initiatives. Leverage is not an issue here.
11. Key Takeaways from Malibu Boats’s Q4 Results
It was encouraging to see Malibu Boats beat analysts’ revenue expectations this quarter. On the other hand, its EPS missed and its EBITDA fell short of Wall Street’s estimates. Overall, this quarter could have been better. The stock remained flat at $34.54 immediately following the results.
12. Is Now The Time To Buy Malibu Boats?
Updated: March 17, 2026 at 11:15 PM EDT
Before investing in or passing on Malibu Boats, we urge you to understand the company’s business quality (or lack thereof), valuation, and the latest quarterly results - in that order.
Malibu Boats doesn’t pass our quality test. While its projected EPS for the next year implies the company’s fundamentals will improve, the downside is its declining EPS over the last five years makes it a less attractive asset to the public markets. On top of that, its relatively low ROIC suggests management has struggled to find compelling investment opportunities.
Malibu Boats’s P/E ratio based on the next 12 months is 15.3x. This valuation multiple is fair, but we don’t have much confidence in the company. There are superior stocks to buy right now.
Wall Street analysts have a consensus one-year price target of $35.22 on the company (compared to the current share price of $26.06).
Although the price target is bullish, readers should exercise caution because analysts tend to be overly optimistic. The firms they work for, often big banks, have relationships with companies that extend into fundraising, M&A advisory, and other rewarding business lines. As a result, they typically hesitate to say bad things for fear they will lose out. We at StockStory do not suffer from such conflicts of interest, so we’ll always tell it like it is.