
Nasdaq (NDAQ)
Nasdaq is a sound business. Its high 15.7% ROE signals its ability to invest in profitable projects.― StockStory Analyst Team
1. News


2. Summary
Why Nasdaq Is Interesting
Originally founded in 1971 as the world's first electronic stock market, Nasdaq (NASDAQ:NDAQ) operates global exchanges and provides technology, data, and corporate services that help companies, investors, and financial institutions navigate capital markets.
- ROE punches in at 15.7%, illustrating management’s expertise in identifying profitable investments
- 12.6% annual revenue growth over the last five years surpassed the sector average as its products resonated with customers
- The stock is expensive, and we believe it’s best to wait until its quality rises or its valuation falls


Nasdaq is close to becoming a high-quality business. You should keep tabs on this company.
Why Should You Watch Nasdaq


Nasdaq is trading at $86.13 per share, or 22.1x forward P/E. This valuation represents a premium to financials peers.
Nasdaq can improve its fundamentals over time by putting up good numbers quarter after quarter, year after year. Once that happens, we’ll be happy to recommend the stock.
3. Nasdaq (NDAQ) Research Report: Q4 CY2025 Update
Global exchange operator Nasdaq (NASDAQ:NDAQ) reported revenue ahead of Wall Streets expectations in Q4 CY2025, with sales up 69.5% year on year to $2.08 billion. Its non-GAAP profit of $0.96 per share was 4.8% above analysts’ consensus estimates.
Nasdaq (NDAQ) Q4 CY2025 Highlights:
- Revenue: $2.08 billion vs analyst estimates of $1.37 billion (69.5% year-on-year growth, 51.5% beat)
- Pre-tax Profit: $580 million (27.9% margin)
- Adjusted EPS: $0.96 vs analyst estimates of $0.92 (4.8% beat)
- Market Capitalization: $56.36 billion
Company Overview
Originally founded in 1971 as the world's first electronic stock market, Nasdaq (NASDAQ:NDAQ) operates global exchanges and provides technology, data, and corporate services that help companies, investors, and financial institutions navigate capital markets.
Nasdaq's business is organized into three segments: Market Services, Capital Access Platforms, and Financial Technology. The Market Services segment operates 19 exchanges across multiple asset classes including equities, options, fixed income, and commodities. In the U.S., Nasdaq runs The Nasdaq Stock Market—the largest single venue for trading U.S.-listed equities—along with five options exchanges and two additional cash equity exchanges.
The Capital Access Platforms segment serves corporate clients and investors through several key offerings. For companies, Nasdaq provides listing services on its exchanges, with over 4,000 companies listed on The Nasdaq Stock Market alone. This segment also includes the company's index business, which develops and licenses Nasdaq-branded indices like the flagship Nasdaq-100 Index that tracks the largest non-financial companies listed on its exchange. Additionally, Nasdaq offers investor relations, governance, and ESG solutions to help companies manage shareholder relationships and meet regulatory requirements.
The Financial Technology segment delivers technology solutions to exchanges, clearing organizations, regulators, banks, and brokers worldwide. This includes market surveillance systems that help detect market manipulation, anti-financial crime software through its Verafin platform, and trading technology that powers more than 130 marketplaces in over 55 countries. A financial institution might use Nasdaq's Verafin solution to detect money laundering activities across its network, while an exchange in Asia could license Nasdaq's trading platform to power its marketplace operations.
Nasdaq generates revenue through transaction fees from trading activity on its exchanges, subscription fees for data services, licensing fees for its indices, and recurring revenue from its technology and corporate solutions. The company has expanded beyond its traditional exchange business to become a significant technology provider to the global financial ecosystem.
4. Financial Exchanges & Data
Financial exchanges and data providers operate trading platforms and sell market information. They enjoy relatively stable revenue from trading fees and subscriptions, increasing demand for data analytics, and expansion opportunities in emerging markets. Challenges include regulatory oversight of market structure, competition from alternative trading venues, and substantial technology investments needed to maintain low-latency trading infrastructure and data security.
Nasdaq's competitors vary by business segment. In exchange services, it competes with Intercontinental Exchange (NYSE:ICE), Cboe Global Markets (BATS:CBOE), and London Stock Exchange Group (LSE:LSE). In market technology and data, competitors include CME Group (NASDAQ:CME), S&P Global (NYSE:SPGI), MSCI (NYSE:MSCI), and FactSet (NYSE:FDS).
5. Revenue Growth
A company’s long-term sales performance is one signal of its overall quality. Any business can have short-term success, but a top-tier one grows for years. Thankfully, Nasdaq’s 15.4% annualized revenue growth over the last five years was impressive. Its growth beat the average financials company and shows its offerings resonate with customers.
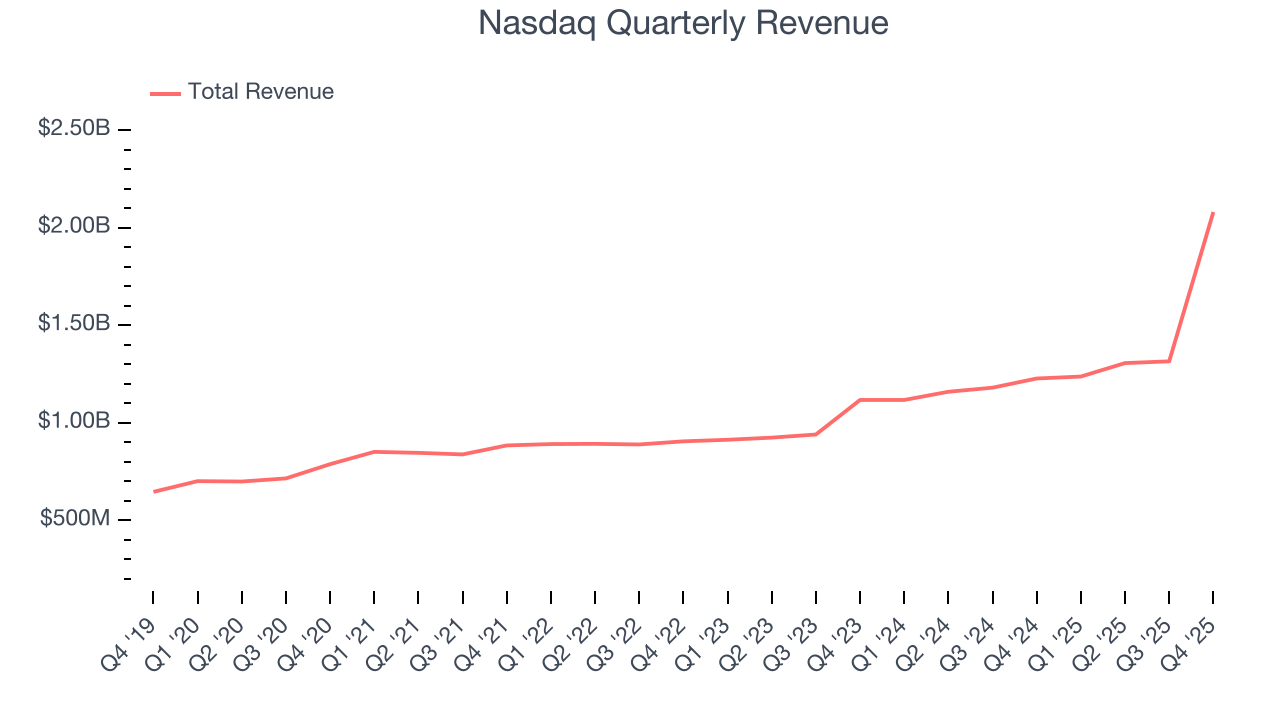
We at StockStory place the most emphasis on long-term growth, but within financials, a half-decade historical view may miss recent interest rate changes, market returns, and industry trends. Nasdaq’s annualized revenue growth of 23.5% over the last two years is above its five-year trend, suggesting its demand was strong and recently accelerated. 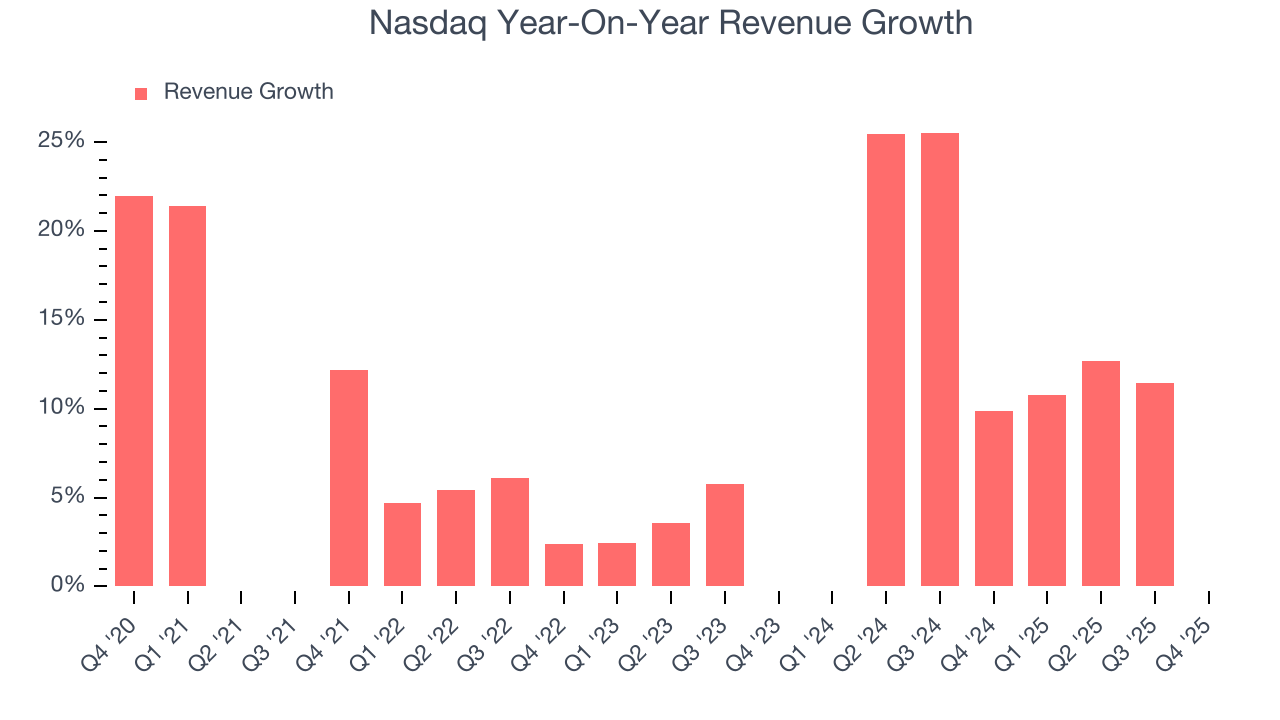 Note: Quarters not shown were determined to be outliers, impacted by outsized investment gains/losses that are not indicative of the recurring fundamentals of the business.
This quarter, Nasdaq reported magnificent year-on-year revenue growth of 69.5%, and its $2.08 billion of revenue beat Wall Street’s estimates by 51.5%.
6. Pre-Tax Profit Margin
Revenue growth is one major determinant of business quality, and the efficiency of operations is another. For Financial Exchanges & Data companies, we look at pre-tax profit rather than the operating margin that defines sectors such as consumer, tech, and industrials.
Interest income and expenses play a big role in financial institutions' profitability, so they should be factored into the definition of profit. Taxes, however, should not as they are largely out of a company's control. This is pre-tax profit by definition.
Over the last five years, Nasdaq’s pre-tax profit margin has risen by 5.7 percentage points, going from 44.9% to 36.1%. Expenses have stabilized more recently as the company’s pre-tax profit margin was flat on a two-year basis.
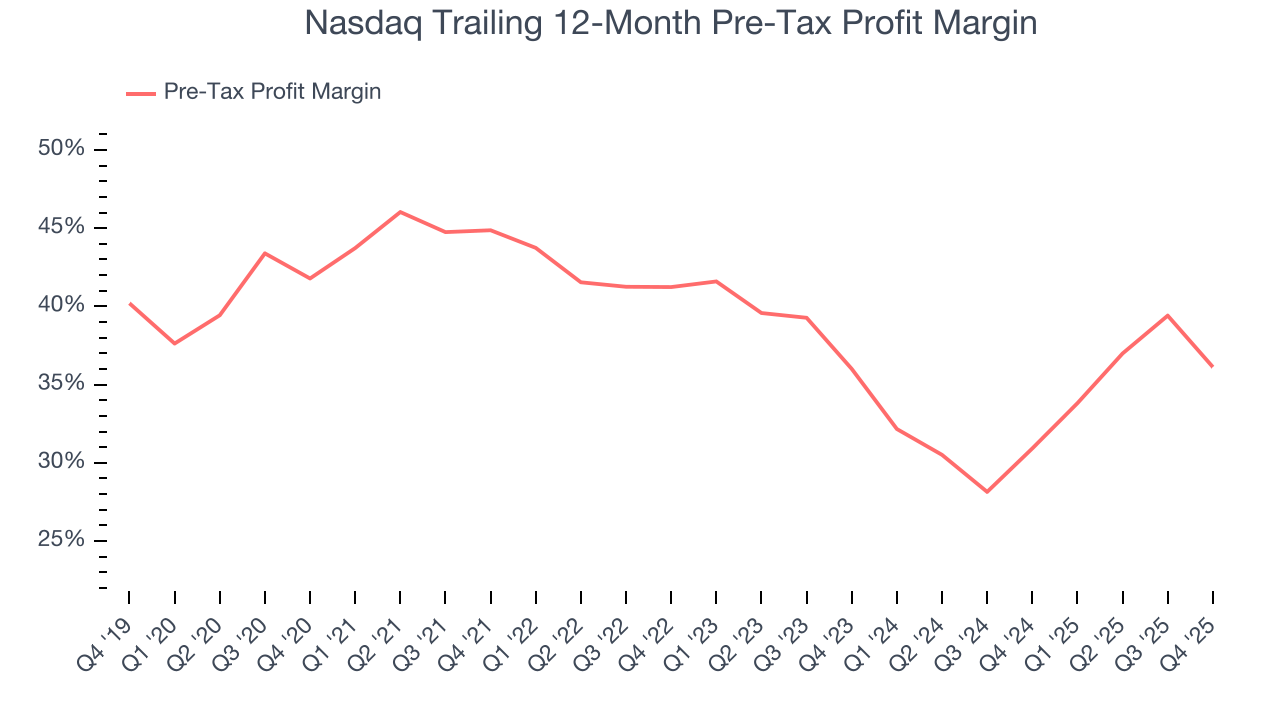
In Q4, Nasdaq’s pre-tax profit margin was 27.9%. This result was 7.9 percentage points worse than the same quarter last year.
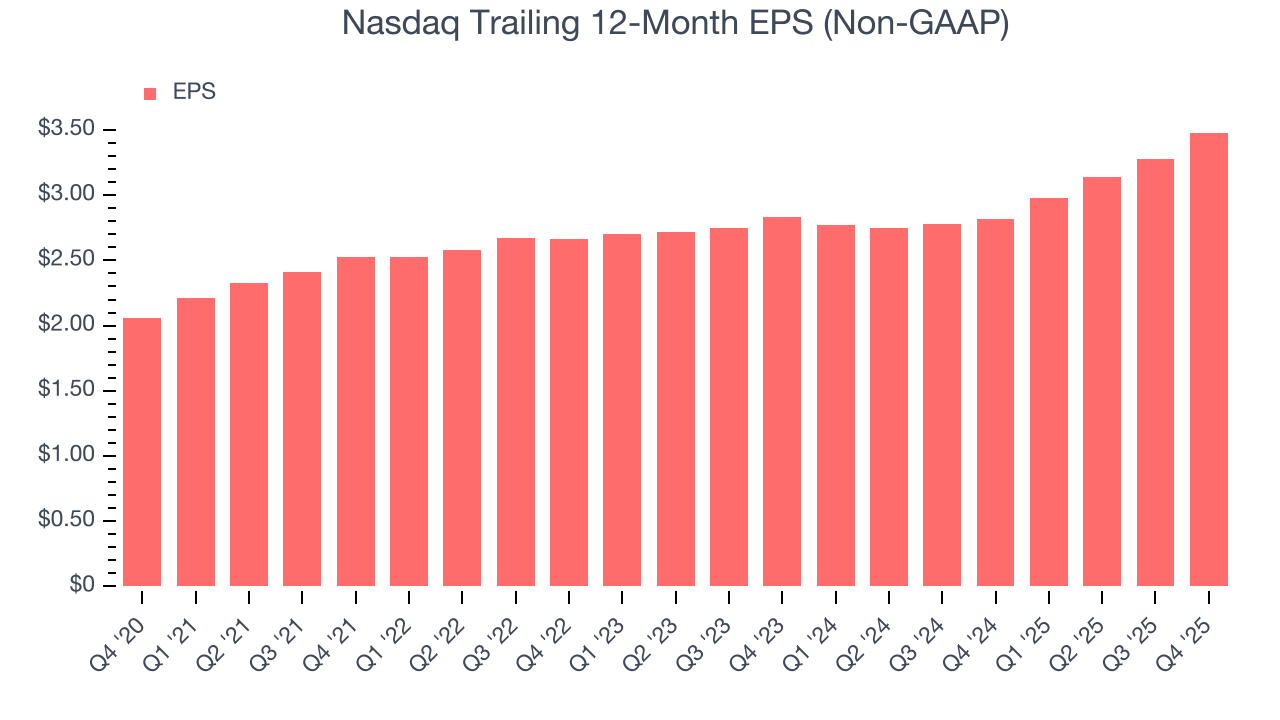
7. Earnings Per Share
Revenue trends explain a company’s historical growth, but the long-term change in earnings per share (EPS) points to the profitability of that growth – for example, a company could inflate its sales through excessive spending on advertising and promotions.
Nasdaq’s EPS grew at a decent 11.1% compounded annual growth rate over the last five years. However, this performance was lower than its 15.4% annualized revenue growth, telling us the company became less profitable on a per-share basis as it expanded.
Like with revenue, we analyze EPS over a more recent period because it can provide insight into an emerging theme or development for the business.
For Nasdaq, its two-year annual EPS growth of 10.9% is similar to its five-year trend, implying stable earnings power.
In Q4, Nasdaq reported adjusted EPS of $0.96, up from $0.76 in the same quarter last year. This print beat analysts’ estimates by 4.8%. Over the next 12 months, Wall Street expects Nasdaq’s full-year EPS of $3.48 to grow 11%.
8. Return on Equity
Return on equity (ROE) reveals the profit generated per dollar of shareholder equity, which represents a key source of bank funding. Banks maintaining elevated ROE levels tend to accelerate wealth creation for shareholders via earnings retention, buybacks, and distributions.
Over the last five years, Nasdaq has averaged an ROE of 15.6%, healthy for a company operating in a sector where the average shakes out around 10% and those putting up 25%+ are greatly admired. This is a bright spot for Nasdaq.
9. Balance Sheet Assessment
The debt-to-equity ratio is a widely used measure to assess a company's balance sheet health. A higher ratio means that a business aggressively financed its growth with debt. This can result in higher earnings (if the borrowed funds are invested profitably) but also increases risk.
If debt levels are too high, there could be difficulties in meeting obligations, especially during economic downturns or periods of rising interest rates if the debt has variable-rate payments.
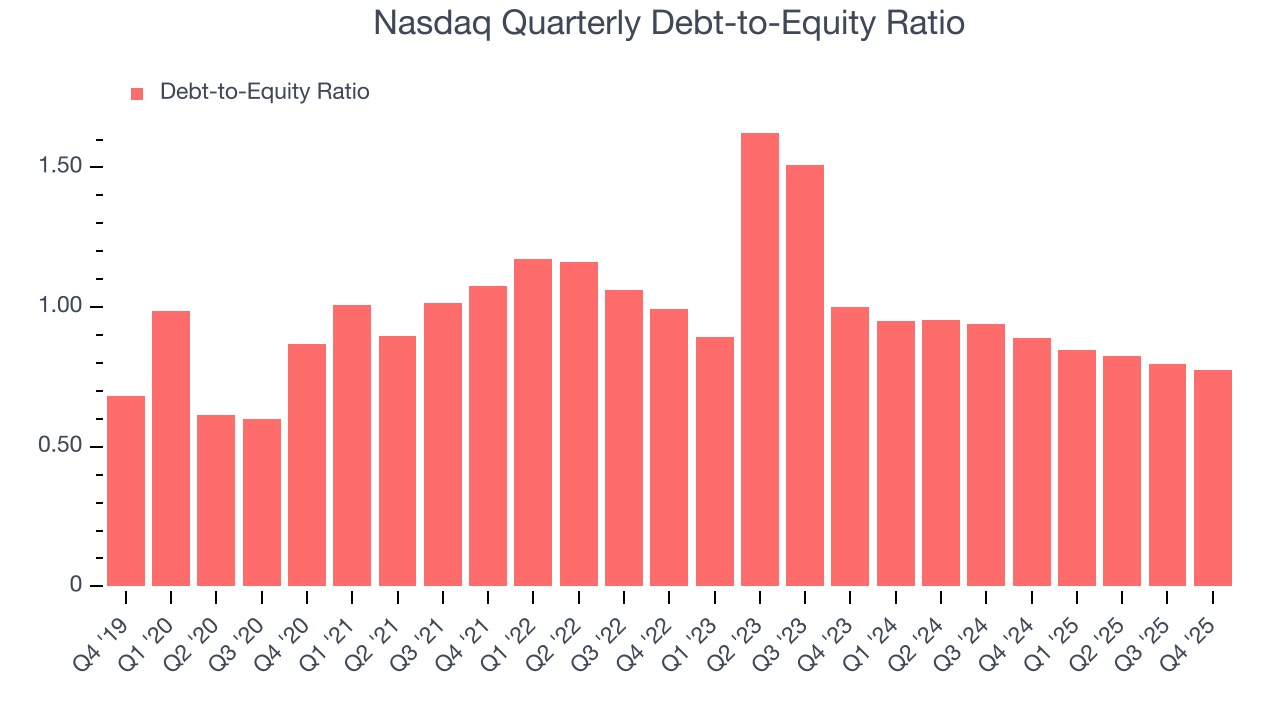
Nasdaq currently has $9.47 billion of debt and $12.23 billion of shareholder's equity on its balance sheet, and over the past four quarters, has averaged a debt-to-equity ratio of 0.8×. We think this is safe and raises no red flags. In general, we’re comfortable with any ratio below 3.5× for a financials business.
10. Key Takeaways from Nasdaq’s Q4 Results
We were impressed by how significantly Nasdaq blew past analysts’ revenue expectations this quarter. We were also glad its EPS outperformed Wall Street’s estimates. Zooming out, we think this was a good print with some key areas of upside. The stock traded up 1.9% to $100.59 immediately after reporting.
11. Is Now The Time To Buy Nasdaq?
Updated: March 24, 2026 at 12:27 AM EDT
Before deciding whether to buy Nasdaq or pass, we urge investors to consider business quality, valuation, and the latest quarterly results.
There are things to like about Nasdaq. To kick things off, its revenue growth was solid over the last five years. And while its pre-tax profit margin didn’t move over the last five years, its solid ROE suggests it has grown profitably in the past.
Nasdaq’s P/E ratio based on the next 12 months is 22.1x. This valuation tells us that a lot of optimism is priced in. This is a good one to add to your watchlist - there are better opportunities elsewhere at the moment.
Wall Street analysts have a consensus one-year price target of $108.40 on the company (compared to the current share price of $86.13).