Nova (NVMI)
Nova is an exciting business. Its combination of extraordinary growth and robust profitability makes it a beloved asset.― StockStory Analyst Team
1. News

2. Summary
Why We Like Nova
Headquartered in Israel, Nova (NASDAQ:NVMI) is a provider of quality control systems used in semiconductor manufacturing.
- Annual revenue growth of 26.7% over the past five years was outstanding, reflecting market share gains this cycle
- Earnings per share grew by 33.2% annually over the last five years and trumped its peers
- Impressive free cash flow profitability enables the company to fund new investments or reward investors with share buybacks/dividends


We expect great things from Nova. The price seems reasonable when considering its quality, so this might be a prudent time to invest in some shares.
Why Is Now The Time To Buy Nova?


Nova’s stock price of $459.01 implies a valuation ratio of 43.1x forward P/E. Yes, the stock’s seemingly high valuation multiple could mean short-term volatility. But given its business quality, we think the multiple is justified.
Entry price may seem important in the moment, but our work shows that time and again, long-term market outperformance is determined by business quality rather than getting an absolute bargain on a stock.
3. Nova (NVMI) Research Report: Q4 CY2025 Update
Semiconductor quality control company Nova (NASDAQ:NVMI) beat Wall Street’s revenue expectations in Q4 CY2025, with sales up 14.3% year on year to $222.6 million. Guidance for next quarter’s revenue was better than expected at $227 million at the midpoint, 1.3% above analysts’ estimates. Its non-GAAP profit of $2.14 per share was 0.7% above analysts’ consensus estimates.
Nova (NVMI) Q4 CY2025 Highlights:
- Revenue: $222.6 million vs analyst estimates of $221.1 million (14.3% year-on-year growth, 0.7% beat)
- Adjusted EPS: $2.14 vs analyst estimates of $2.12 (0.7% beat)
- Revenue Guidance for Q1 CY2026 is $227 million at the midpoint, above analyst estimates of $224.1 million
- Adjusted EPS guidance for Q1 CY2026 is $2.19 at the midpoint, above analyst estimates of $2.15
- Operating Margin: 27.3%, down from 28.5% in the same quarter last year
- Free Cash Flow Margin: 21.7%, down from 31% in the same quarter last year
- Inventory Days Outstanding: 177, up from 171 in the previous quarter
- Market Capitalization: $14.11 billion
Company Overview
Headquartered in Israel, Nova (NASDAQ:NVMI) is a provider of quality control systems used in semiconductor manufacturing.
Nova was founded in May 1993 by Giora Dishon and Moshe Finarov. Dishon held a Phd in materials science and Finarov a Phd in semiconductor physics. The company went public in April of 2000 with a NASDAQ listing.
Semiconductor manufacturing begins with a silicon wafer upon which chips are constructed through the application of thin layers of film that act as conductors, semiconductors, or insulators. Precision is key, as deviations in materials, measurements, or temperatures could result in defects. Strong quality and process control therefore involves constant monitoring and measurement of the silicon wafers and manufacturing environment through each step of the process. Trends in the semiconductor market such as smaller form factors and increases in 3D technology increase the need for improved quality and process control.
Nova’s product portfolio includes a range of metrology (measurement) technologies applied to dimensional, film, material, and chemical measurements across the semiconductor manufacturing process. Nova goes to market with two product divisions. The ‘Dimensional Metrology Division’ (DMD) uses optical measurement technologies while the ‘Materials Metrology Division’ (MMD) employs x-ray based solutions. Accompanying these products is a suite of software that enables customers to model and design elements needed in the semiconductor manufacturing process.
Competitors offering semiconductor process control systems include KLA Corporation (NASDAQ:KLAC), ASML Holdings (NASDAQ:ASML), Lam Research (NASDAQ:LRCX), and Thermo Fisher Scientific (NYSE:TMO).
4. Revenue Growth
Reviewing a company’s long-term sales performance reveals insights into its quality. Any business can put up a good quarter or two, but the best consistently grow over the long haul. Thankfully, Nova’s 26.7% annualized revenue growth over the last five years was incredible. Its growth surpassed the average semiconductor company and shows its offerings resonate with customers, a great starting point for our analysis. Semiconductors are a cyclical industry, and long-term investors should be prepared for periods of high growth followed by periods of revenue contractions (which can sometimes offer opportune times to buy).
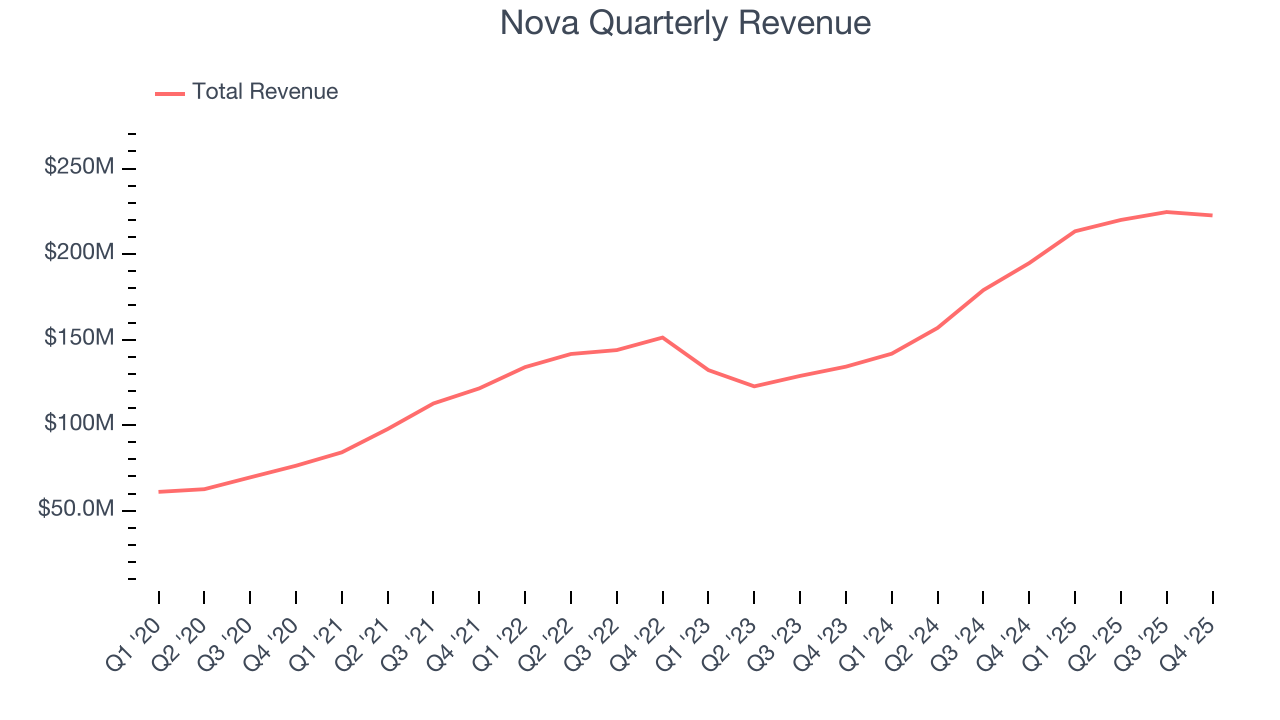
Long-term growth is the most important, but short-term results matter for semiconductors because the rapid pace of technological innovation (Moore's Law) could make yesterday's hit product obsolete today. Nova’s annualized revenue growth of 30.4% over the last two years is above its five-year trend, suggesting its demand was strong and recently accelerated. 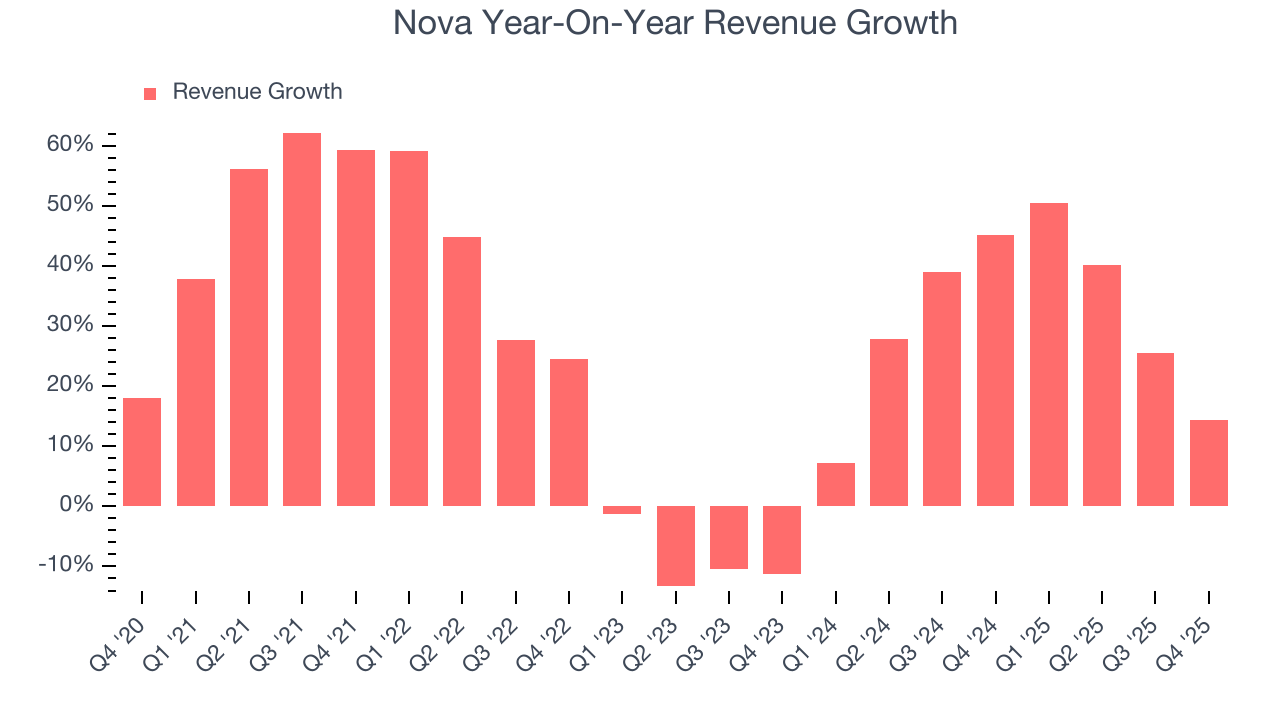
This quarter, Nova reported year-on-year revenue growth of 14.3%, and its $222.6 million of revenue exceeded Wall Street’s estimates by 0.7%. Despite the beat, this was its third consecutive quarter of decelerating growth, potentially indicating a coming cyclical downturn. Company management is currently guiding for a 6.4% year-on-year increase in sales next quarter.
Looking further ahead, sell-side analysts expect revenue to grow 11.6% over the next 12 months, a deceleration versus the last two years. This projection doesn't excite us and implies its products and services will see some demand headwinds. At least the company is tracking well in other measures of financial health.
5. Product Demand & Outstanding Inventory
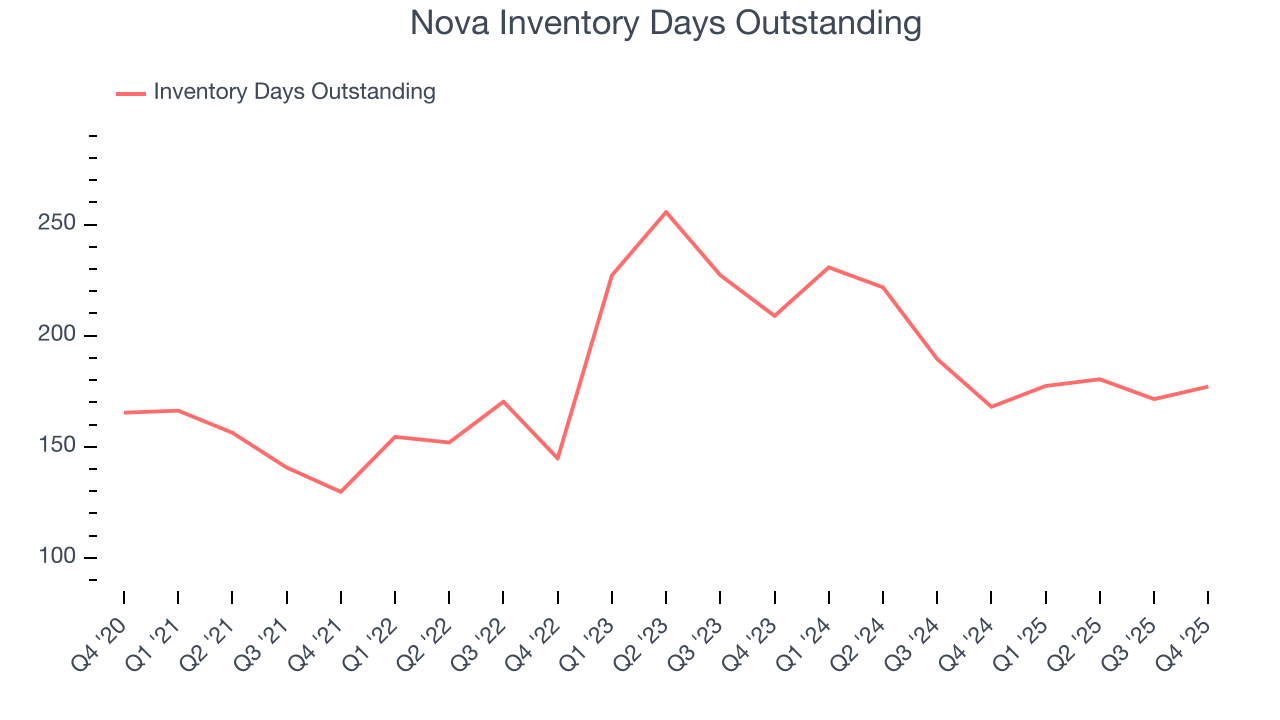
Days Inventory Outstanding (DIO) is an important metric for chipmakers, as it reflects a business’ capital intensity and the cyclical nature of semiconductor supply and demand. In a tight supply environment, inventories tend to be stable, allowing chipmakers to exert pricing power. Steadily increasing DIO can be a warning sign that demand is weak, and if inventories continue to rise, the company may have to downsize production.
This quarter, Nova’s DIO came in at 177, which is 5 days below its five-year average. These numbers show that despite the recent increase, there’s no indication of an excessive inventory buildup.
6. Gross Margin & Pricing Power
In the semiconductor industry, a company’s gross profit margin is a critical metric to track because it sheds light on its pricing power, complexity of products, and ability to procure raw materials, equipment, and labor.
Nova’s gross margin is well ahead of its semiconductor peers, and its strong pricing power is an output of its differentiated, value-add products. As you can see below, it averaged an excellent 57.6% gross margin over the last two years. That means Nova only paid its suppliers $42.40 for every $100 in revenue. 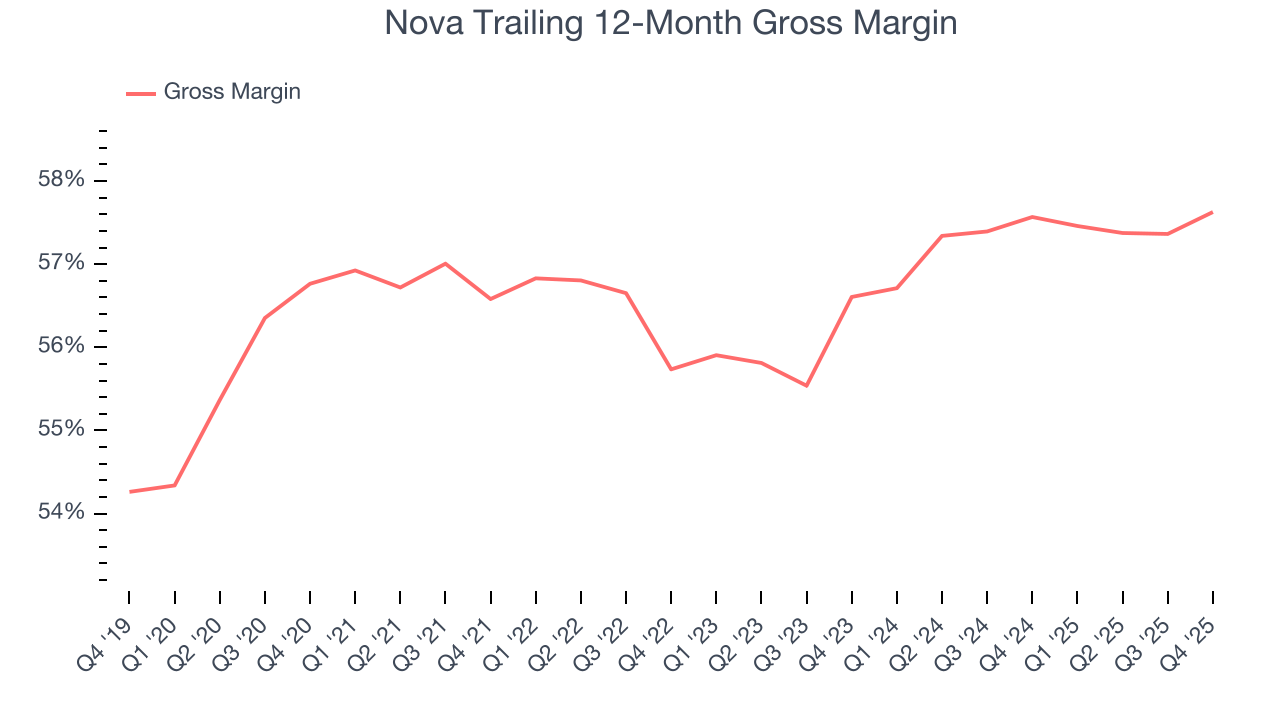
This quarter, Nova’s gross profit margin was 57.6%, up 1.2 percentage points year on year. Zooming out, the company’s full-year margin has remained steady over the past 12 months, suggesting its input costs (such as raw materials and manufacturing expenses) have been stable and it isn’t under pressure to lower prices.
7. Operating Margin
Operating margin is a key measure of profitability. Think of it as net income - the bottom line - excluding the impact of taxes and interest on debt, which are less connected to business fundamentals.
Nova has been an efficient company over the last two years. It was one of the more profitable businesses in the semiconductor sector, boasting an average operating margin of 28.4%. This result isn’t surprising as its high gross margin gives it a favorable starting point.
Looking at the trend in its profitability, Nova’s operating margin rose by 1.8 percentage points over the last five years, as its sales growth gave it operating leverage.
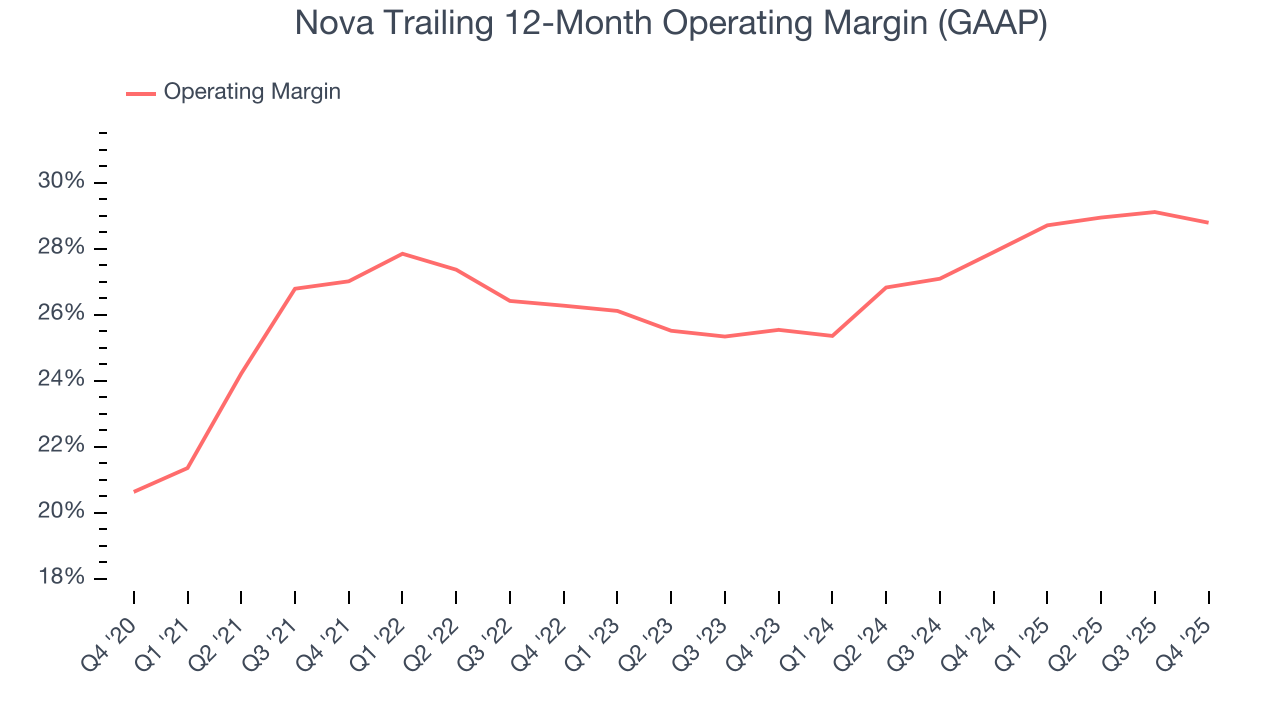
In Q4, Nova generated an operating margin profit margin of 27.3%, down 1.2 percentage points year on year. Conversely, its revenue and gross margin actually rose, so we can assume it was less efficient because its operating expenses like marketing, R&D, and administrative overhead grew faster than its revenue.
8. Earnings Per Share
Revenue trends explain a company’s historical growth, but the long-term change in earnings per share (EPS) points to the profitability of that growth – for example, a company could inflate its sales through excessive spending on advertising and promotions.
Nova’s EPS grew at an astounding 33.2% compounded annual growth rate over the last five years, higher than its 26.7% annualized revenue growth. This tells us the company became more profitable on a per-share basis as it expanded.
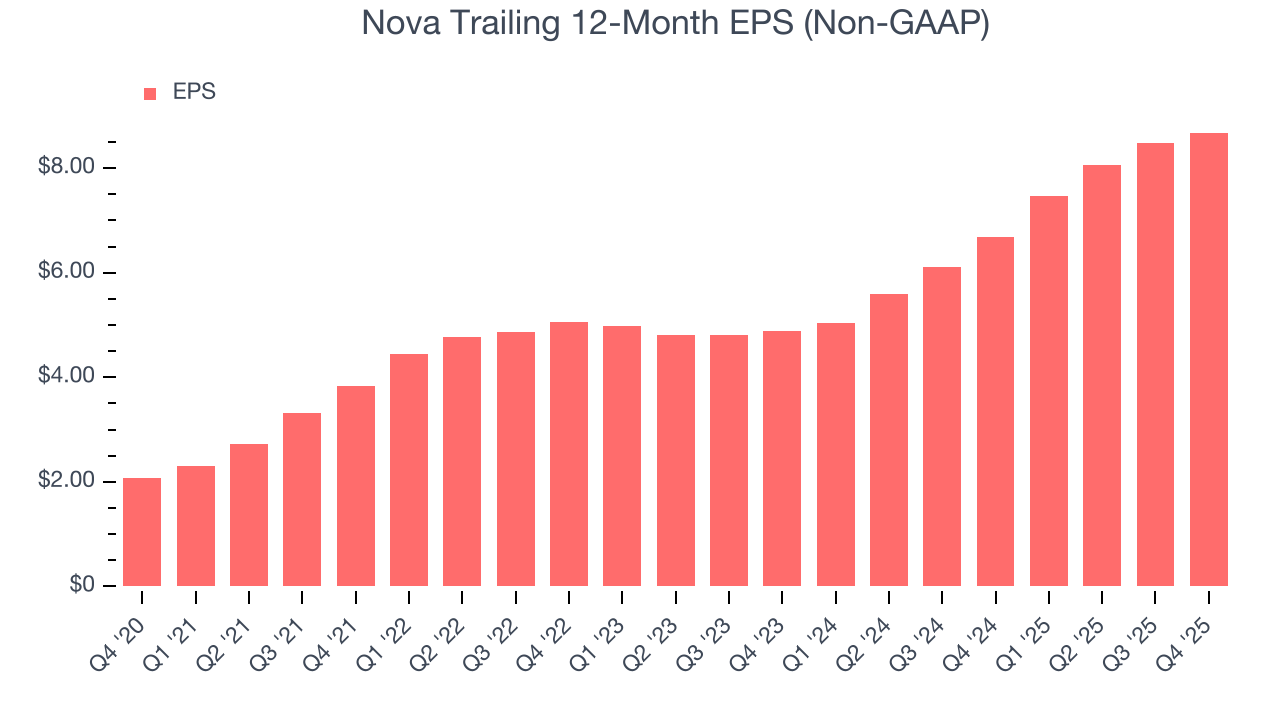
Diving into Nova’s quality of earnings can give us a better understanding of its performance. As we mentioned earlier, Nova’s operating margin declined this quarter but expanded by 1.8 percentage points over the last five years. This was the most relevant factor (aside from the revenue impact) behind its higher earnings; interest expenses and taxes can also affect EPS but don’t tell us as much about a company’s fundamentals.
In Q4, Nova reported adjusted EPS of $2.14, up from $1.94 in the same quarter last year. This print was close to analysts’ estimates. Over the next 12 months, Wall Street expects Nova’s full-year EPS of $8.68 to grow 12.5%.
9. Cash Is King
Free cash flow isn't a prominently featured metric in company financials and earnings releases, but we think it's telling because it accounts for all operating and capital expenses, making it tough to manipulate. Cash is king.
Nova has shown terrific cash profitability, and if sustainable, puts it in an advantageous position to invest in new products, return capital to investors, and consolidate the market during industry downturns. The company’s free cash flow margin was among the best in the semiconductor sector, averaging 28.1% over the last two years.
Taking a step back, we can see that Nova’s margin dropped by 5.9 percentage points over the last five years. If its declines continue, it could signal increasing investment needs and capital intensity.
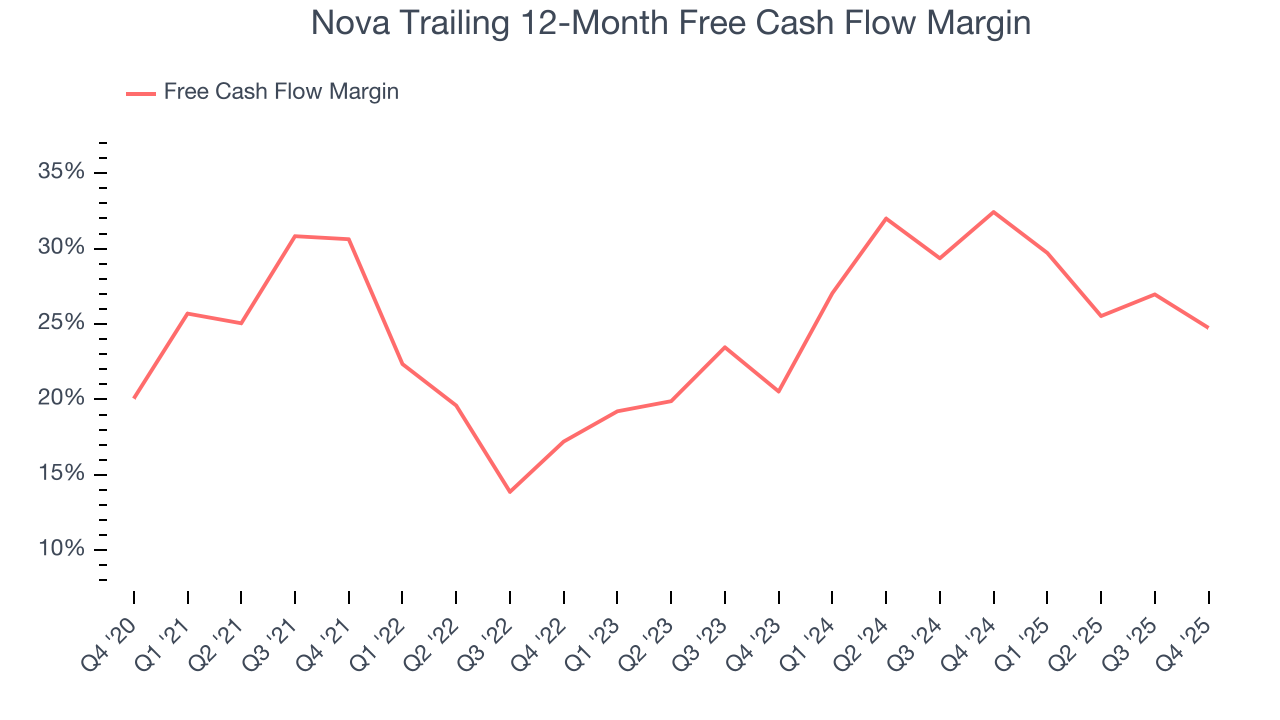
Nova’s free cash flow clocked in at $48.36 million in Q4, equivalent to a 21.7% margin. The company’s cash profitability regressed as it was 9.3 percentage points lower than in the same quarter last year, which isn’t ideal considering its longer-term trend.
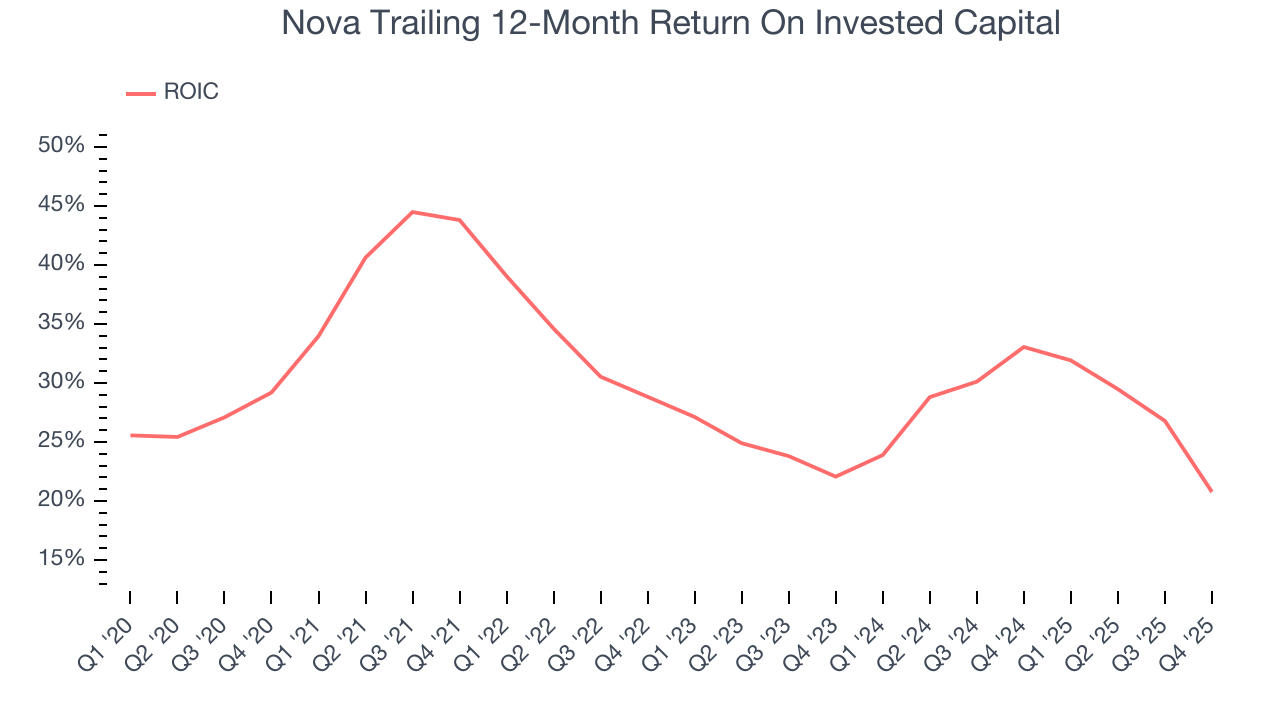
10. Return on Invested Capital (ROIC)
EPS and free cash flow tell us whether a company was profitable while growing its revenue. But was it capital-efficient? A company’s ROIC explains this by showing how much operating profit it makes compared to the money it has raised (debt and equity).
Nova’s five-year average ROIC was 29.7%, beating other semiconductor companies by a wide margin. This illustrates its management team’s ability to invest in attractive growth opportunities and produce tangible results for shareholders.
11. Balance Sheet Assessment
Companies with more cash than debt have lower bankruptcy risk.
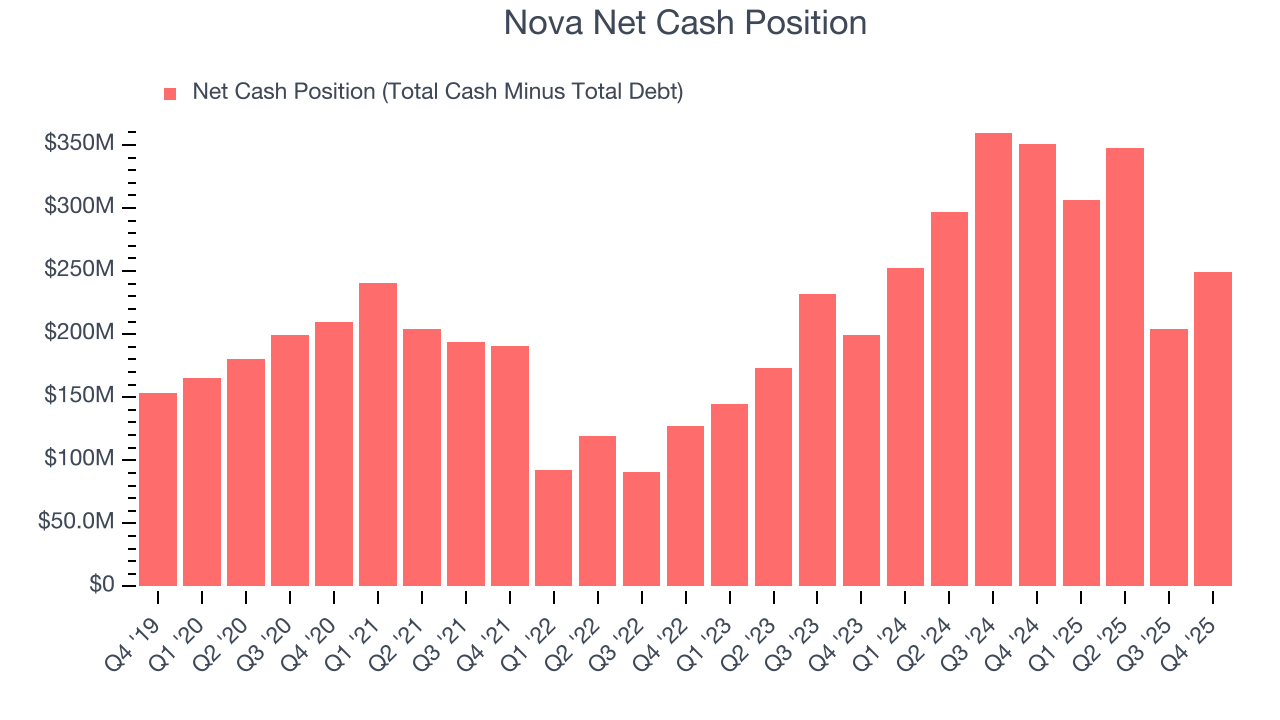
Nova is a profitable, well-capitalized company with $1.05 billion of cash and $799.2 million of debt on its balance sheet. This $249.4 million net cash position gives it the freedom to borrow money, return capital to shareholders, or invest in growth initiatives. Leverage is not an issue here.
12. Key Takeaways from Nova’s Q4 Results
It was good to see Nova provide revenue guidance for next quarter that slightly beat analysts’ expectations. On the other hand, its inventory levels increased. Zooming out, we think this was a mixed quarter. The market seemed to be hoping for more, and the stock traded down 4.3% to $455.56 immediately after reporting.
13. Is Now The Time To Buy Nova?
Updated: February 24, 2026 at 9:30 PM EST
Before investing in or passing on Nova, we urge you to understand the company’s business quality (or lack thereof), valuation, and the latest quarterly results - in that order.
Nova is a rock-solid business worth owning. First of all, the company’s revenue growth was exceptional over the last five years. And while its cash profitability fell over the last five years, its astounding EPS growth over the last five years shows its profits are trickling down to shareholders. On top of that, Nova’s powerful free cash flow generation enables it to stay ahead of the competition through consistent reinvestment of profits.
Nova’s P/E ratio based on the next 12 months is 43.1x. This valuation may appear high at first glance, but the multiple is deserved because Nova’s fundamentals really stand out. We think the stock is attractive here.
Wall Street analysts have a consensus one-year price target of $501.86 on the company (compared to the current share price of $459.01), implying they see 9.3% upside in buying Nova in the short term.