
OceanFirst Financial (OCFC)
OceanFirst Financial faces an uphill battle. Its sales have underperformed and its low returns on capital show it has few growth opportunities.― StockStory Analyst Team
1. News


2. Summary
Why We Think OceanFirst Financial Will Underperform
Tracing its roots back to 1902 when it began serving coastal New Jersey communities, OceanFirst Financial (NASDAQ:OCFC) operates as a regional bank holding company that provides commercial and consumer banking services primarily in New Jersey and surrounding metropolitan areas.
- Sales were flat over the last two years, indicating it’s failed to expand this cycle
- Performance over the past two years shows each sale was less profitable, as its earnings per share fell by 10.4% annually
- Forecasted tangible book value per share decline of 2.4% for the upcoming 12 months implies profitability will deteriorate significantly


OceanFirst Financial doesn’t meet our quality standards. We believe there are better opportunities elsewhere.
Why There Are Better Opportunities Than OceanFirst Financial


At $18.05 per share, OceanFirst Financial trades at 0.7x forward P/B. OceanFirst Financial’s valuation may seem like a great deal, but we think there are valid reasons why it’s so cheap.
Cheap stocks can look like great bargains at first glance, but you often get what you pay for. These mediocre businesses often have less earnings power, meaning there is more reliance on a re-rating to generate good returns - an unlikely scenario for low-quality companies.
3. OceanFirst Financial (OCFC) Research Report: Q4 CY2025 Update
Regional bank OceanFirst Financial (NASDAQ:OCFC) announced better-than-expected revenue in Q4 CY2025, with sales up 9.5% year on year to $104.7 million. Its non-GAAP profit of $0.58 per share was 58.9% above analysts’ consensus estimates.
OceanFirst Financial (OCFC) Q4 CY2025 Highlights:
- Net Interest Income: $95.28 million vs analyst estimates of $94.34 million (14.3% year-on-year growth, 1% beat)
- Net Interest Margin: 2.9% vs analyst estimates of 2.9% (in line)
- Revenue: $104.7 million vs analyst estimates of $102.7 million (9.5% year-on-year growth, 1.9% beat)
- Efficiency Ratio: 80.4% vs analyst estimates of 68.9% (1,145.3 basis point miss)
- Adjusted EPS: $0.58 vs analyst estimates of $0.37 (58.9% beat)
- Tangible Book Value per Share: $19.79 vs analyst estimates of $19.62 (flat year on year, 0.9% beat)
- Market Capitalization: $1.09 billion
Company Overview
Tracing its roots back to 1902 when it began serving coastal New Jersey communities, OceanFirst Financial (NASDAQ:OCFC) operates as a regional bank holding company that provides commercial and consumer banking services primarily in New Jersey and surrounding metropolitan areas.
OceanFirst operates through its primary subsidiary, OceanFirst Bank N.A., offering a range of financial products and services to businesses and individuals. The bank's lending activities focus heavily on commercial real estate loans for properties used as office spaces, industrial facilities, multi-family housing, and retail establishments. These loans are provided to both owner-occupied properties and investor-owned properties, typically with adjustable rates or fixed terms up to ten years.
Beyond real estate lending, OceanFirst provides commercial and industrial loans for working capital, equipment purchases, and business acquisitions. For individual consumers, the bank offers residential mortgages, home equity products, and other personal loans. A typical residential mortgage customer might be a family purchasing their first home in central New Jersey or a professional buying a vacation property along the Jersey shore.
OceanFirst funds its lending operations primarily through customer deposits, which include checking accounts, savings accounts, money market accounts, and certificates of deposit. The bank serves customers through branch locations throughout central and southern New Jersey and the metropolitan areas of New York City and Philadelphia, with additional commercial loan production offices in Baltimore and Boston.
The company generates revenue primarily from interest on loans and investments, supplemented by fees from services like bankcard operations, trust and asset management, and commercial loan swap programs. OceanFirst also maintains subsidiaries that handle specialized functions such as investment securities management, real estate investment, and title insurance services.
4. Regional Banks
Regional banks, financial institutions operating within specific geographic areas, serve as intermediaries between local depositors and borrowers. They benefit from rising interest rates that improve net interest margins (the difference between loan yields and deposit costs), digital transformation reducing operational expenses, and local economic growth driving loan demand. However, these banks face headwinds from fintech competition, deposit outflows to higher-yielding alternatives, credit deterioration (increasing loan defaults) during economic slowdowns, and regulatory compliance costs. Recent concerns about regional bank stability following high-profile failures and significant commercial real estate exposure present additional challenges.
OceanFirst Financial competes with other regional banks operating in the New Jersey and greater metropolitan areas including Valley National Bank (NASDAQ:VLY), Provident Financial Services (NYSE:PFS), and Investors Bancorp, as well as larger national institutions like Bank of America (NYSE:BAC), JPMorgan Chase (NYSE:JPM), and Wells Fargo (NYSE:WFC).
5. Sales Growth
From lending activities to service fees, most banks build their revenue model around two income sources. Interest rate spreads between loans and deposits create the first stream, with the second coming from charges on everything from basic bank accounts to complex investment banking transactions. Over the last five years, OceanFirst Financial grew its revenue at a sluggish 2.2% compounded annual growth rate. This fell short of our benchmarks and is a poor baseline for our analysis.
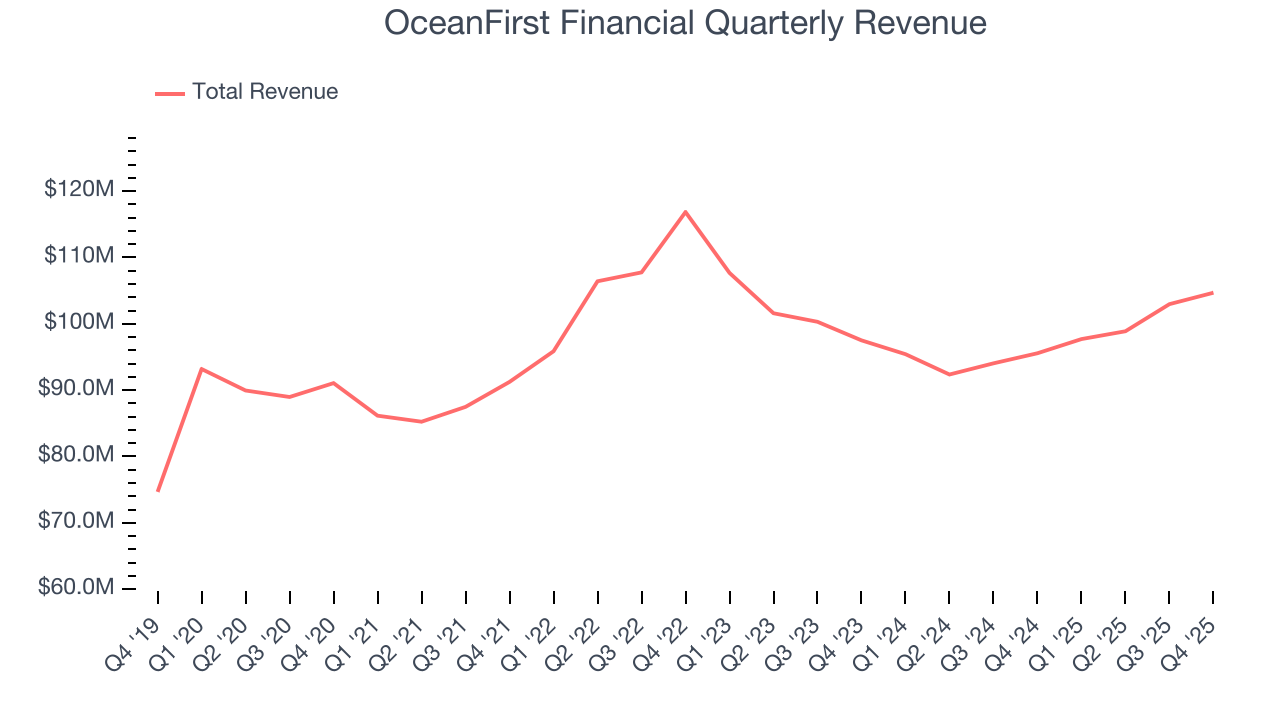
Long-term growth is the most important, but within financials, a half-decade historical view may miss recent interest rate changes and market returns. OceanFirst Financial’s recent performance shows its demand has slowed as its revenue was flat over the last two years. 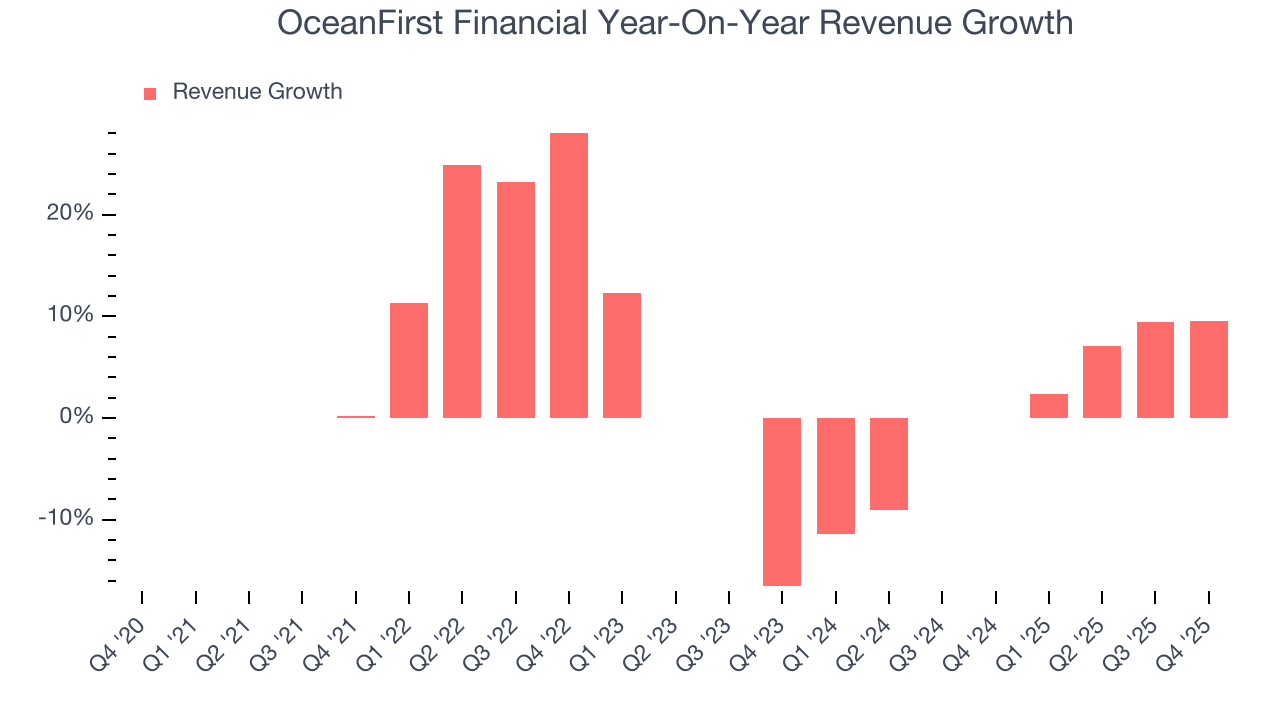 Note: Quarters not shown were determined to be outliers, impacted by outsized investment gains/losses that are not indicative of the recurring fundamentals of the business.
This quarter, OceanFirst Financial reported year-on-year revenue growth of 9.5%, and its $104.7 million of revenue exceeded Wall Street’s estimates by 1.9%.
Net interest income made up 88.8% of the company’s total revenue during the last five years, meaning OceanFirst Financial barely relies on non-interest income to drive its overall growth.
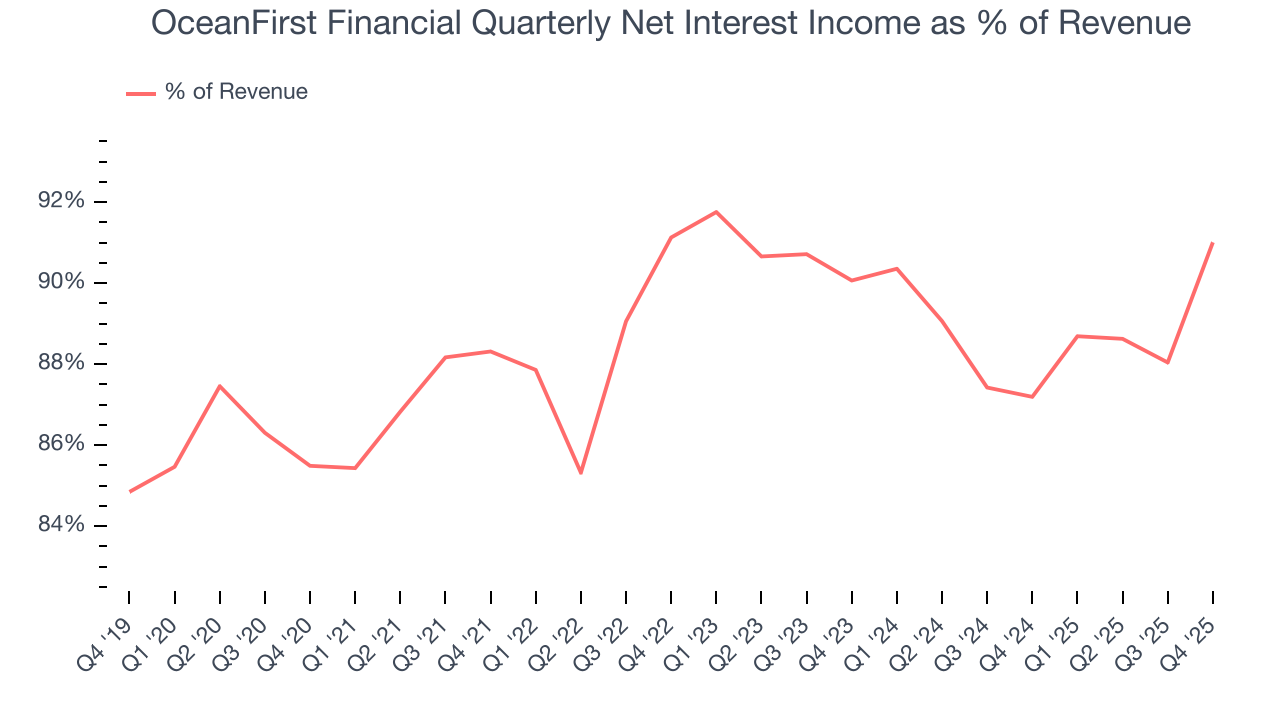
While banks generate revenue from multiple sources, investors view net interest income as the cornerstone - its predictable, recurring characteristics stand in sharp contrast to the volatility of non-interest income.
6. Efficiency Ratio
The underlying profitability of top-line growth determines the actual bottom-line impact. Banking institutions measure this dynamic using the efficiency ratio, which is calculated by dividing non-interest expenses like personnel, facilities, technology, and marketing by total revenue.
Markets emphasize efficiency ratio trends over static measurements, recognizing that revenue compositions drive different expense bases. Lower efficiency ratios signal superior performance by indicating that banks are controlling costs effectively relative to their income.
Over the last five years, OceanFirst Financial’s efficiency ratio has increased by 7.6 percentage points, going from 60.8% to 73%. Said differently, the company’s expenses have increased at a faster rate than revenue, which usually raises questions unless the company is in high-growth mode and reinvesting its profits into attractive ventures.
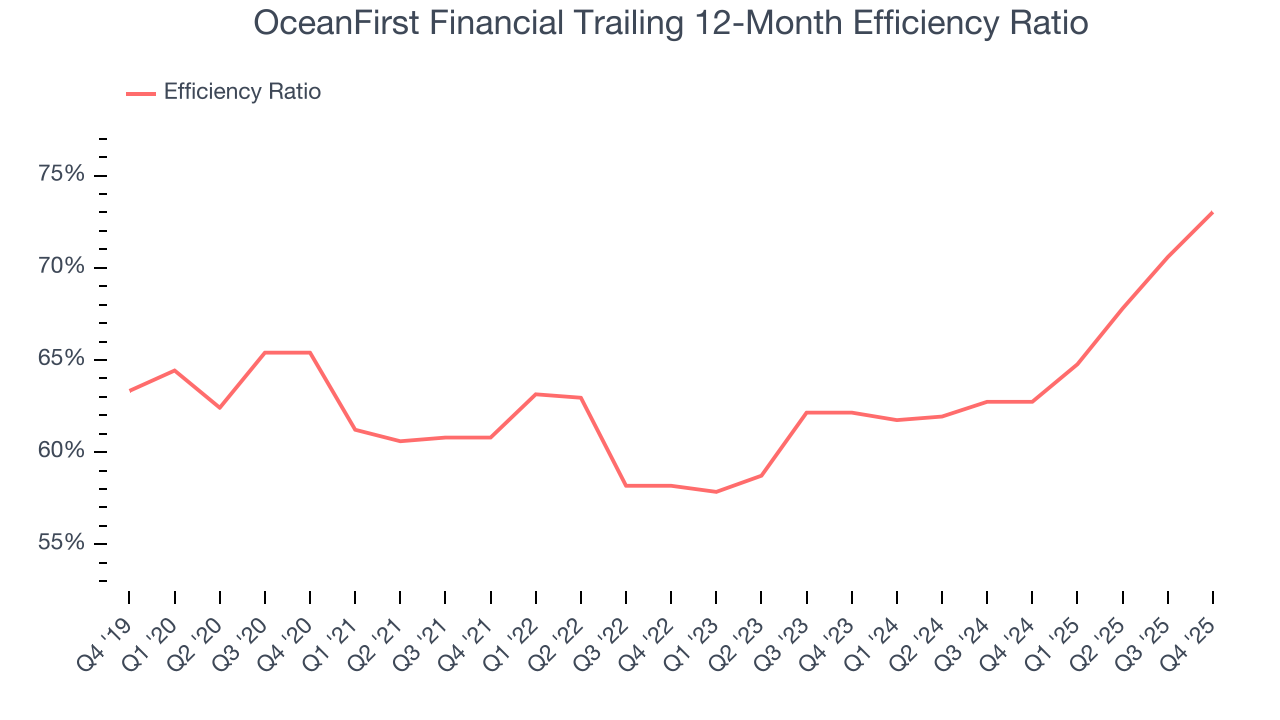
OceanFirst Financial’s efficiency ratio came in at 80.4% this quarter, falling short of analysts’ expectations by 1,145.3 basis points (100 basis points = 1 percentage point).
For the next 12 months, Wall Street expects OceanFirst Financial to rein in some of its expenses as it anticipates an efficiency ratio of 62.6%.
7. Earnings Per Share
We track the long-term change in earnings per share (EPS) for the same reason as long-term revenue growth. Compared to revenue, however, EPS highlights whether a company’s growth is profitable.
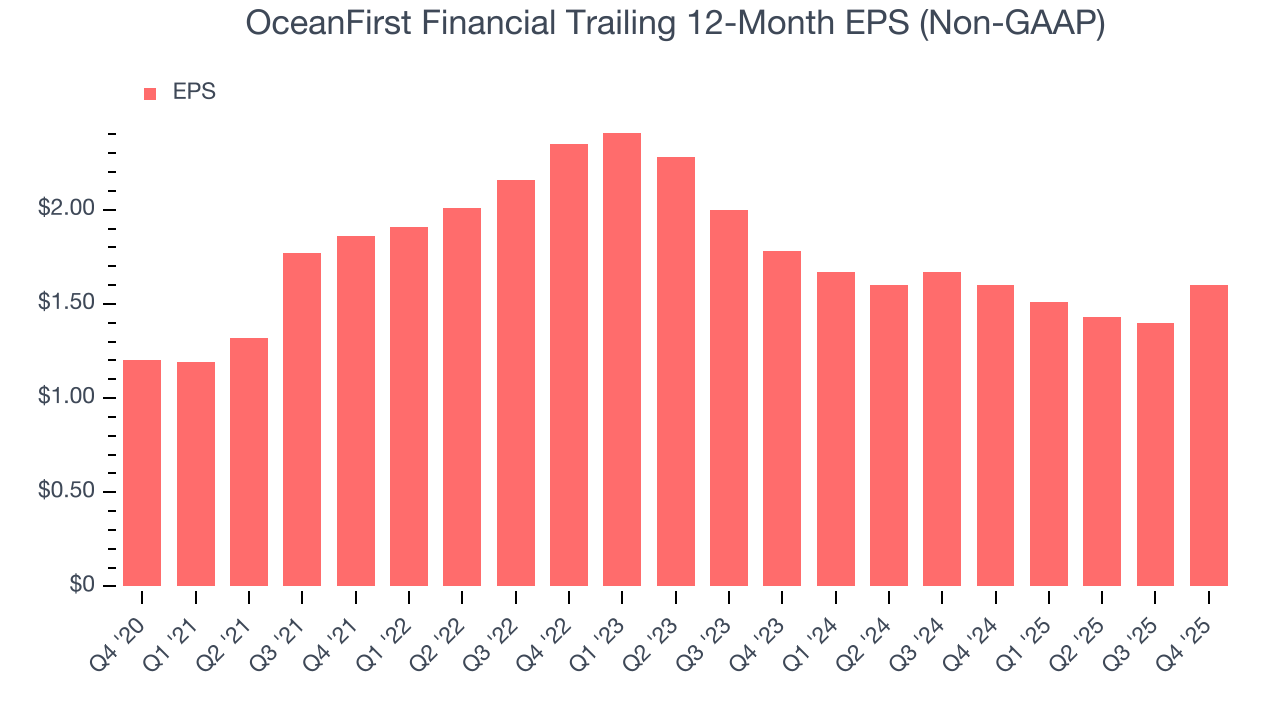
OceanFirst Financial’s EPS grew at a weak 5.9% compounded annual growth rate over the last five years. On the bright side, this performance was better than its 2.2% annualized revenue growth and tells us the company became more profitable on a per-share basis as it expanded.
Like with revenue, we analyze EPS over a more recent period because it can provide insight into an emerging theme or development for the business.
For OceanFirst Financial, its two-year annual EPS declines of 5.2% show it’s continued to underperform. These results were bad no matter how you slice the data.
In Q4, OceanFirst Financial reported adjusted EPS of $0.58, up from $0.38 in the same quarter last year. This print easily cleared analysts’ estimates, and shareholders should be content with the results. Over the next 12 months, Wall Street expects OceanFirst Financial’s full-year EPS of $1.60 to grow 20.6%.
8. Tangible Book Value Per Share (TBVPS)
The balance sheet drives banking profitability since earnings flow from the spread between borrowing and lending rates. As such, valuations for these companies concentrate on capital strength and sustainable equity accumulation potential.
This explains why tangible book value per share (TBVPS) stands as the premier banking metric. TBVPS strips away questionable intangible assets, revealing concrete per-share net worth that investors can trust. Other (and more commonly known) per-share metrics like EPS can sometimes be murky due to M&A or accounting rules allowing for loan losses to be spread out.
OceanFirst Financial’s TBVPS grew at a mediocre 4.3% annual clip over the last five years. TBVPS growth has also recently decelerated to 1.2% annual growth over the last two years (from $19.33 to $19.79 per share).
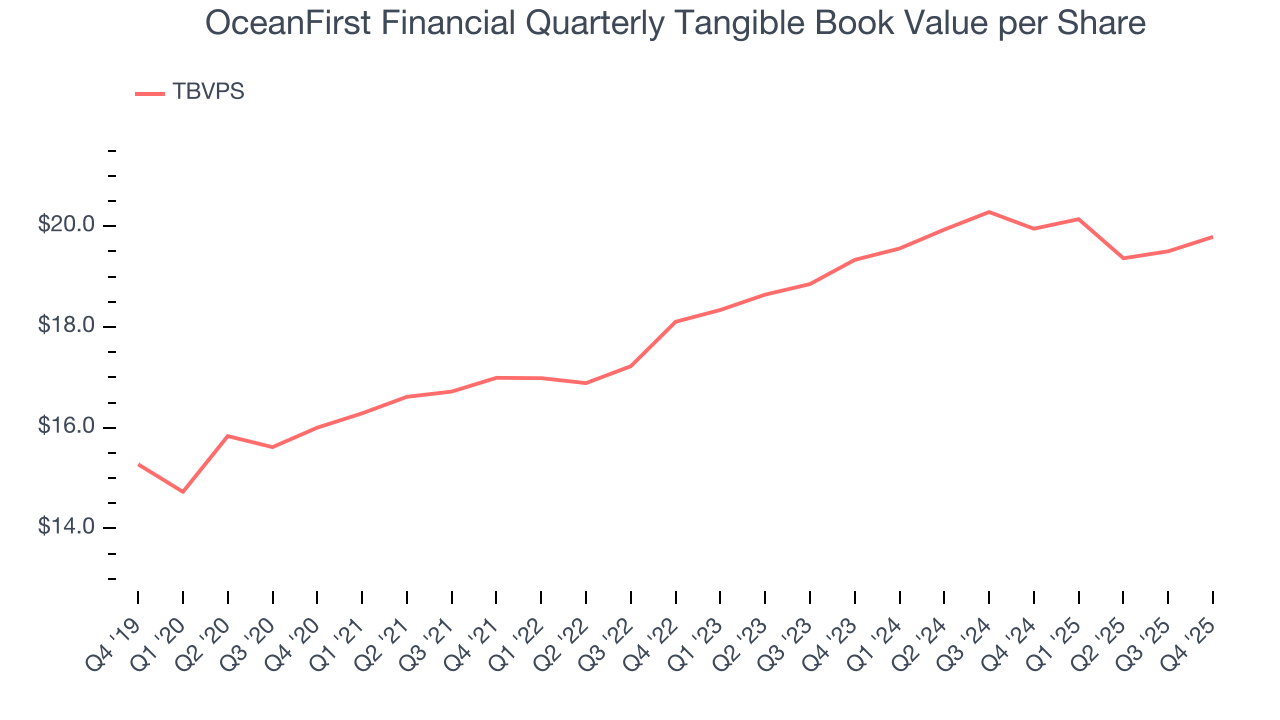
Over the next 12 months, Consensus estimates call for OceanFirst Financial’s TBVPS to shrink by 1.2% to $19.56, a sour projection.
9. Balance Sheet Assessment
Leverage is core to a financial firm’s business model (loans funded by deposits). To ensure economic stability and avoid a repeat of the 2008 GFC, regulators require certain levels of capital and liquidity, focusing on the Tier 1 capital ratio.
Tier 1 capital is the highest-quality capital that a firm holds, consisting primarily of common stock and retained earnings, but also physical gold. It serves as the primary cushion against losses and is the first line of defense in times of financial distress.
This capital is divided by risk-weighted assets to derive the Tier 1 capital ratio. Risk-weighted means that cash and US treasury securities are assigned little risk while unsecured consumer loans and equity investments get much higher risk weights, for example.
New regulation after the 2008 financial crisis requires that all firms must maintain a Tier 1 capital ratio greater than 4.5%. On top of this, there are additional buffers based on scale, risk profile, and other regulatory classifications, so that at the end of the day, firms generally must maintain a 7-10% ratio at minimum.
Over the last two years, OceanFirst Financial has averaged a Tier 1 capital ratio of 11%, which is considered safe and well capitalized in the event that macro or market conditions suddenly deteriorate.
10. Return on Equity
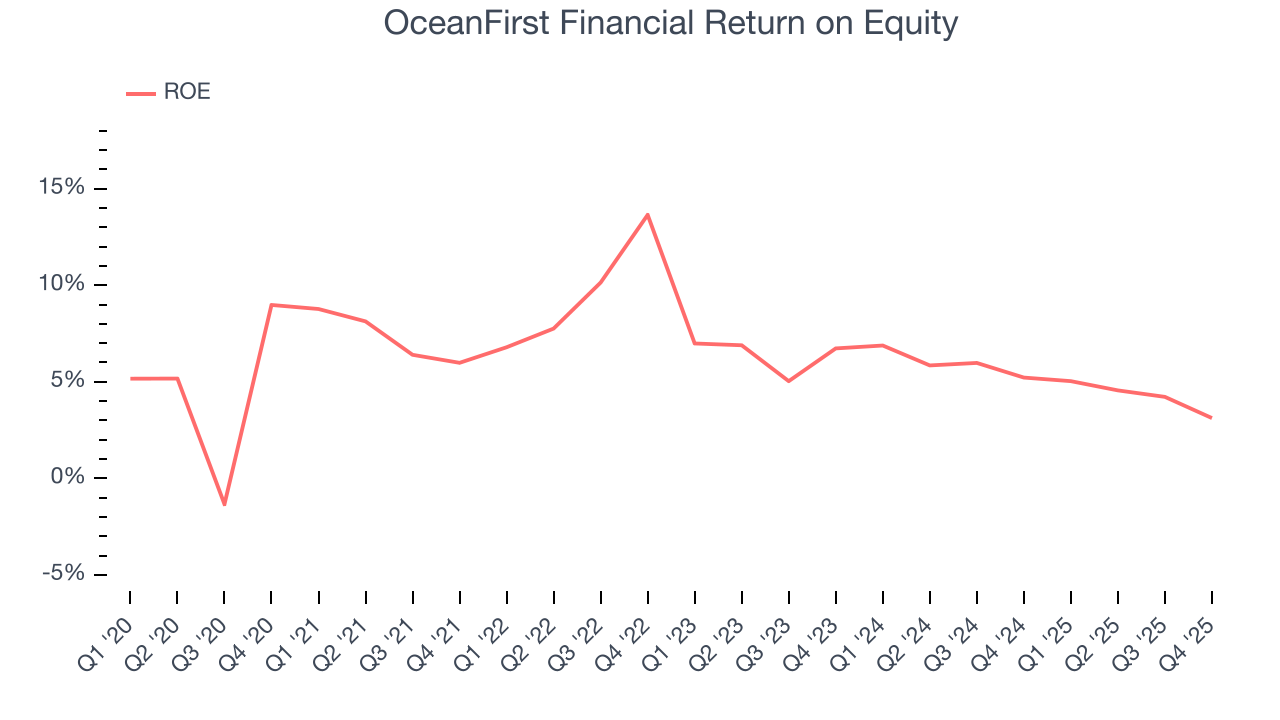
Return on equity (ROE) reveals the profit generated per dollar of shareholder equity, which represents a key source of bank funding. Banks maintaining elevated ROE levels tend to accelerate wealth creation for shareholders via earnings retention, buybacks, and distributions.
Over the last five years, OceanFirst Financial has averaged an ROE of 6.7%, uninspiring for a company operating in a sector where the average shakes out around 7.5%.
11. Key Takeaways from OceanFirst Financial’s Q4 Results
It was good to see OceanFirst Financial beat analysts’ EPS expectations this quarter. We were also happy its revenue outperformed Wall Street’s estimates. Overall, we think this was a decent quarter with some key metrics above expectations. The stock remained flat at $19.19 immediately following the results.
12. Is Now The Time To Buy OceanFirst Financial?
Updated: March 9, 2026 at 1:00 AM EDT
Are you wondering whether to buy OceanFirst Financial or pass? We urge investors to not only consider the latest earnings results but also longer-term business quality and valuation as well.
OceanFirst Financial doesn’t pass our quality test. First off, its revenue growth was weak over the last five years. While its estimated net interest income growth for the next 12 months is great, the downside is its estimated sales for the next 12 months are weak. On top of that, its net interest income growth was weak over the last five years.
OceanFirst Financial’s P/B ratio based on the next 12 months is 0.7x. While this valuation is optically cheap, the potential downside is huge given its shaky fundamentals. There are superior stocks to buy right now.
Wall Street analysts have a consensus one-year price target of $22 on the company (compared to the current share price of $18.06).
Although the price target is bullish, readers should exercise caution because analysts tend to be overly optimistic. The firms they work for, often big banks, have relationships with companies that extend into fundraising, M&A advisory, and other rewarding business lines. As a result, they typically hesitate to say bad things for fear they will lose out. We at StockStory do not suffer from such conflicts of interest, so we’ll always tell it like it is.