
Old National Bank (ONB)
Old National Bank is a sound business. Its revenue and EPS are projected to skyrocket next year, an optimistic sign for its share price.― StockStory Analyst Team
1. News


2. Summary
Why Old National Bank Is Interesting
Tracing its roots back to 1834 when Andrew Jackson was president, Old National Bancorp (NASDAQ:ONB) is a bank holding company that provides commercial and consumer loans, deposit services, wealth management, and treasury solutions primarily throughout the Midwest region.
- Market share has increased this cycle as its 24.9% annual revenue growth over the last five years was exceptional
- Annual net interest income growth of 28.1% over the last five years was superb and indicates its market share increased during this cycle
- One risk is its annual earnings per share growth of 7.9% underperformed its revenue over the last five years, showing its incremental sales were less profitable


Old National Bank is solid, but not perfect. If you like the story, the valuation looks fair.
Why Is Now The Time To Buy Old National Bank?


Old National Bank is trading at $21.15 per share, or 0.9x forward P/B. This multiple is lower than most banking companies, and we think the valuation is reasonable for the revenue growth you get.
If you think the market is undervaluing the company, now could be a good time to build a position.
3. Old National Bank (ONB) Research Report: Q4 CY2025 Update
Midwestern regional bank Old National Bancorp (NASDAQ:ONB) missed Wall Street’s revenue expectations in Q4 CY2025, but sales rose 40.9% year on year to $698.6 million. Its non-GAAP profit of $0.62 per share was 4.8% above analysts’ consensus estimates.
Old National Bank (ONB) Q4 CY2025 Highlights:
- Net Interest Income: $580.8 million vs analyst estimates of $586.6 million (47.4% year-on-year growth, 1% miss)
- Net Interest Margin: 3.6% vs analyst estimates of 3.6% (2.2 basis point miss)
- Revenue: $698.6 million vs analyst estimates of $708.1 million (40.9% year-on-year growth, 1.3% miss)
- Efficiency Ratio: 51.6% vs analyst estimates of 49.3% (225.7 basis point miss)
- Adjusted EPS: $0.62 vs analyst estimates of $0.59 (4.8% beat)
- Tangible Book Value per Share: $13.71 vs analyst estimates of $13.57 (14.7% year-on-year growth, 1% beat)
- Market Capitalization: $8.95 billion
Company Overview
Tracing its roots back to 1834 when Andrew Jackson was president, Old National Bancorp (NASDAQ:ONB) is a bank holding company that provides commercial and consumer loans, deposit services, wealth management, and treasury solutions primarily throughout the Midwest region.
Old National operates through its primary subsidiary, Old National Bank, serving individuals and businesses across Illinois, Indiana, Iowa, Kentucky, Michigan, Minnesota, and Wisconsin. The bank's commercial lending activities span diverse industries including real estate, manufacturing, healthcare, wholesale trade, construction, and agriculture, with a focus on serving clients within its geographic footprint.
For individual customers, Old National offers home equity lines of credit, residential mortgages, and consumer loans, along with various deposit accounts including checking, savings, money market, and time deposits. A business owner in Wisconsin might use Old National for both a commercial real estate loan to expand operations and wealth management services to handle personal investments.
The bank generates revenue through interest income on loans and investments, fees from loan originations, and service charges on deposit accounts. Beyond traditional banking, Old National provides comprehensive wealth management, trust services, and investment advisory solutions. For business clients, the bank offers specialized services including treasury management, merchant services, and capital markets solutions.
Old National also engages in community development lending and equity investment initiatives designed to create jobs and revitalize communities throughout its service area. The bank maintains a diversified investment portfolio that includes U.S. Treasury securities, mortgage-backed securities, and municipal bonds to support its operations and manage liquidity.
4. Regional Banks
Regional banks, financial institutions operating within specific geographic areas, serve as intermediaries between local depositors and borrowers. They benefit from rising interest rates that improve net interest margins (the difference between loan yields and deposit costs), digital transformation reducing operational expenses, and local economic growth driving loan demand. However, these banks face headwinds from fintech competition, deposit outflows to higher-yielding alternatives, credit deterioration (increasing loan defaults) during economic slowdowns, and regulatory compliance costs. Recent concerns about regional bank stability following high-profile failures and significant commercial real estate exposure present additional challenges.
Old National Bancorp competes with other regional banks operating in the Midwest including Fifth Third Bancorp (NASDAQ: FITB), Huntington Bancshares (NASDAQ: HBAN), KeyCorp (NYSE: KEY), and First Merchants Corporation (NASDAQ: FRME).
5. Sales Growth
In general, banks make money from two primary sources. The first is net interest income, which is interest earned on loans, mortgages, and investments in securities minus interest paid out on deposits. The second source is non-interest income, which can come from bank account, credit card, wealth management, investing banking, and trading fees. Luckily, Old National Bank’s revenue grew at an incredible 24.7% compounded annual growth rate over the last five years. Its growth beat the average banking company and shows its offerings resonate with customers, a helpful starting point for our analysis.
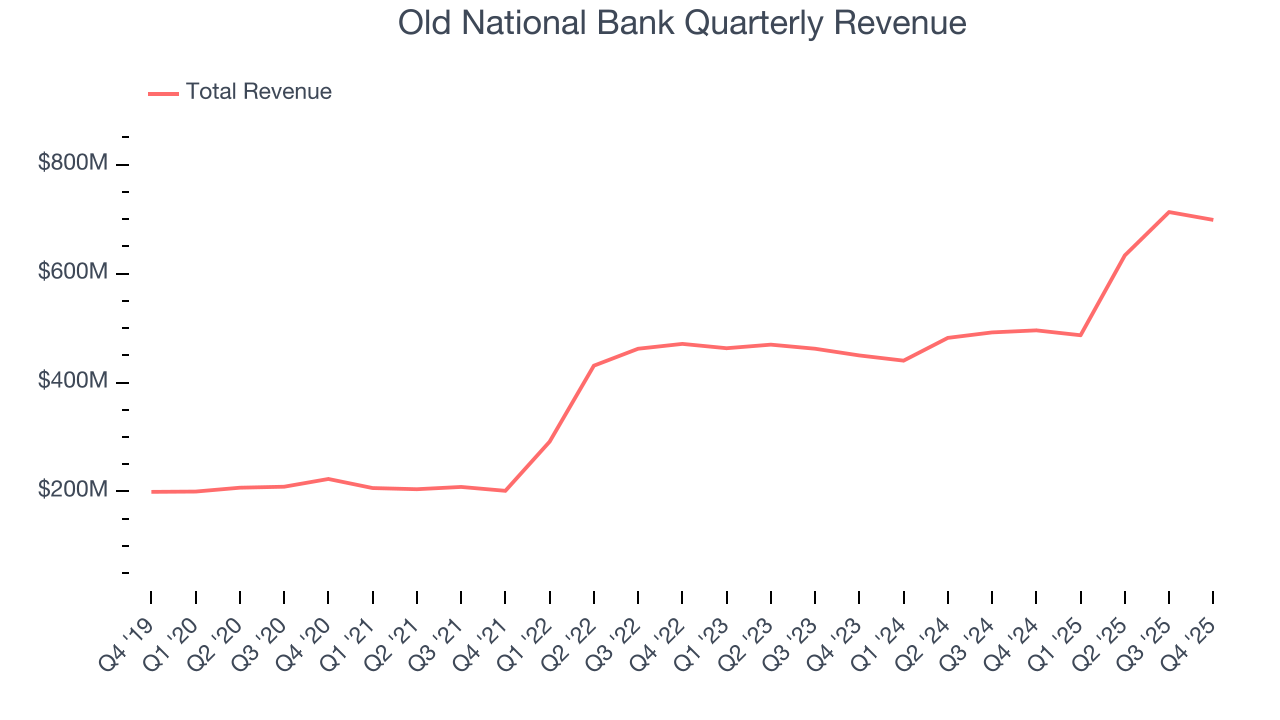
Long-term growth is the most important, but within financials, a half-decade historical view may miss recent interest rate changes and market returns. Old National Bank’s annualized revenue growth of 17.2% over the last two years is below its five-year trend, but we still think the results suggest healthy demand. 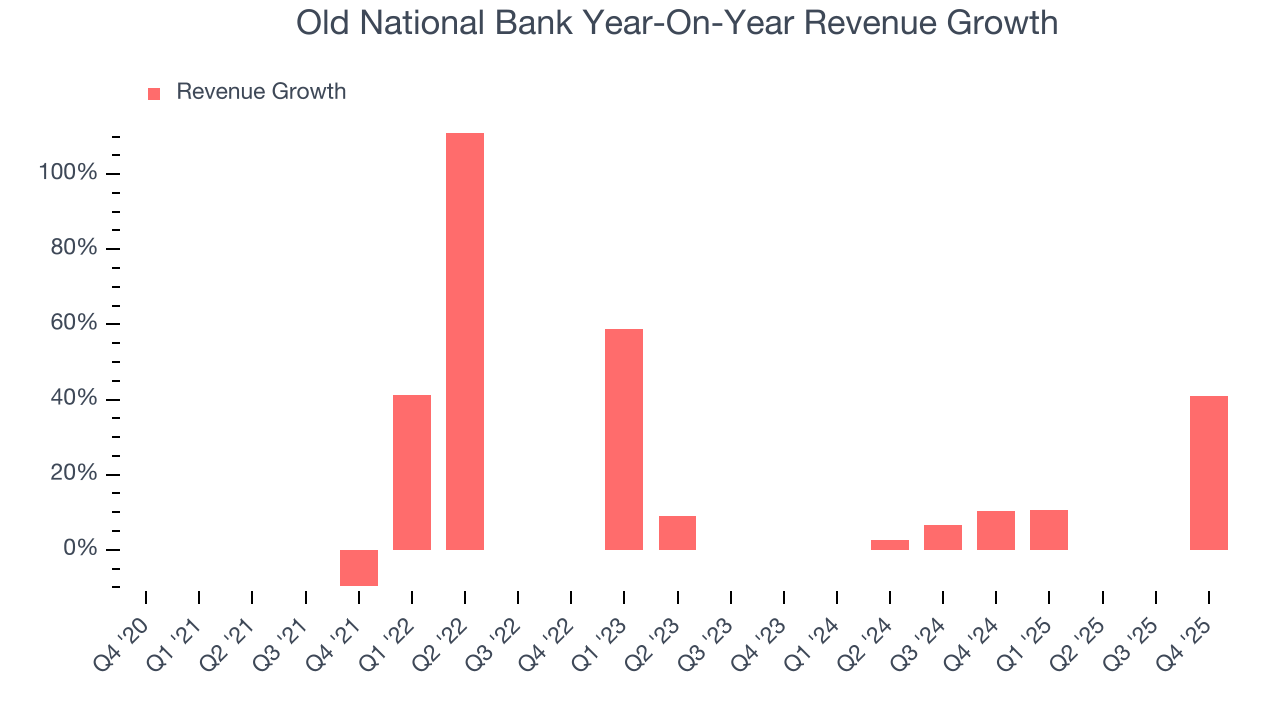 Note: Quarters not shown were determined to be outliers, impacted by outsized investment gains/losses that are not indicative of the recurring fundamentals of the business.
This quarter, Old National Bank achieved a magnificent 40.9% year-on-year revenue growth rate, but its $698.6 million of revenue fell short of Wall Street’s lofty estimates.
Net interest income made up 79.1% of the company’s total revenue during the last five years, meaning lending operations are Old National Bank’s largest source of revenue.
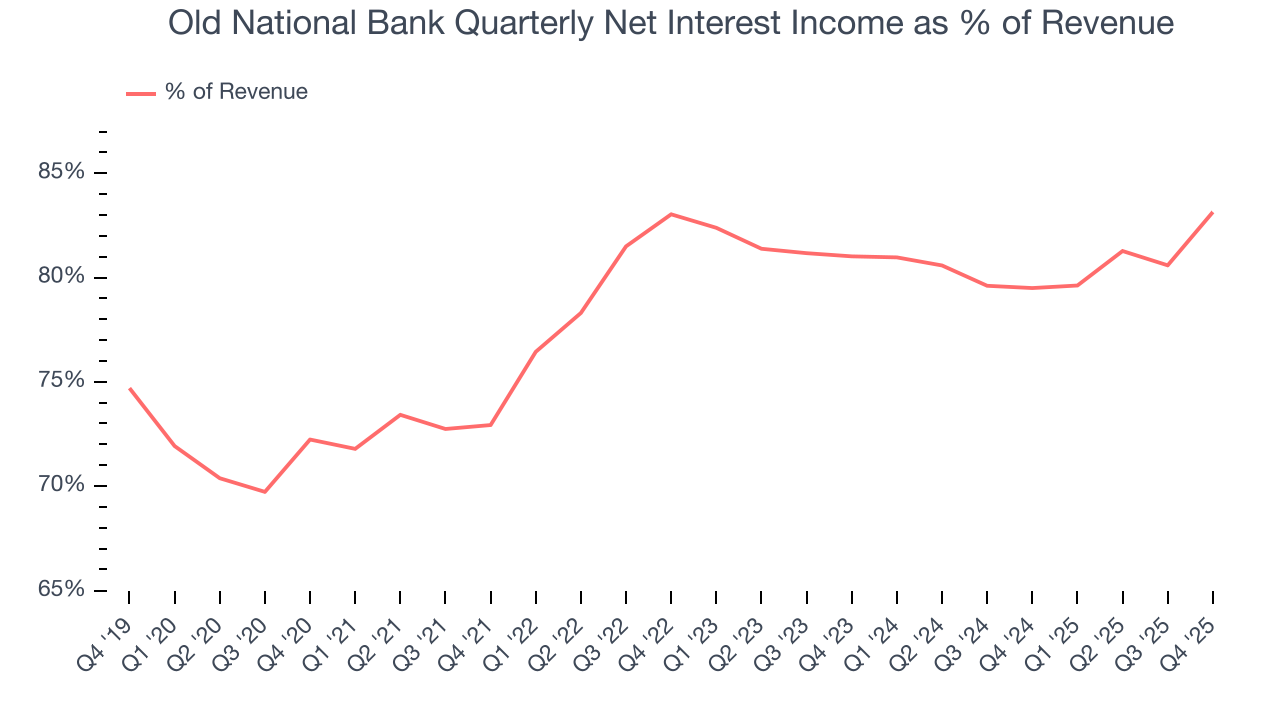
Our experience and research show the market cares primarily about a bank’s net interest income growth as non-interest income is considered a lower-quality and non-recurring revenue source.
6. Efficiency Ratio
Topline growth carries importance, but the overall profitability behind this expansion determines true value creation. For banks, the efficiency ratio captures this relationship by measuring non-interest expenses, including salaries, facilities, technology, and marketing, against total revenue.
Markets understand that a bank’s expense base depends on its revenue mix and what mostly drives share price performance is the change in this ratio, rather than its absolute value. It’s somewhat counterintuitive, but a lower efficiency ratio is better.
Over the last five years, Old National Bank’s efficiency ratio has swelled by 8.3 percentage points, going from 58.2% to 55%. Said differently, the company’s expenses have grown at a slower rate than revenue, which typically signals prudent management.
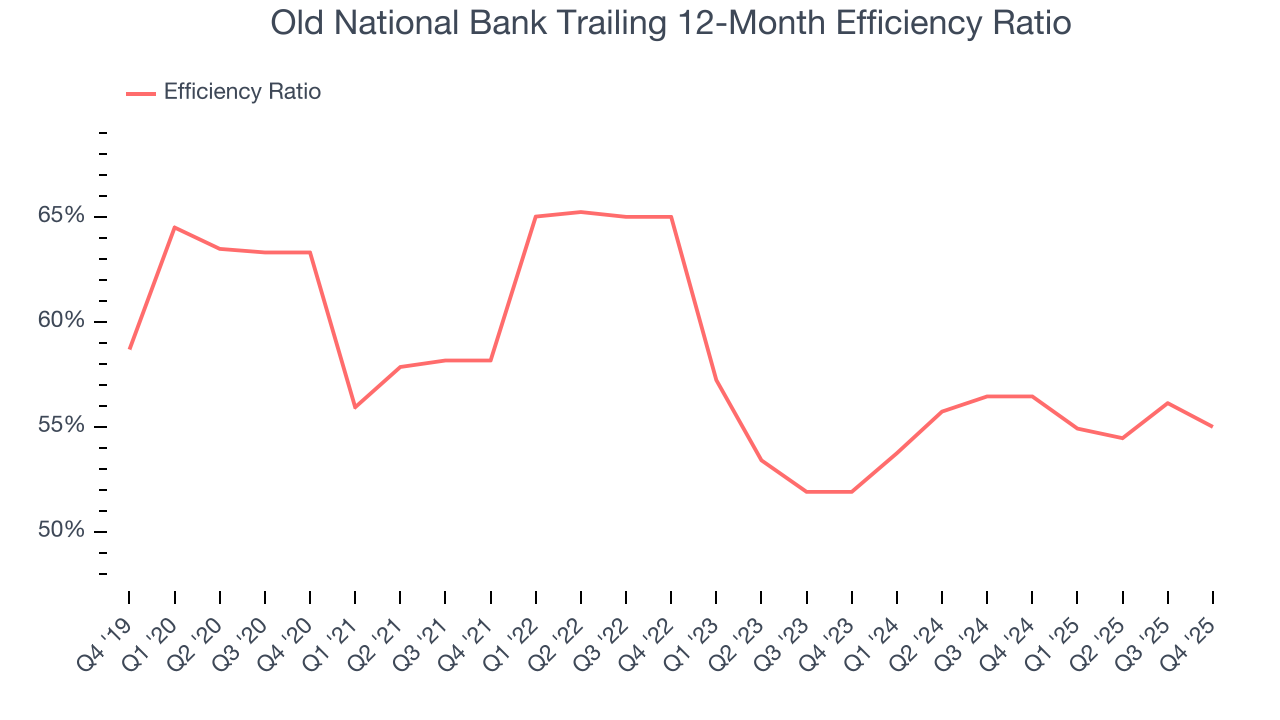
In Q4, Old National Bank’s efficiency ratio was 51.6%, falling short of analysts’ expectations by 225.7 basis points (100 basis points = 1 percentage point).
For the next 12 months, Wall Street expects Old National Bank to rein in some of its expenses as it anticipates an efficiency ratio of 45.7%.
7. Earnings Per Share
We track the long-term change in earnings per share (EPS) for the same reason as long-term revenue growth. Compared to revenue, however, EPS highlights whether a company’s growth is profitable.
Old National Bank’s EPS grew at an unimpressive 7.9% compounded annual growth rate over the last five years, lower than its 24.7% annualized revenue growth. However, its efficiency ratio didn’t change during this time, telling us that non-fundamental factors such as interest and taxes affected its ultimate earnings.
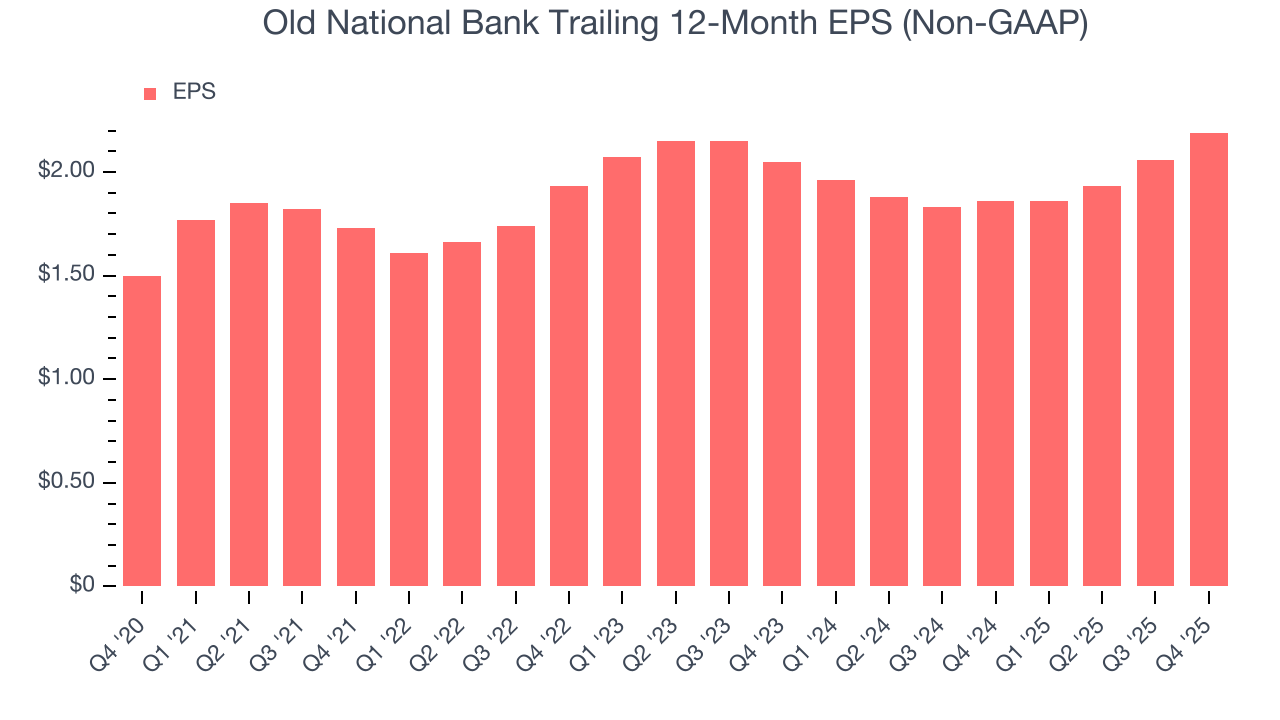
Like with revenue, we analyze EPS over a shorter period to see if we are missing a change in the business.
For Old National Bank, its two-year annual EPS growth of 3.4% was lower than its five-year trend. This wasn’t great, but at least the company was successful in other measures of financial health.
In Q4, Old National Bank reported adjusted EPS of $0.62, up from $0.49 in the same quarter last year. This print beat analysts’ estimates by 4.8%. Over the next 12 months, Wall Street expects Old National Bank’s full-year EPS of $2.19 to grow 19.8%.
8. Tangible Book Value Per Share (TBVPS)
The balance sheet drives banking profitability since earnings flow from the spread between borrowing and lending rates. As such, valuations for these companies concentrate on capital strength and sustainable equity accumulation potential.
When analyzing banks, tangible book value per share (TBVPS) takes precedence over many other metrics. This measure isolates genuine per-share value by removing intangible assets of debatable liquidation worth. Traditional metrics like EPS are helpful but face distortion from M&A activity and loan loss accounting rules.
Old National Bank’s TBVPS grew at a tepid 3.7% annual clip over the last five years. However, TBVPS growth has accelerated recently, growing by 11.4% annually over the last two years from $11.04 to $13.71 per share.
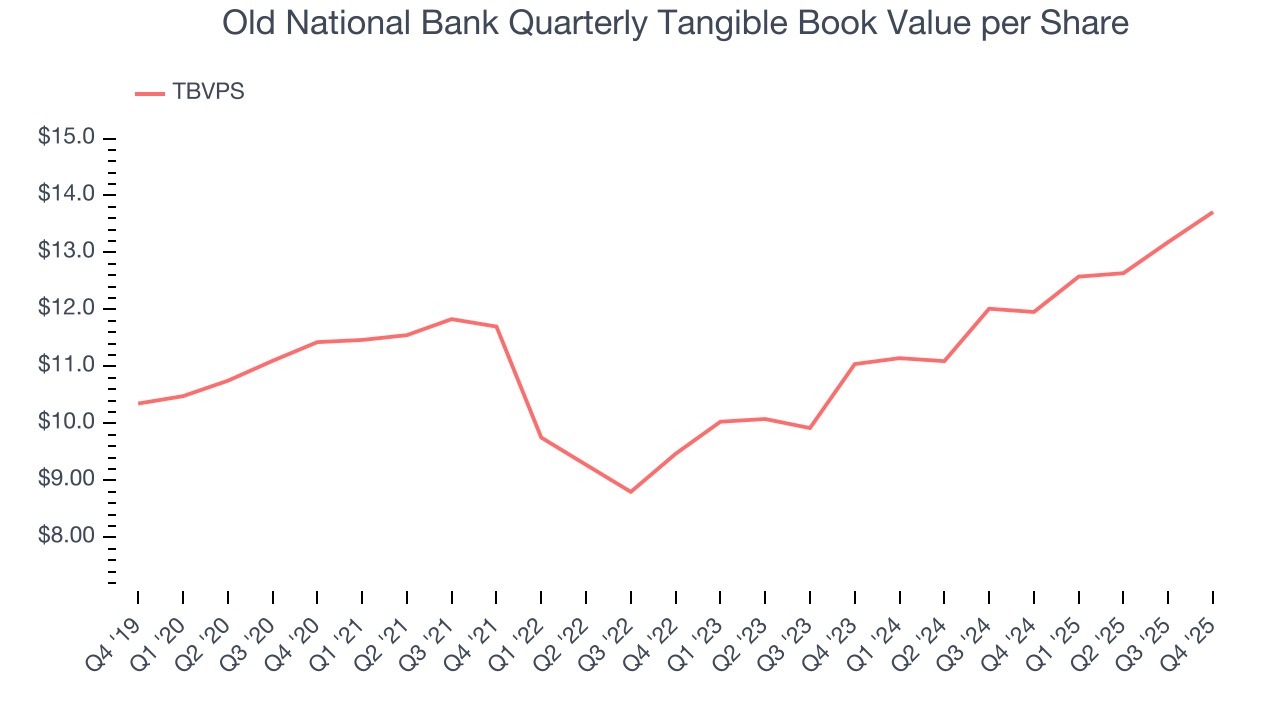
Over the next 12 months, Consensus estimates call for Old National Bank’s TBVPS to grow by 14.8% to $15.74, decent growth rate.
9. Balance Sheet Assessment
Leverage is core to a financial firm’s business model (loans funded by deposits). To ensure economic stability and avoid a repeat of the 2008 GFC, regulators require certain levels of capital and liquidity, focusing on the Tier 1 capital ratio.
Tier 1 capital is the highest-quality capital that a firm holds, consisting primarily of common stock and retained earnings, but also physical gold. It serves as the primary cushion against losses and is the first line of defense in times of financial distress.
This capital is divided by risk-weighted assets to derive the Tier 1 capital ratio. Risk-weighted means that cash and US treasury securities are assigned little risk while unsecured consumer loans and equity investments get much higher risk weights, for example.
New regulation after the 2008 financial crisis requires that all firms must maintain a Tier 1 capital ratio greater than 4.5%. On top of this, there are additional buffers based on scale, risk profile, and other regulatory classifications, so that at the end of the day, firms generally must maintain a 7-10% ratio at minimum.
Over the last two years, Old National Bank has averaged a Tier 1 capital ratio of 11%, which is considered safe and well capitalized in the event that macro or market conditions suddenly deteriorate.
10. Return on Equity
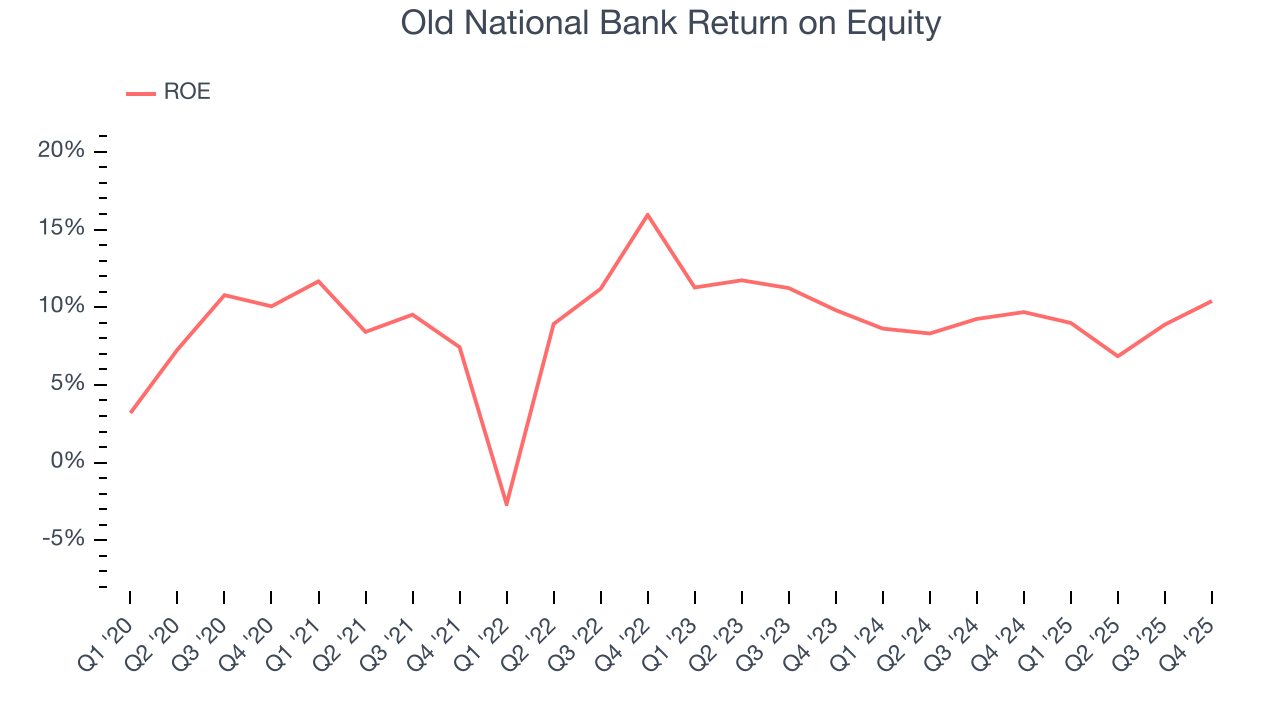
Return on equity (ROE) reveals the profit generated per dollar of shareholder equity, which represents a key source of bank funding. Banks maintaining elevated ROE levels tend to accelerate wealth creation for shareholders via earnings retention, buybacks, and distributions.
Over the last five years, Old National Bank has averaged an ROE of 9.3%, uninspiring for a company operating in a sector where the average shakes out around 7.5%. We’re optimistic Old National Bank can turn the ship around given its success in other measures of financial health.
11. Key Takeaways from Old National Bank’s Q4 Results
It was good to see Old National Bank narrowly top analysts’ tangible book value per share expectations this quarter. On the other hand, its revenue slightly missed and its net interest income fell slightly short of Wall Street’s estimates. Overall, this was a softer quarter. The stock remained flat at $22.83 immediately following the results.
12. Is Now The Time To Buy Old National Bank?
Updated: March 19, 2026 at 12:22 AM EDT
A common mistake we notice when investors are deciding whether to buy a stock or not is that they simply look at the latest earnings results. Business quality and valuation matter more, so we urge you to understand these dynamics as well.
Old National Bank possesses a number of positive attributes. First off, its revenue growth was exceptional over the last five years. And while its unimpressive EPS growth over the last five years shows it’s failed to produce meaningful profits for shareholders, its net interest income growth was exceptional over the last five years. On top of that, its estimated net interest income growth for the next 12 months is great.
Old National Bank’s P/B ratio based on the next 12 months is 0.9x. Looking at the banking landscape right now, Old National Bank trades at a pretty interesting price. If you trust the business and its direction, this is an ideal time to buy.
Wall Street analysts have a consensus one-year price target of $27.54 on the company (compared to the current share price of $21.15), implying they see 30.2% upside in buying Old National Bank in the short term.