O'Reilly (ORLY)
O'Reilly is an exciting business. Its high free cash flow margin and returns on capital show it can produce cash and invest it wisely.― StockStory Analyst Team
1. News


2. Summary
Why We Like O'Reilly
Serving both the DIY customer and professional mechanic, O’Reilly Automotive (NASDAQ:ORLY) is an auto parts and accessories retailer that sells everything from fuel pumps to car air fresheners to mufflers.
- Disciplined cost controls and effective management have materialized in a strong operating margin
- ROIC punches in at 42.5%, illustrating management’s expertise in identifying profitable investments
- Strong free cash flow margin of 10.3% gives it the option to reinvest, repurchase shares, or pay dividends


O'Reilly is a market leader. The price looks fair when considering its quality, so this might be a good time to buy some shares.
Why Is Now The Time To Buy O'Reilly?


At $90.00 per share, O'Reilly trades at 28.6x forward P/E. This price is justified - even cheap depending on how much you believe in the bull case - for the business fundamentals.
Our work shows, time and again, that buying high-quality companies and holding them routinely leads to market outperformance. If you can get an attractive entry price, that’s icing on the cake.
3. O'Reilly (ORLY) Research Report: Q4 CY2025 Update
Auto parts and accessories retailer O’Reilly Automotive (NASDAQ:ORLY) met Wall Street’s revenue expectations in Q4 CY2025, with sales up 7.8% year on year to $4.41 billion. On the other hand, the company’s full-year revenue guidance of $18.85 billion at the midpoint came in 0.6% below analysts’ estimates. Its GAAP profit of $0.71 per share was 1.9% below analysts’ consensus estimates.
O'Reilly (ORLY) Q4 CY2025 Highlights:
- Revenue: $4.41 billion vs analyst estimates of $4.39 billion (7.8% year-on-year growth, in line)
- EPS (GAAP): $0.71 vs analyst expectations of $0.72 (1.9% miss)
- Adjusted EBITDA: $972 million vs analyst estimates of $976.5 million (22% margin, in line)
- EPS (GAAP) guidance for the upcoming financial year 2026 is $3.15 at the midpoint, missing analyst estimates by 5%
- Operating Margin: 18.8%, in line with the same quarter last year
- Free Cash Flow Margin: 8.2%, similar to the same quarter last year
- Locations: 6,585 at quarter end, up from 6,378 in the same quarter last year
- Same-Store Sales rose 5.6% year on year (4.4% in the same quarter last year)
- Market Capitalization: $81.96 billion
Company Overview
Serving both the DIY customer and professional mechanic, O’Reilly Automotive (NASDAQ:ORLY) is an auto parts and accessories retailer that sells everything from fuel pumps to car air fresheners to mufflers.
The company understands that DIY customers may have varying levels of expertise in auto repair, so stores feature automotive expert sales associates who can help you find which muffler will best fit your 2021 Mazda CX-5, for example.
For the professional mechanic, O’Reilly offers programs and services designed to help professional mechanics grow their businesses and increase profits. For example, volume discounts on parts and tools, extended warranties, and access to training and technical support resources are highly valued by professional customers.
O’Reilly has a national presence in the US, but it is particularly strong in the Western states. The typical store is roughly 7,000 to 10,000 square feet, organized by product category for easy shopping. In addition to its brick-and-mortar stores, O’Reilly also has an e-commerce site, not coincidentally launched in 1999, the same year as competitors AutoZone and Advance Auto Parts. The site allows customers to buy products to be shipped to their homes or to buy and pick up at the nearest store for convenience and optionality.
4. Auto Parts Retailer
Cars are complex machines that need maintenance and occasional repairs, and auto parts retailers cater to the professional mechanic as well as the do-it-yourself (DIY) fixer. Work on cars may entail replacing fluids, parts, or accessories, and these stores have the parts and accessories or these jobs. While e-commerce competition presents a risk, these stores have a leg up due to the combination of broad and deep selection as well as expertise provided by sales associates. Another change on the horizon could be the increasing penetration of electric vehicles.
Competitors offering auto parts and accessories include AutoZone (NYSE:AZO), Advance Auto Parts (NYSE:AAP), Genuine Parts (NYSE:GPC), and private company Pep Boys.
5. Revenue Growth
Reviewing a company’s long-term sales performance reveals insights into its quality. Any business can put up a good quarter or two, but the best consistently grow over the long haul.
With $17.78 billion in revenue over the past 12 months, O'Reilly is one of the larger companies in the consumer retail industry and benefits from a well-known brand that influences purchasing decisions. However, its scale is a double-edged sword because there are only a finite number of places to build new stores, making it harder to find incremental growth. For O'Reilly to boost its sales, it likely needs to adjust its prices or lean into foreign markets.
As you can see below, O'Reilly’s 7.3% annualized revenue growth over the last three years was tepid, but to its credit, it opened new stores and increased sales at existing, established locations.
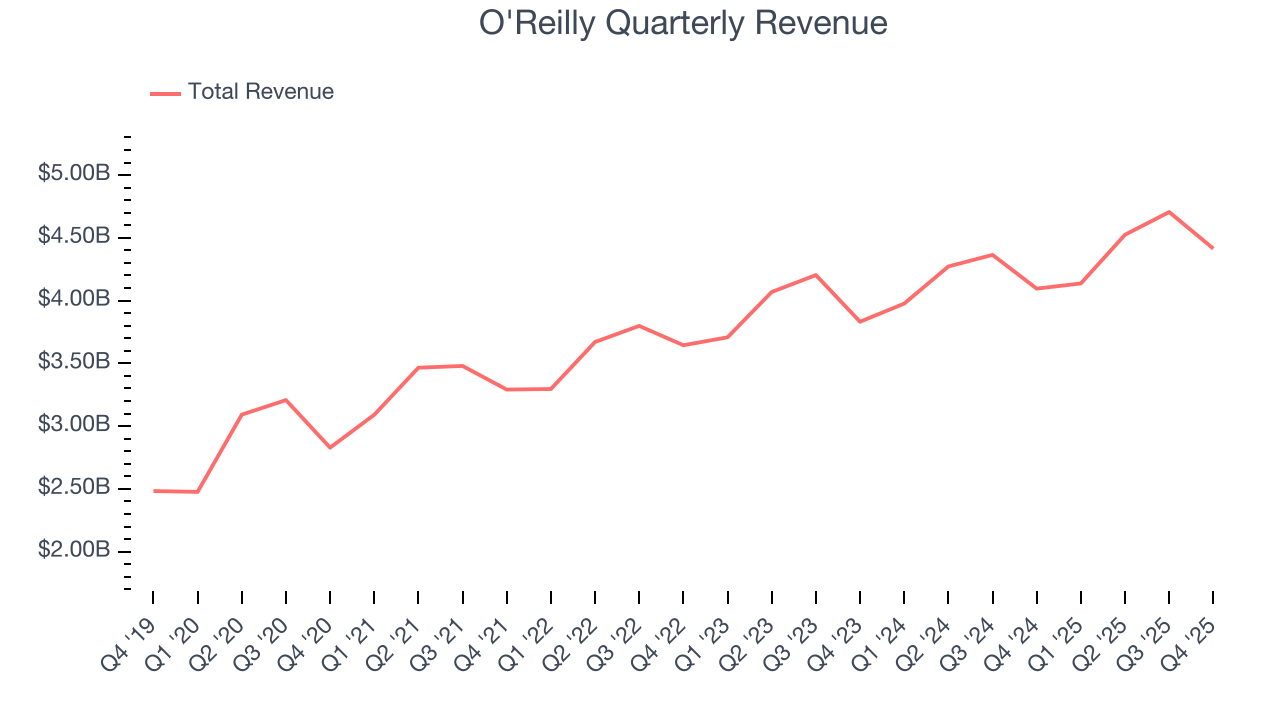
This quarter, O'Reilly grew its revenue by 7.8% year on year, and its $4.41 billion of revenue was in line with Wall Street’s estimates.
Looking ahead, sell-side analysts expect revenue to grow 6.5% over the next 12 months, similar to its three-year rate. This projection is particularly healthy for a company of its scale and indicates the market is forecasting success for its products.
6. Store Performance
Number of Stores
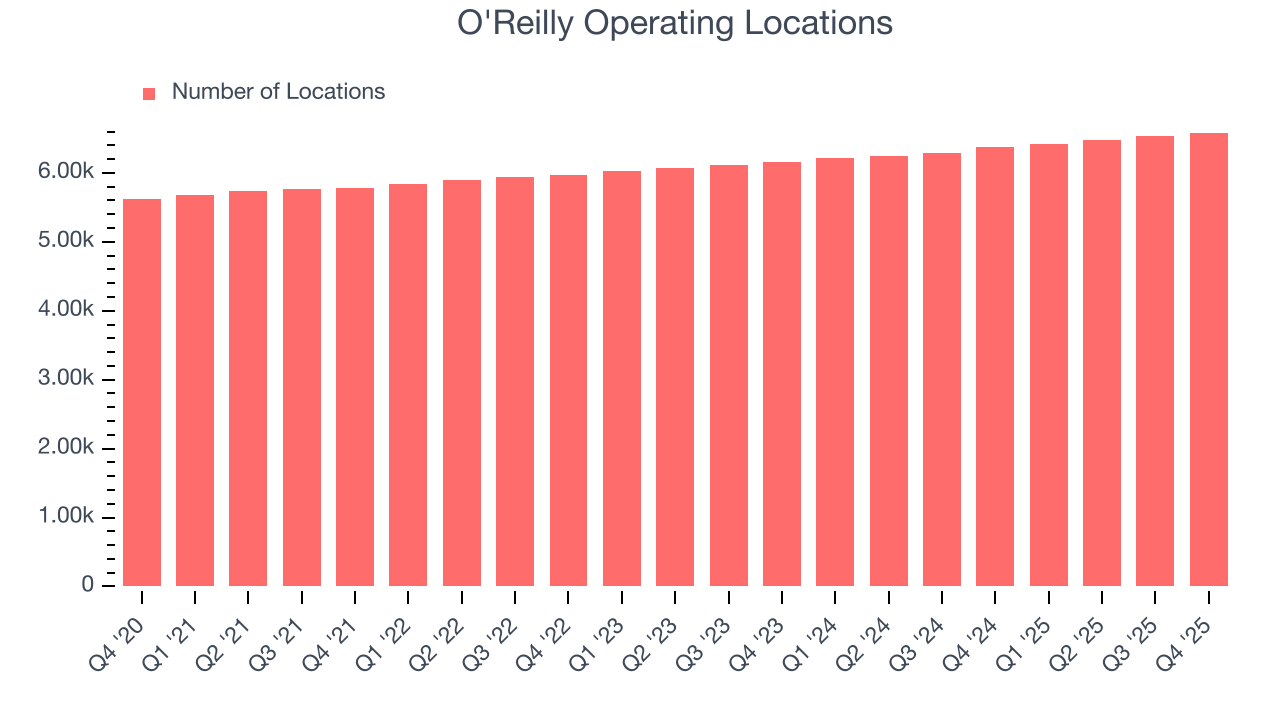
A retailer’s store count often determines how much revenue it can generate.
O'Reilly operated 6,585 locations in the latest quarter. It has opened new stores quickly over the last two years, averaging 3.3% annual growth, faster than the broader consumer retail sector.
When a retailer opens new stores, it usually means it’s investing for growth because demand is greater than supply, especially in areas where consumers may not have a store within reasonable driving distance.
Same-Store Sales
A company's store base only paints one part of the picture. When demand is high, it makes sense to open more. But when demand is low, it’s prudent to close some locations and use the money in other ways. Same-store sales is an industry measure of whether revenue is growing at those existing stores and is driven by customer visits (often called traffic) and the average spending per customer (ticket).
O'Reilly’s demand has been spectacular for a retailer over the last two years. On average, the company has increased its same-store sales by an impressive 3.8% per year. This performance suggests its rollout of new stores is beneficial for shareholders. We like this backdrop because it gives O'Reilly multiple ways to win: revenue growth can come from new stores, e-commerce, or increased foot traffic and higher sales per customer at existing locations.
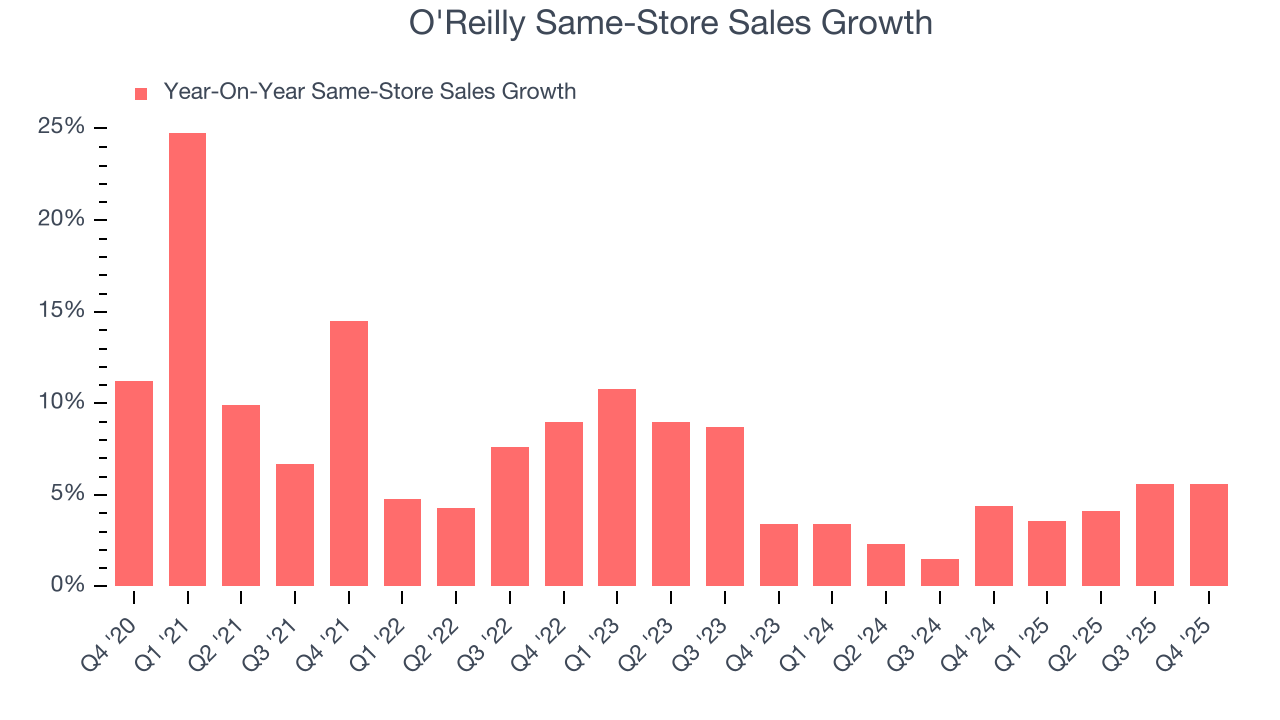
In the latest quarter, O'Reilly’s same-store sales rose 5.6% year on year. This growth was an acceleration from its historical levels, which is always an encouraging sign.
7. Gross Margin & Pricing Power
We prefer higher gross margins because they not only make it easier to generate more operating profits but also indicate product differentiation, negotiating leverage, and pricing power.
O'Reilly has great unit economics for a retailer, giving it ample room to invest in areas such as marketing and talent to grow its brand. As you can see below, it averaged an excellent 51.4% gross margin over the last two years. That means O'Reilly only paid its suppliers $48.60 for every $100 in revenue. 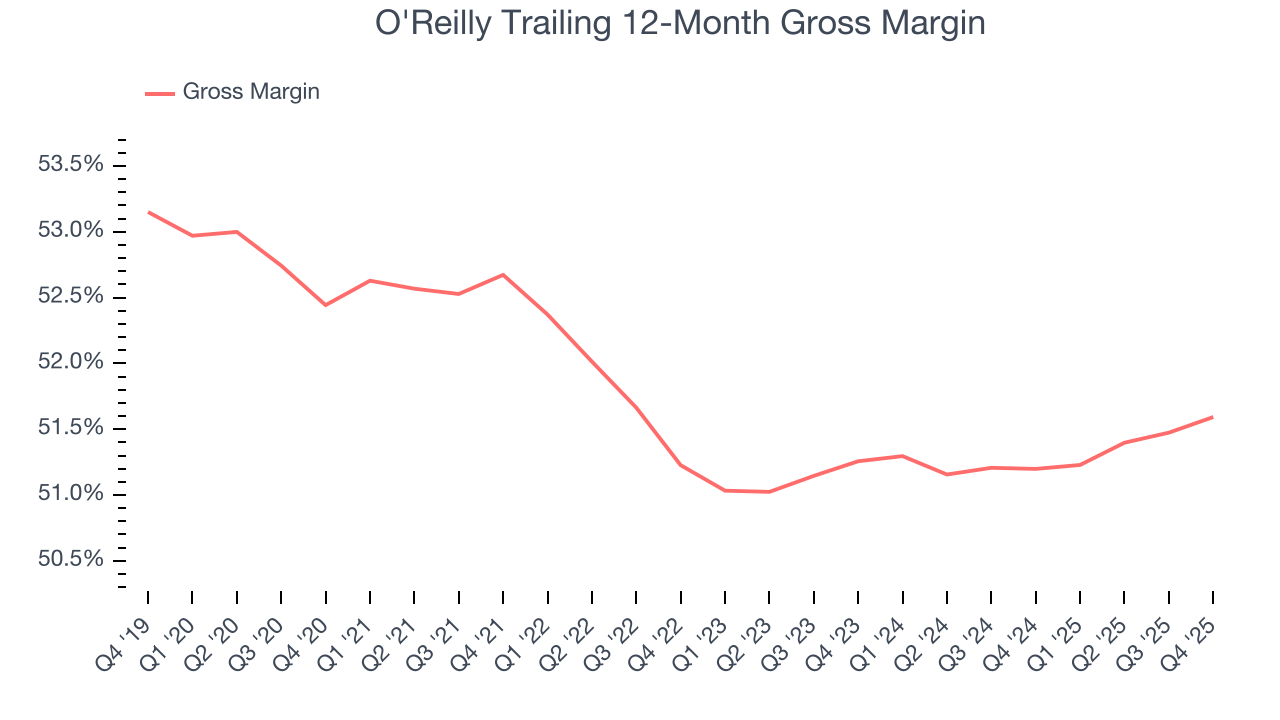
O'Reilly produced a 51.8% gross profit margin in Q4, in line with the same quarter last year. On a wider time horizon, the company’s full-year margin has remained steady over the past four quarters, suggesting it strives to keep prices low for customers and has stable input costs (such as labor and freight expenses to transport goods).
8. Operating Margin
O'Reilly’s operating margin might fluctuated slightly over the last 12 months but has generally stayed the same, averaging 19.5% over the last two years. This profitability was elite for a consumer retail business thanks to its efficient cost structure and economies of scale. This result isn’t surprising as its high gross margin gives it a favorable starting point.
Analyzing the trend in its profitability, O'Reilly’s operating margin might fluctuated slightly but has generally stayed the same over the last year. This raises questions about the company’s expense base because its revenue growth should have given it leverage on its fixed costs, resulting in better economies of scale and profitability.
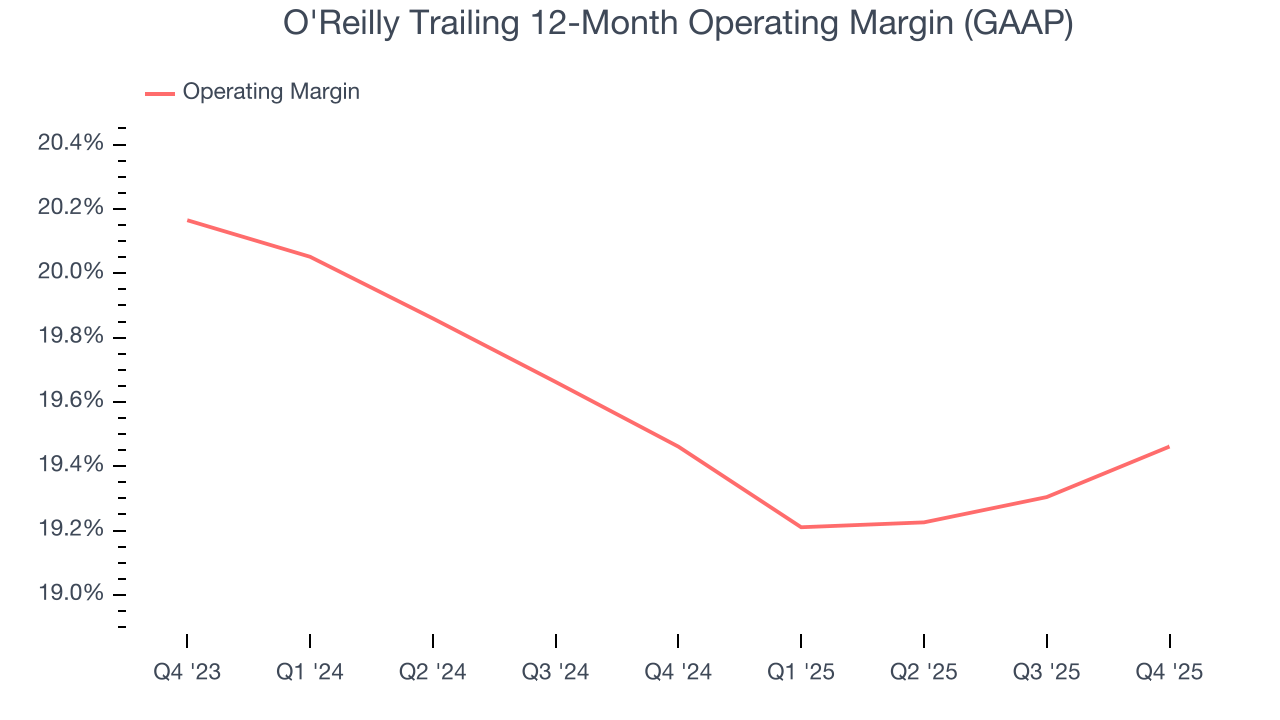
In Q4, O'Reilly generated an operating margin profit margin of 18.8%, in line with the same quarter last year. This indicates the company’s cost structure has recently been stable.
9. Earnings Per Share
Revenue trends explain a company’s historical growth, but the long-term change in earnings per share (EPS) points to the profitability of that growth – for example, a company could inflate its sales through excessive spending on advertising and promotions.
O'Reilly’s EPS grew at an unimpressive 9.9% compounded annual growth rate over the last three years. This performance was better than its flat revenue but doesn’t tell us much about its business quality because its operating margin didn’t improve.
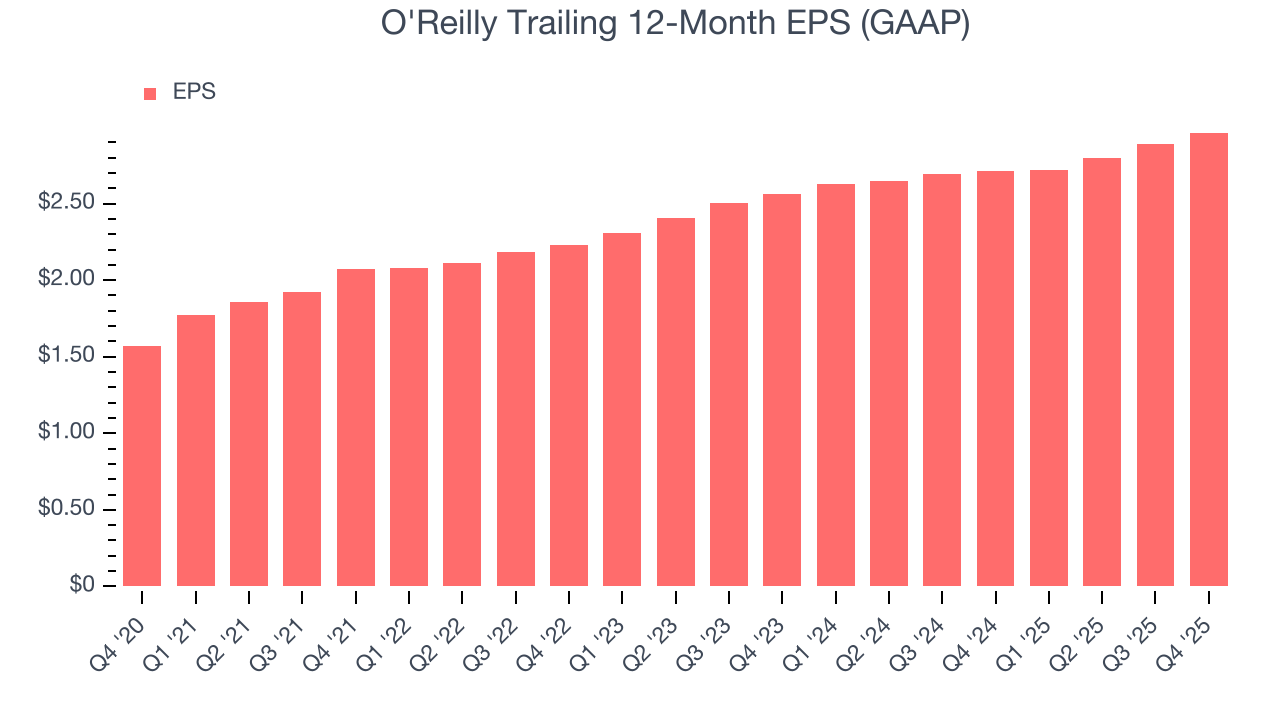
In Q4, O'Reilly reported EPS of $0.71, up from $0.63 in the same quarter last year. Despite growing year on year, this print slightly missed analysts’ estimates. Over the next 12 months, Wall Street expects O'Reilly’s full-year EPS of $2.96 to grow 8.7%.
10. Cash Is King
Free cash flow isn't a prominently featured metric in company financials and earnings releases, but we think it's telling because it accounts for all operating and capital expenses, making it tough to manipulate. Cash is king.
O'Reilly has shown terrific cash profitability, driven by its lucrative business model that enables it to reinvest, return capital to investors, and stay ahead of the competition. The company’s free cash flow margin was among the best in the consumer retail sector, averaging 10.3% over the last two years.
Taking a step back, we can see that O'Reilly’s margin dropped by 3.1 percentage points over the last year. This decrease came from the higher costs associated with opening more stores.
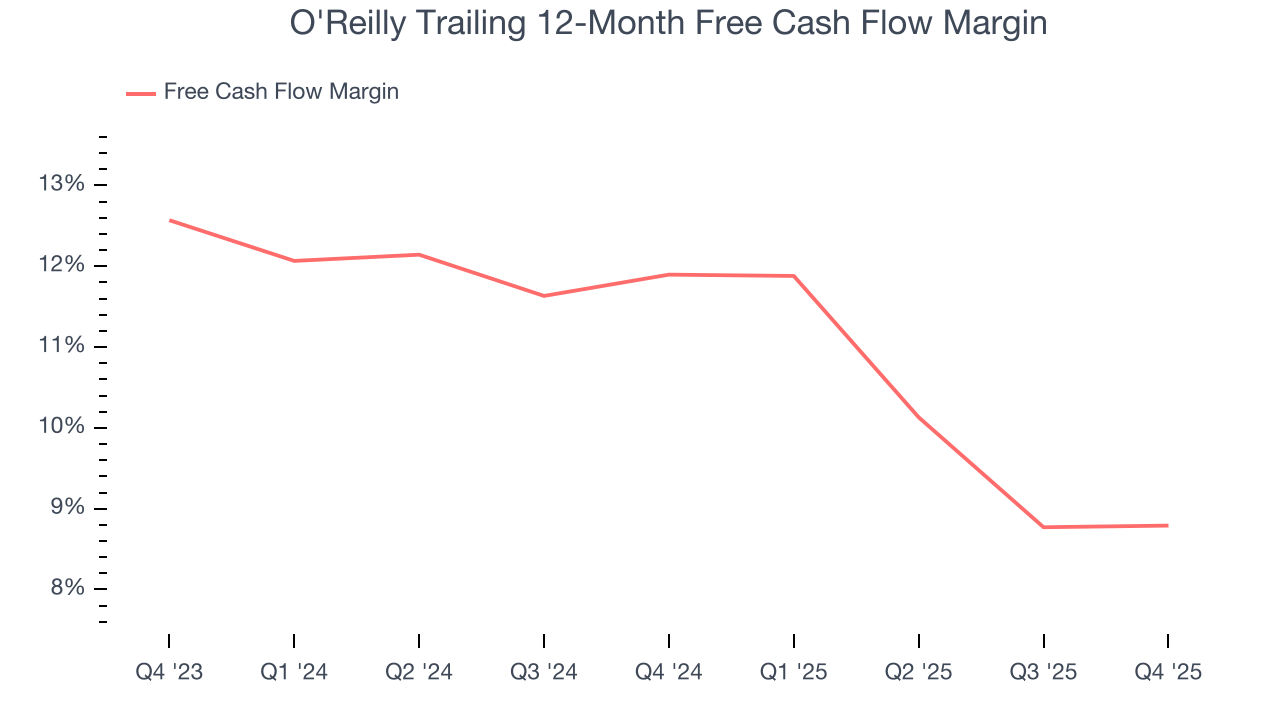
O'Reilly’s free cash flow clocked in at $362.2 million in Q4, equivalent to a 8.2% margin. This cash profitability was in line with the comparable period last year but below its two-year average. We wouldn’t read too much into it because investment needs can be seasonal, leading to short-term swings. Long-term trends carry greater meaning.
11. Return on Invested Capital (ROIC)
EPS and free cash flow tell us whether a company was profitable while growing its revenue. But was it capital-efficient? Enter ROIC, a metric showing how much operating profit a company generates relative to the money it has raised (debt and equity).
O'Reilly’s five-year average ROIC was 42.5%, placing it among the best consumer retail companies. This illustrates its management team’s ability to invest in highly profitable ventures and produce tangible results for shareholders.
12. Balance Sheet Assessment
O'Reilly reported $193.8 million of cash and $8.49 billion of debt on its balance sheet in the most recent quarter. As investors in high-quality companies, we primarily focus on two things: 1) that a company’s debt level isn’t too high and 2) that its interest payments are not excessively burdening the business.
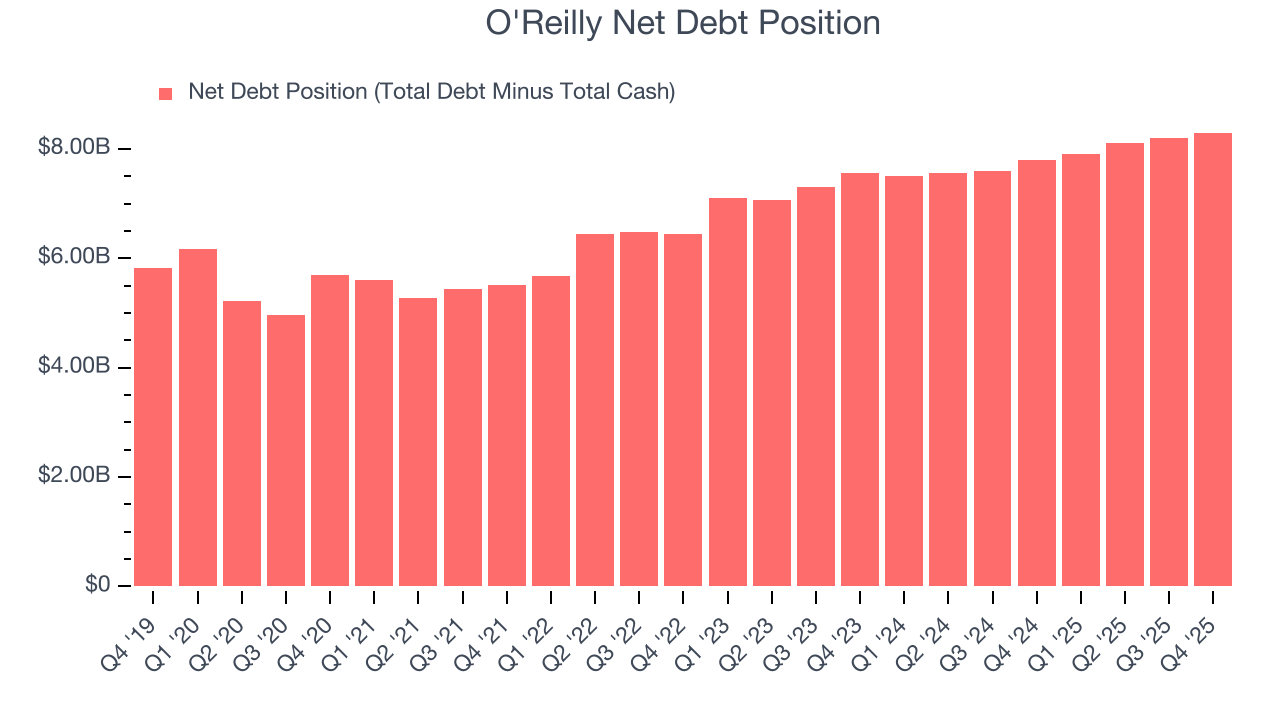
With $4.01 billion of EBITDA over the last 12 months, we view O'Reilly’s 2.1× net-debt-to-EBITDA ratio as safe. We also see its $110.5 million of annual interest expenses as appropriate. The company’s profits give it plenty of breathing room, allowing it to continue investing in growth initiatives.
13. Key Takeaways from O'Reilly’s Q4 Results
It was good to see O'Reilly meet analysts’ revenue expectations this quarter. We were also happy its gross margin narrowly outperformed Wall Street’s estimates. On the other hand, its full-year EPS guidance missed and its full-year revenue guidance fell slightly short of Wall Street’s estimates. Overall, this was a weaker quarter. The stock traded down 3.4% to $93.49 immediately after reporting.
14. Is Now The Time To Buy O'Reilly?
Updated: March 28, 2026 at 10:38 PM EDT
When considering an investment in O'Reilly, investors should account for its valuation and business qualities as well as what’s happened in the latest quarter.
O'Reilly is a high-quality business worth owning. Although the company’s revenue growth was a little slower over the last three years, its impressive operating margins show it has a highly efficient business model. On top of that, O'Reilly’s stellar ROIC suggests it has been a well-run company historically.
O'Reilly’s P/E ratio based on the next 12 months is 28.6x. Analyzing the consumer retail landscape today, O'Reilly’s positive attributes shine bright. We like the stock at this price.
Wall Street analysts have a consensus one-year price target of $105.72 on the company (compared to the current share price of $90.00), implying they see 17.5% upside in buying O'Reilly in the short term.