
Preferred Bank (PFBC)
We’re cautious of Preferred Bank. Its revenue and earnings have recently declined, showing the business is backed into a corner.― StockStory Analyst Team
1. News


2. Summary
Why Preferred Bank Is Not Exciting
Founded in 1991 with a focus on serving the Pacific Rim community in Southern California, Preferred Bank (NASDAQ:PFBC) is a commercial bank that provides banking products and services to small and mid-sized businesses, entrepreneurs, real estate developers, and high net worth individuals.
- Estimated net interest income growth of 2.6% for the next 12 months implies demand will slow from its five-year trend
- Estimated tangible book value per share growth of 10.5% for the next 12 months implies profitability will slow from its two-year trend
- One positive is that its annual tangible book value per share growth of 13% over the past five years was outstanding, reflecting strong capital accumulation this cycle


Preferred Bank’s quality is insufficient. There are better opportunities in the market.
Why There Are Better Opportunities Than Preferred Bank


Preferred Bank’s stock price of $89.35 implies a valuation ratio of 1.2x forward P/B. This multiple is higher than that of banking peers; it’s also rich for the business quality. Not a great combination.
There are stocks out there featuring similar valuation multiples with better fundamentals. We prefer to invest in those.
3. Preferred Bank (PFBC) Research Report: Q4 CY2025 Update
Commercial banking company Preferred Bank (NASDAQ:PFBC) announced better-than-expected revenue in Q4 CY2025, with sales up 7.2% year on year to $78.07 million. Its GAAP profit of $2.79 per share was in line with analysts’ consensus estimates.
Preferred Bank (PFBC) Q4 CY2025 Highlights:
- Net Interest Income: $69.98 million vs analyst estimates of $70.23 million (1.2% year-on-year growth, in line)
- Net Interest Margin: 3.7% vs analyst estimates of 3.8% (6.6 basis point miss)
- Revenue: $78.07 million vs analyst estimates of $74.5 million (7.2% year-on-year growth, 4.8% beat)
- Efficiency Ratio: 31.2% vs analyst estimates of 29.7% (150 basis point miss)
- EPS (GAAP): $2.79 vs analyst estimates of $2.79 (in line)
- Tangible Book Value per Share: $64.83 vs analyst estimates of $64.45 (12% year-on-year growth, 0.6% beat)
- Market Capitalization: $1.22 billion
Company Overview
Founded in 1991 with a focus on serving the Pacific Rim community in Southern California, Preferred Bank (NASDAQ:PFBC) is a commercial bank that provides banking products and services to small and mid-sized businesses, entrepreneurs, real estate developers, and high net worth individuals.
Preferred Bank operates through several specialized business segments, each targeting specific customer needs. Its Real Estate Finance division provides construction loans and mini-permanent financing for residential and commercial properties, serving developers and property investors. The Middle Market Business segment caters to companies with annual sales between $5 million and $100 million, offering equipment financing, working capital loans, and cash management solutions.
The bank's Trade Finance services support importers and exporters with documentary collections, letters of credit, and foreign exchange services—essential tools for businesses engaged in international commerce. For affluent clients, particularly those from Pacific Rim communities residing in Southern California, the High-Wealth Banking segment delivers specialized banking products tailored to their unique financial needs.
A typical client might be a mid-sized manufacturing business seeking both working capital financing to manage seasonal inventory fluctuations and trade finance services to facilitate imports of raw materials from Asia. The business owner might simultaneously utilize the bank's High-Wealth Banking services for personal financial management.
Preferred Bank generates revenue primarily through interest income on loans and fees from various banking services. Its technology investments include mobile banking platforms, online account opening capabilities, and treasury management systems that enhance customer experience while streamlining operations. The bank's relationship-focused approach emphasizes personalized service and customized financial solutions, allowing it to compete effectively against larger financial institutions in its Southern California market.
4. Regional Banks
Regional banks, financial institutions operating within specific geographic areas, serve as intermediaries between local depositors and borrowers. They benefit from rising interest rates that improve net interest margins (the difference between loan yields and deposit costs), digital transformation reducing operational expenses, and local economic growth driving loan demand. However, these banks face headwinds from fintech competition, deposit outflows to higher-yielding alternatives, credit deterioration (increasing loan defaults) during economic slowdowns, and regulatory compliance costs. Recent concerns about regional bank stability following high-profile failures and significant commercial real estate exposure present additional challenges.
Preferred Bank competes with other regional commercial banks in Southern California such as East West Bancorp (NASDAQ: EWBC), Cathay General Bancorp (NASDAQ: CATY), and larger national institutions like JPMorgan Chase (NYSE: JPM) and Bank of America (NYSE: BAC) that also serve the small and mid-sized business market.
5. Sales Growth
In general, banks make money from two primary sources. The first is net interest income, which is interest earned on loans, mortgages, and investments in securities minus interest paid out on deposits. The second source is non-interest income, which can come from bank account, credit card, wealth management, investing banking, and trading fees. Thankfully, Preferred Bank’s 10% annualized revenue growth over the last five years was decent. Its growth was slightly above the average banking company and shows its offerings resonate with customers.
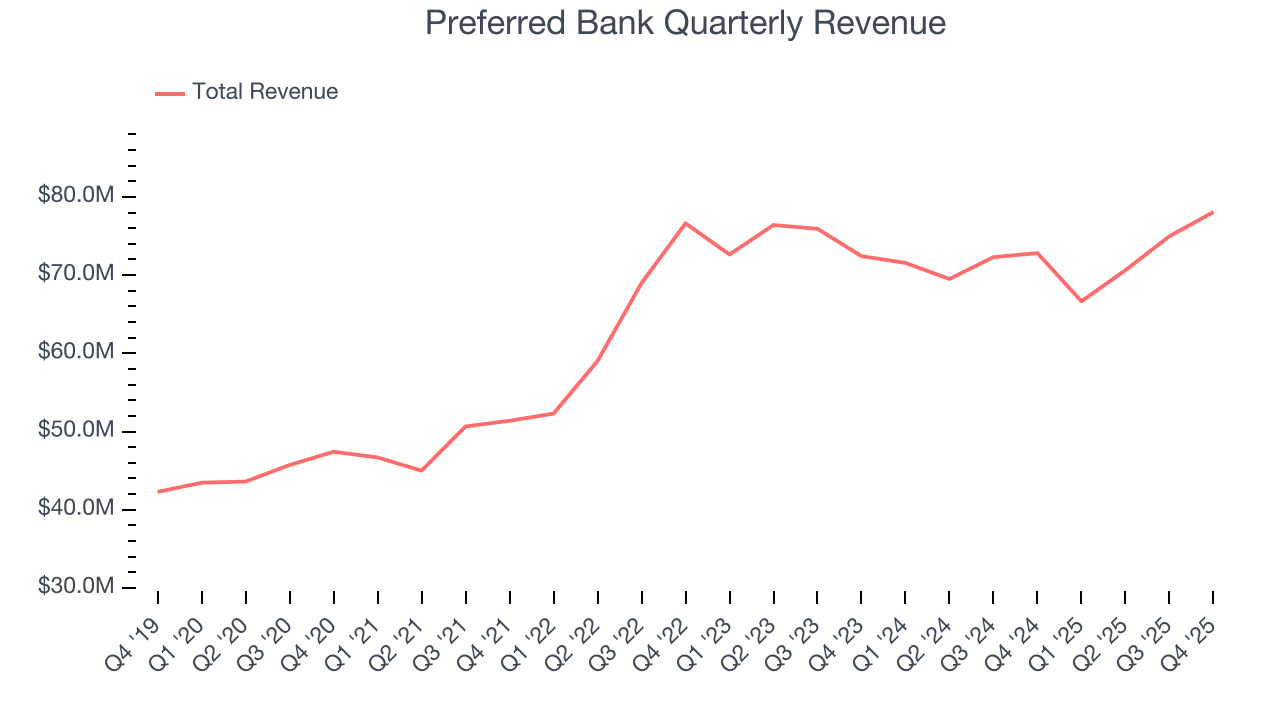
We at StockStory place the most emphasis on long-term growth, but within financials, a half-decade historical view may miss recent interest rate changes, market returns, and industry trends. Preferred Bank’s recent performance marks a sharp pivot from its five-year trend as its revenue has shown annualized declines of 1.2% over the last two years. 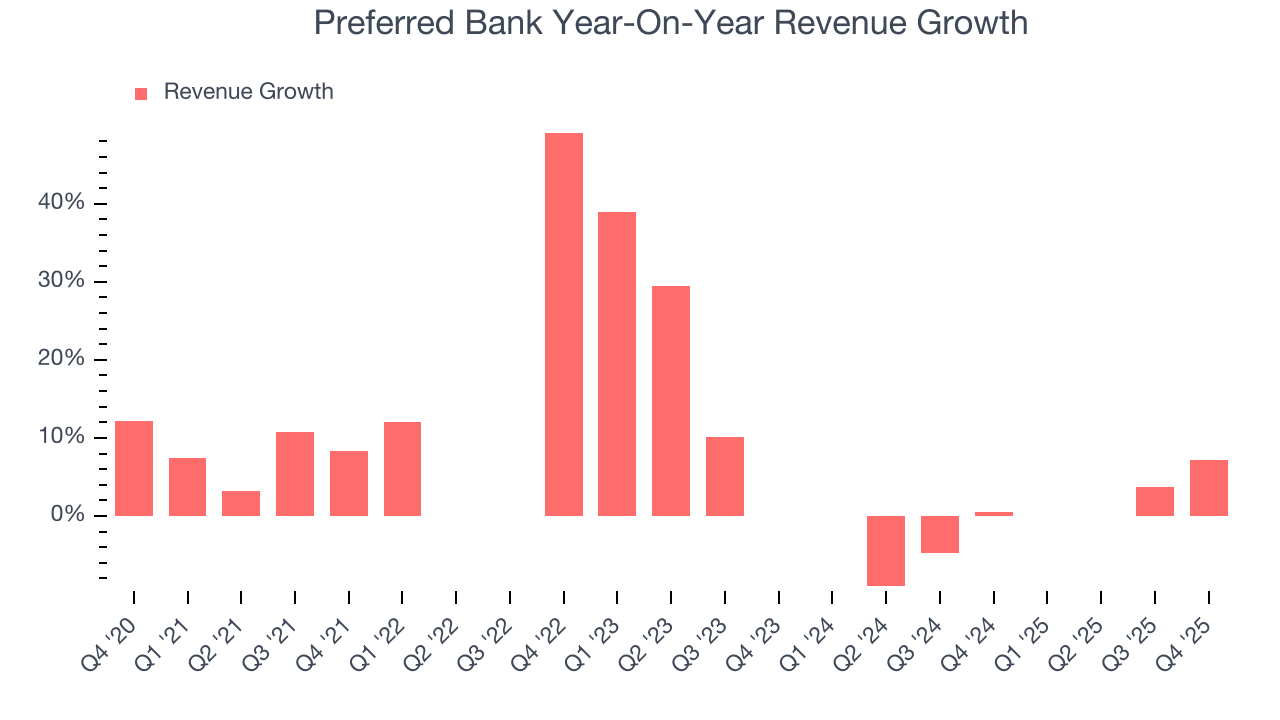 Note: Quarters not shown were determined to be outliers, impacted by outsized investment gains/losses that are not indicative of the recurring fundamentals of the business.
This quarter, Preferred Bank reported year-on-year revenue growth of 7.2%, and its $78.07 million of revenue exceeded Wall Street’s estimates by 4.8%.
Net interest income made up 95.6% of the company’s total revenue during the last five years, meaning Preferred Bank lives and dies by its lending activities because non-interest income barely moves the needle.
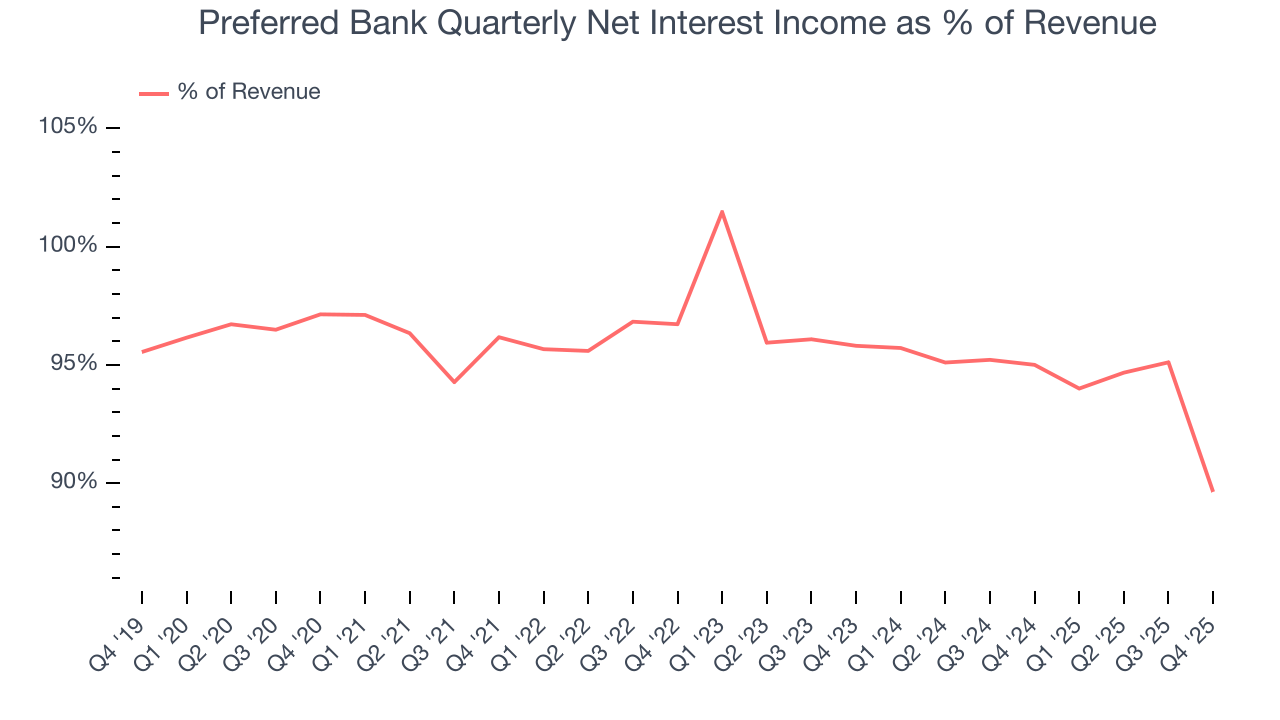
Net interest income commands greater market attention due to its reliability and consistency, whereas non-interest income is often seen as lower-quality revenue that lacks the same dependable characteristics.
6. Efficiency Ratio
Topline growth is certainly important, but the overall profitability of this growth matters for the bottom line. For banks, we look at efficiency ratio, which is non-interest expense (salaries, rent, IT, marketing, excluding interest paid out to depositors) as a percentage of total revenue.
Investors place greater emphasis on efficiency ratio movements than absolute values, understanding that expense structures reflect revenue mix variations. Lower ratios represent better operational performance since they show banks generating more revenue per dollar of expense.
Over the last five years, Preferred Bank’s efficiency ratio couldn’t build momentum, hanging around 31.7%.
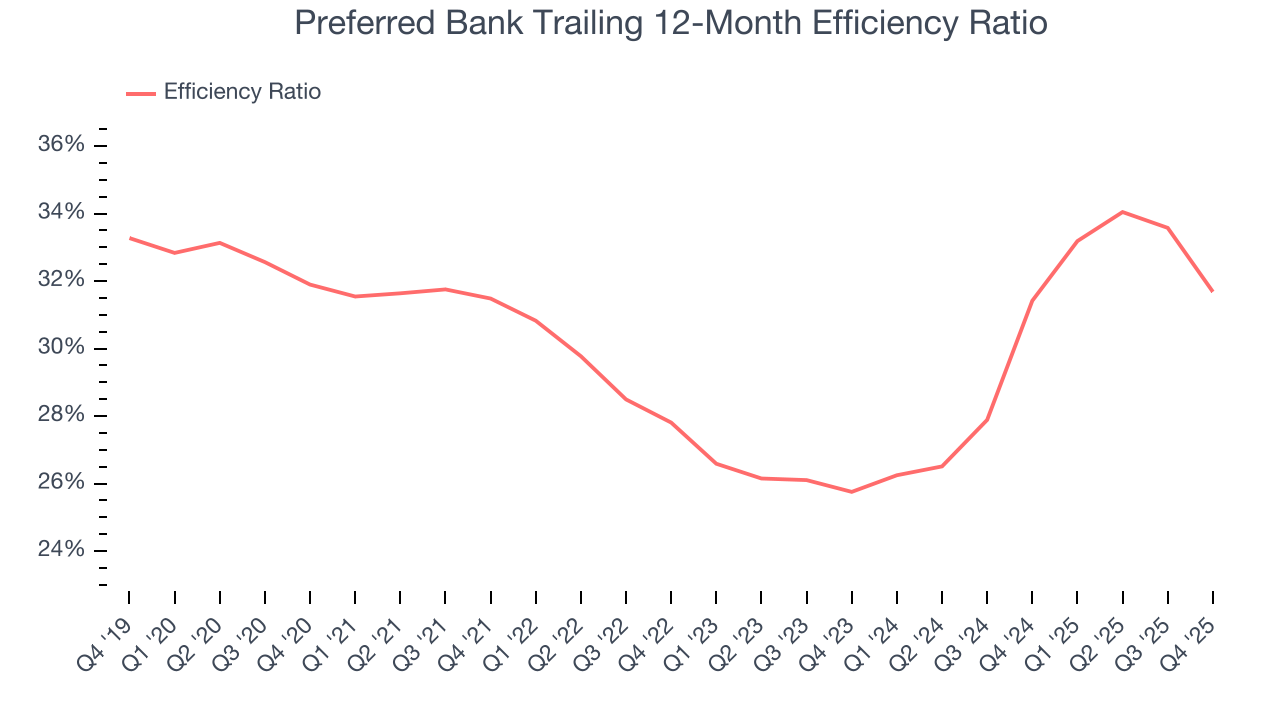
In Q4, Preferred Bank’s efficiency ratio was 31.2%, falling short of analysts’ expectations by 150.2 basis points (100 basis points = 1 percentage point). This result was 7.6 percentage points better than the same quarter last year.
For the next 12 months, Wall Street expects Preferred Bank to maintain its trailing one-year ratio with a projection of 32%.
7. Earnings Per Share
We track the long-term change in earnings per share (EPS) for the same reason as long-term revenue growth. Compared to revenue, however, EPS highlights whether a company’s growth is profitable.
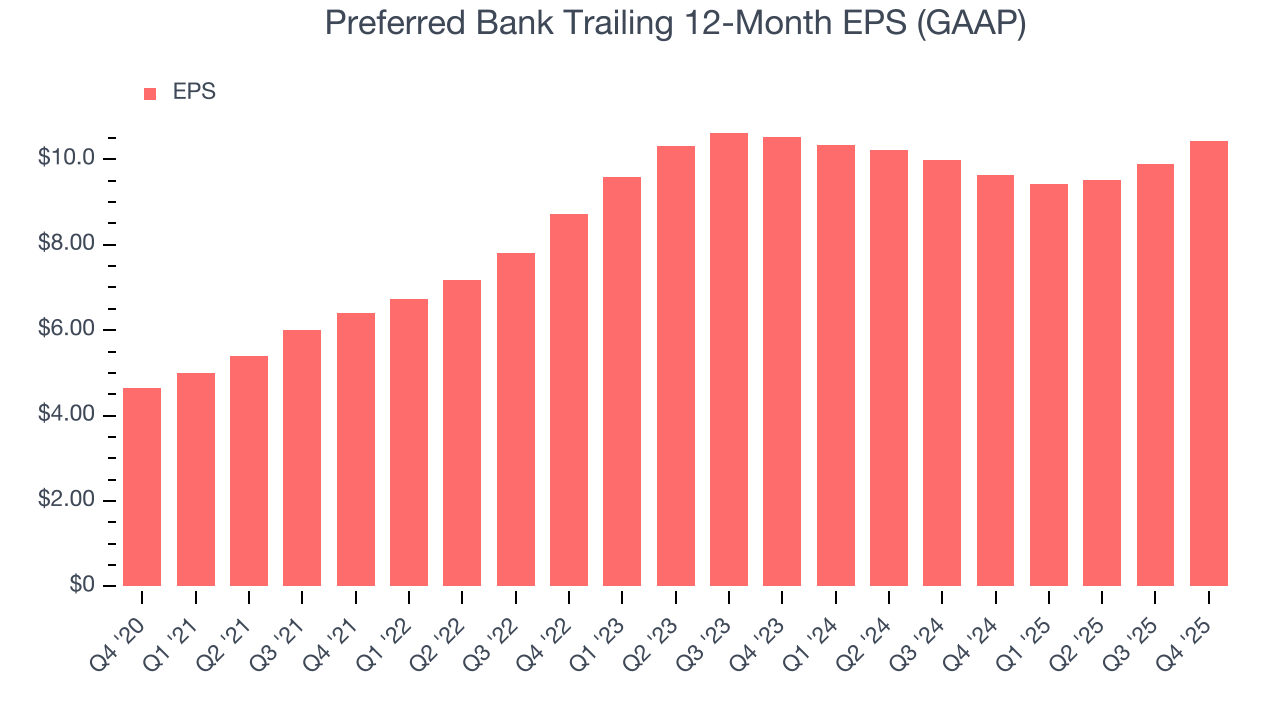
Preferred Bank’s EPS grew at an astounding 17.5% compounded annual growth rate over the last five years, higher than its 10% annualized revenue growth. However, this alone doesn’t tell us much about its business quality because its efficiency ratio didn’t improve.
Like with revenue, we analyze EPS over a more recent period because it can provide insight into an emerging theme or development for the business.
For Preferred Bank, EPS didn’t budge over the last two years, a regression from its five-year trend. We hope it can revert to earnings growth in the coming years.
In Q4, Preferred Bank reported EPS of $2.79, up from $2.25 in the same quarter last year. This print was close to analysts’ estimates. Over the next 12 months, Wall Street expects Preferred Bank’s full-year EPS of $10.44 to stay about the same.
8. Tangible Book Value Per Share (TBVPS)
The balance sheet drives banking profitability since earnings flow from the spread between borrowing and lending rates. As such, valuations for these companies concentrate on capital strength and sustainable equity accumulation potential.
Because of this, tangible book value per share (TBVPS) emerges as the critical performance benchmark. By excluding intangible assets with uncertain liquidation values, this metric captures real, liquid net worth per share. On the other hand, EPS is often distorted by mergers and flexible loan loss accounting. TBVPS provides clearer performance insights.
Preferred Bank’s TBVPS grew at an incredible 13% annual clip over the last five years. The last two years show a similar trajectory as TBVPS grew by 12.6% annually from $51.17 to $64.83 per share.
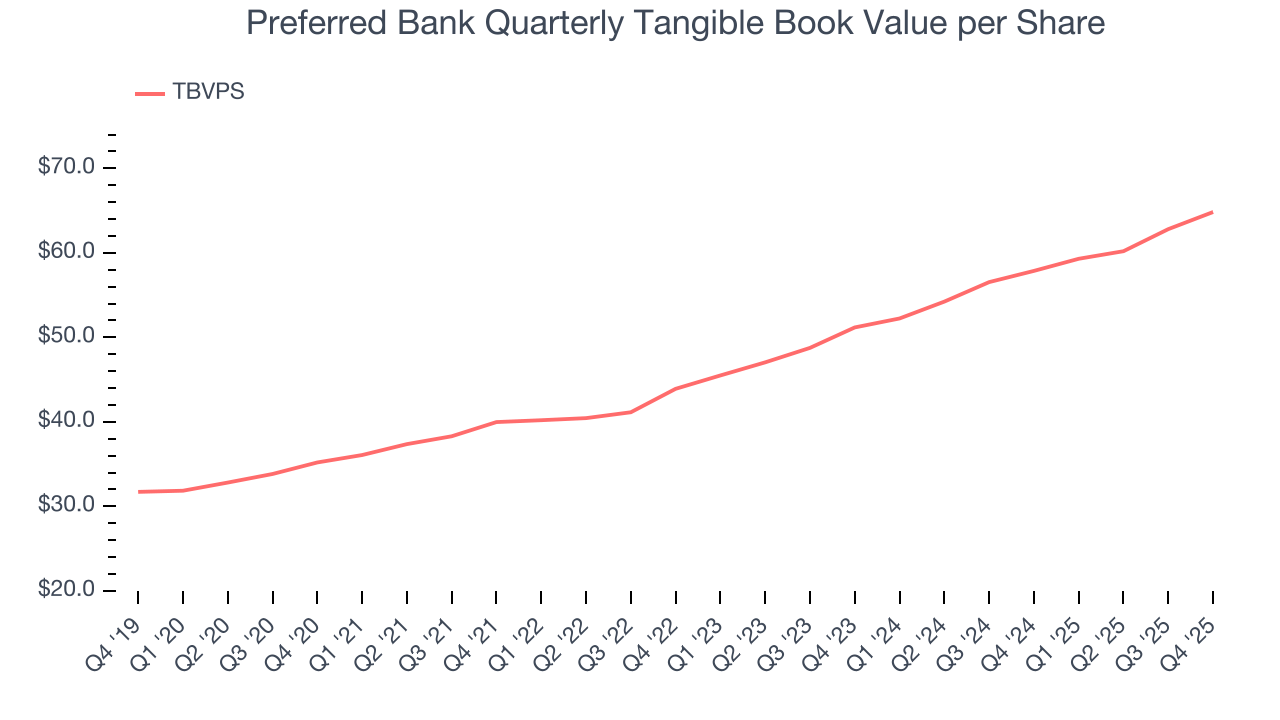
Over the next 12 months, Consensus estimates call for Preferred Bank’s TBVPS to grow by 10.3% to $71.49, mediocre growth rate.
9. Balance Sheet Assessment
Leverage is core to a financial firm’s business model (loans funded by deposits). To ensure economic stability and avoid a repeat of the 2008 GFC, regulators require certain levels of capital and liquidity, focusing on the Tier 1 capital ratio.
Tier 1 capital is the highest-quality capital that a firm holds, consisting primarily of common stock and retained earnings, but also physical gold. It serves as the primary cushion against losses and is the first line of defense in times of financial distress.
This capital is divided by risk-weighted assets to derive the Tier 1 capital ratio. Risk-weighted means that cash and US treasury securities are assigned little risk while unsecured consumer loans and equity investments get much higher risk weights, for example.
New regulation after the 2008 financial crisis requires that all firms must maintain a Tier 1 capital ratio greater than 4.5%. On top of this, there are additional buffers based on scale, risk profile, and other regulatory classifications, so that at the end of the day, firms generally must maintain a 7-10% ratio at minimum.
Over the last two years, Preferred Bank has averaged a Tier 1 capital ratio of 11.5%, which is considered safe and well capitalized in the event that macro or market conditions suddenly deteriorate.
10. Return on Equity
Return on equity (ROE) reveals the profit generated per dollar of shareholder equity, which represents a key source of bank funding. Banks maintaining elevated ROE levels tend to accelerate wealth creation for shareholders via earnings retention, buybacks, and distributions.
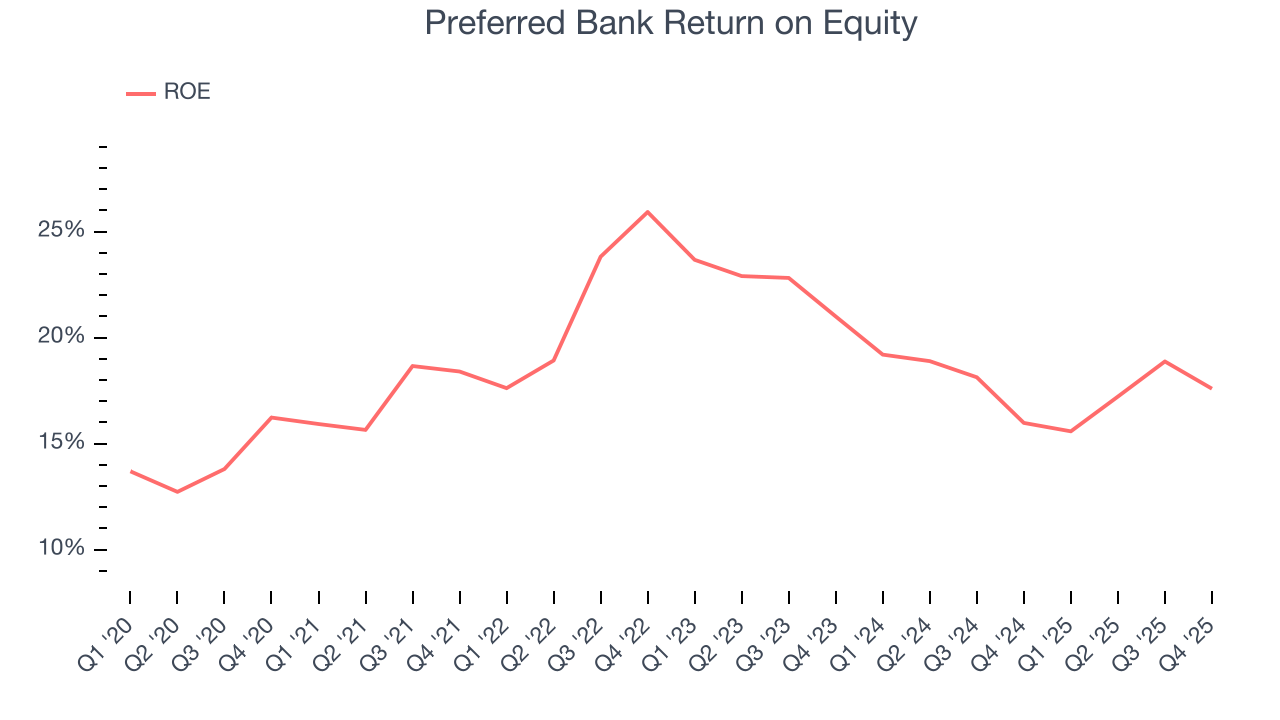
Over the last five years, Preferred Bank has averaged an ROE of 19.3%, exceptional for a company operating in a sector where the average shakes out around 7.5% and those putting up 15%+ are greatly admired. This is a bright spot for Preferred Bank.
11. Key Takeaways from Preferred Bank’s Q4 Results
We enjoyed seeing Preferred Bank beat analysts’ revenue expectations this quarter. We were also happy its tangible book value per share narrowly outperformed Wall Street’s estimates. On the other hand, its EPS was in line and its net interest income was in line with Wall Street’s estimates. Zooming out, we think this was a fine quarter with no major surprises. The stock remained flat at $99.32 immediately after reporting.
12. Is Now The Time To Buy Preferred Bank?
Updated: March 18, 2026 at 12:48 AM EDT
Are you wondering whether to buy Preferred Bank or pass? We urge investors to not only consider the latest earnings results but also longer-term business quality and valuation as well.
Preferred Bank’s business quality ultimately falls short of our standards. Although its revenue growth was decent over the last five years, it’s expected to deteriorate over the next 12 months and its declining net interest margin shows its loan book is becoming less profitable. And while the company’s TBVPS growth was exceptional over the last five years, the downside is its estimated net interest income for the next 12 months are weak.
Preferred Bank’s P/B ratio based on the next 12 months is 1.2x. While this valuation is reasonable, we don’t really see a big opportunity at the moment. We're fairly confident there are better stocks to buy right now.
Wall Street analysts have a consensus one-year price target of $102 on the company (compared to the current share price of $89.35).