Red Rock Resorts (RRR)
We wouldn’t recommend Red Rock Resorts. Its sales have underperformed and its low returns on capital show it has few growth opportunities.― StockStory Analyst Team
1. News


2. Summary
Why We Think Red Rock Resorts Will Underperform
Founded in 1976, Red Rock Resorts (NASDAQ:RRR) operates a range of casino resorts and entertainment properties, primarily in the Las Vegas metropolitan area.
- 11.2% annual revenue growth over the last five years was slower than its consumer discretionary peers
- Poor free cash flow generation means it has few chances to reinvest for growth, repurchase shares, or distribute capital
- Low returns on capital reflect management’s struggle to allocate funds effectively, and its decreasing returns suggest its historical profit centers are aging


Red Rock Resorts’s quality is insufficient. You should search for better opportunities.
Why There Are Better Opportunities Than Red Rock Resorts


Red Rock Resorts’s stock price of $53.87 implies a valuation ratio of 19.2x forward P/E. While valuation is appropriate for the quality you get, we’re still on the sidelines for now.
There are stocks out there featuring similar valuation multiples with better fundamentals. We prefer to invest in those.
3. Red Rock Resorts (RRR) Research Report: Q4 CY2025 Update
Casino resort and entertainment company Red Rock Resorts (NASDAQ:RRR) reported Q4 CY2025 results beating Wall Street’s revenue expectations, with sales up 3.2% year on year to $511.8 million. Its GAAP profit of $0.75 per share was 67.7% above analysts’ consensus estimates.
Red Rock Resorts (RRR) Q4 CY2025 Highlights:
- Revenue: $511.8 million vs analyst estimates of $502.4 million (3.2% year-on-year growth, 1.9% beat)
- EPS (GAAP): $0.75 vs analyst estimates of $0.45 (67.7% beat)
- Adjusted EBITDA: $213.3 million vs analyst estimates of $205.9 million (41.7% margin, 3.6% beat)
- Operating Margin: 28.1%, in line with the same quarter last year
- Market Capitalization: $3.88 billion
Company Overview
Founded in 1976, Red Rock Resorts (NASDAQ:RRR) operates a range of casino resorts and entertainment properties, primarily in the Las Vegas metropolitan area.
Red Rock Resorts was founded by Frank Fertitta Jr. with the vision of providing a gaming and hospitality experience tailored to Las Vegas locals. Beginning with The Casino, later renamed Palace Station, the company aimed to provide a comfortable, community-focused alternative to the tourist-centric establishments of the Strip. This approach marked a shift in the local gaming and hospitality landscape, catering to residents and tourists.
The company’s operations span various properties, from local casinos to upscale resorts like Red Rock Casino and Green Valley Ranch Resort Spa & Casino. These establishments offer a mix of gaming, accommodations, dining, and entertainment. Red Rock Resorts has successfully bridged the gap between local preferences and tourist attractions, providing varied leisure experiences in the Las Vegas area.
Revenue for Red Rock Resorts comes from gaming, hotel services, dining, and entertainment. Its business model focuses on delivering an all-encompassing entertainment experience that resonates with both locals and tourists.
4. Casino Operator
Casino operators enjoy limited competition because gambling is a highly regulated industry. These companies can also enjoy healthy margins and profits. Have you ever heard the phrase ‘the house always wins’? Regulation cuts both ways, however, and casinos may face stroke-of-the-pen risk that suddenly limits what they can or can't do and where they can do it. Furthermore, digitization is changing the game, pun intended. Whether it’s online poker or sports betting on your smartphone, innovation is forcing these players to adapt to changing consumer preferences, such as being able to wager anywhere on demand.
Competitors in the gaming and hospitality sector include Boyd Gaming (NYSE:BYD), Golden Entertainment (NASDAQ:GDEN), and MGM Resorts (NYSE:MGM).
5. Revenue Growth
Reviewing a company’s long-term sales performance reveals insights into its quality. Any business can have short-term success, but a top-tier one grows for years. Over the last five years, Red Rock Resorts grew its sales at a 11.2% annual rate. Although this growth is acceptable on an absolute basis, it fell short of our standards for the consumer discretionary sector, which enjoys a number of secular tailwinds.
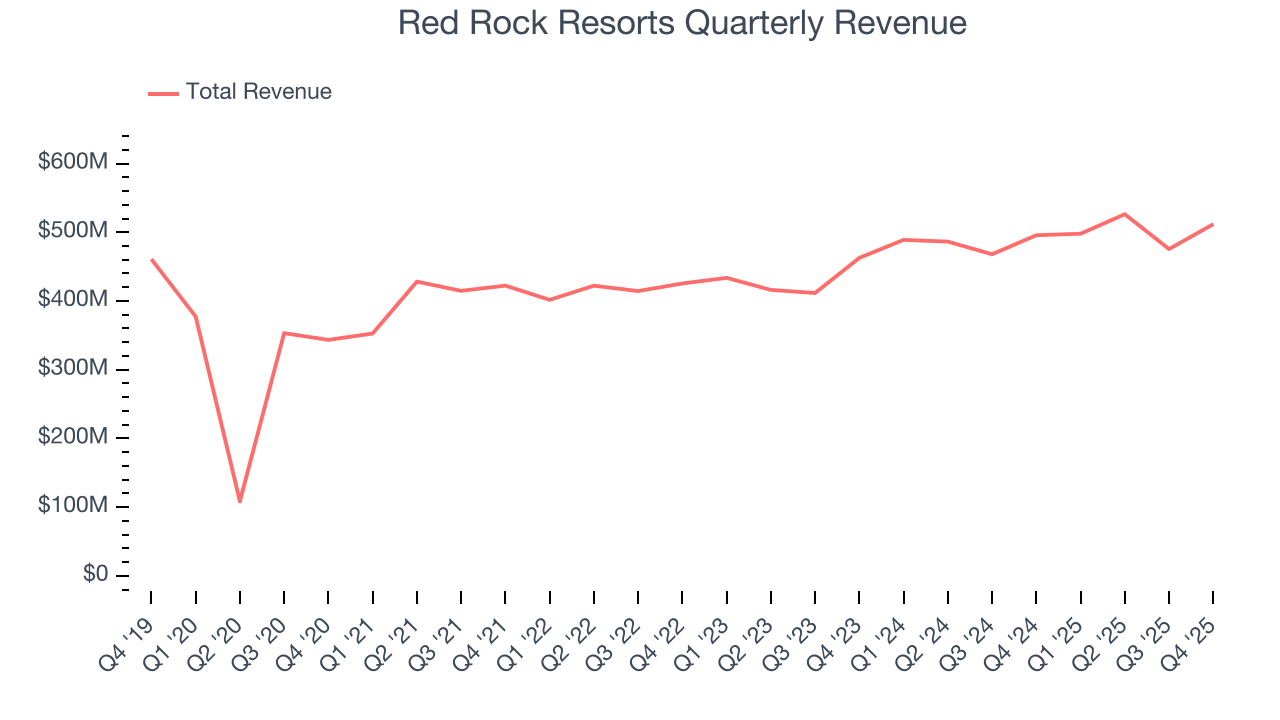
Long-term growth is the most important, but within consumer discretionary, product cycles are short and revenue can be hit-driven due to rapidly changing trends and consumer preferences. Red Rock Resorts’s recent performance shows its demand has slowed as its annualized revenue growth of 8% over the last two years was below its five-year trend. Note that COVID hurt Red Rock Resorts’s business in 2020 and part of 2021, and it bounced back in a big way thereafter. 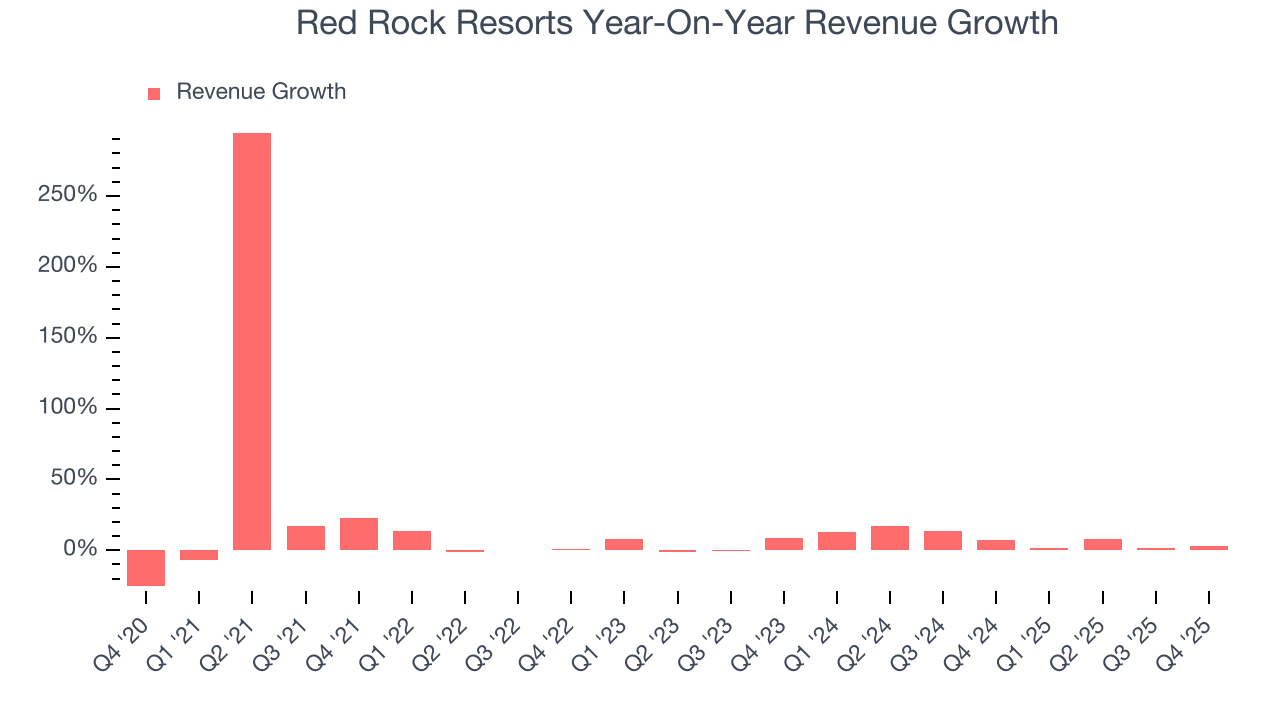
Red Rock Resorts also breaks out the revenue for its three most important segments: Casino, Dining, and Hotel, which are 67%, 18.2%, and 9.2% of revenue. Over the last two years, Red Rock Resorts’s Casino (Blackjack, Poker) and Dining (food and beverage) revenues averaged year-on-year growth of 7.3% and 2% while its Hotel revenue (overnight stays) averaged 8.9% declines. 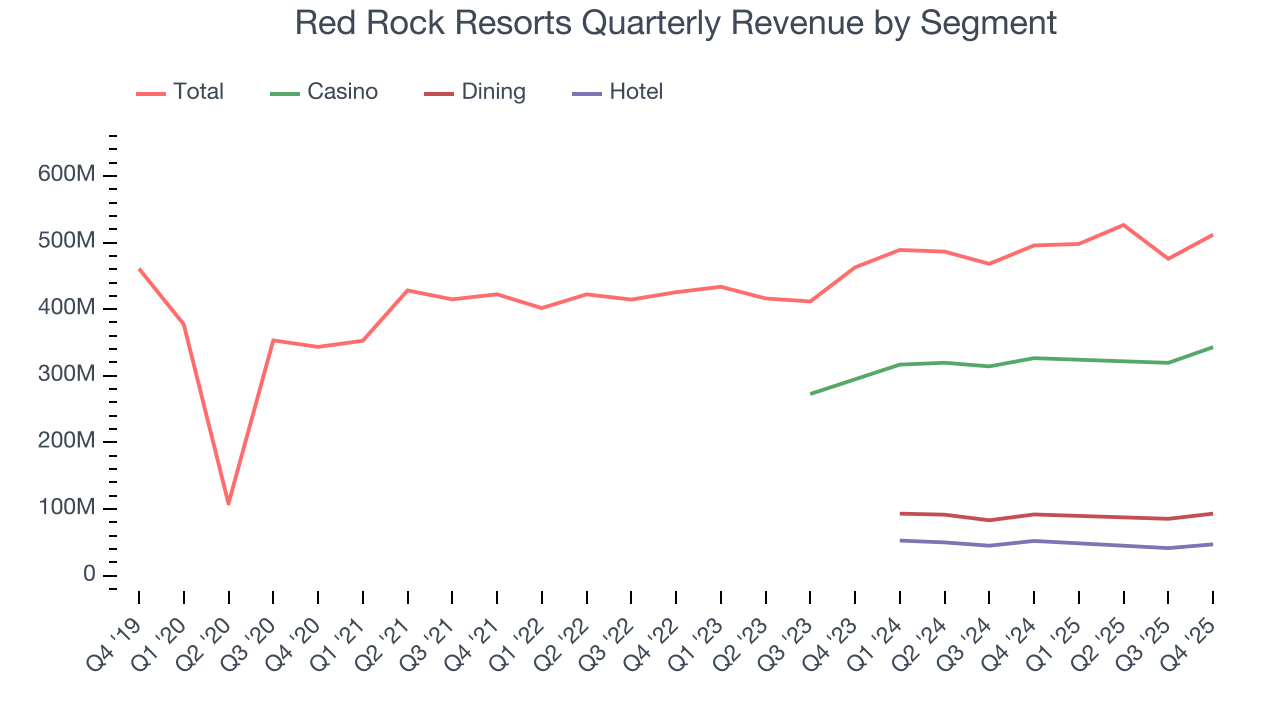
This quarter, Red Rock Resorts reported modest year-on-year revenue growth of 3.2% but beat Wall Street’s estimates by 1.9%.
Looking ahead, sell-side analysts expect revenue to grow 2.2% over the next 12 months, a deceleration versus the last two years. This projection is underwhelming and suggests its products and services will face some demand challenges.
6. Operating Margin
Operating margin is an important measure of profitability as it shows the portion of revenue left after accounting for all core expenses – everything from the cost of goods sold to advertising and wages. It’s also useful for comparing profitability across companies with different levels of debt and tax rates because it excludes interest and taxes.
Red Rock Resorts’s operating margin might fluctuated slightly over the last 12 months but has remained more or less the same, averaging 29.6% over the last two years. This profitability was paltry for a consumer discretionary business and caused by its suboptimal cost structure.
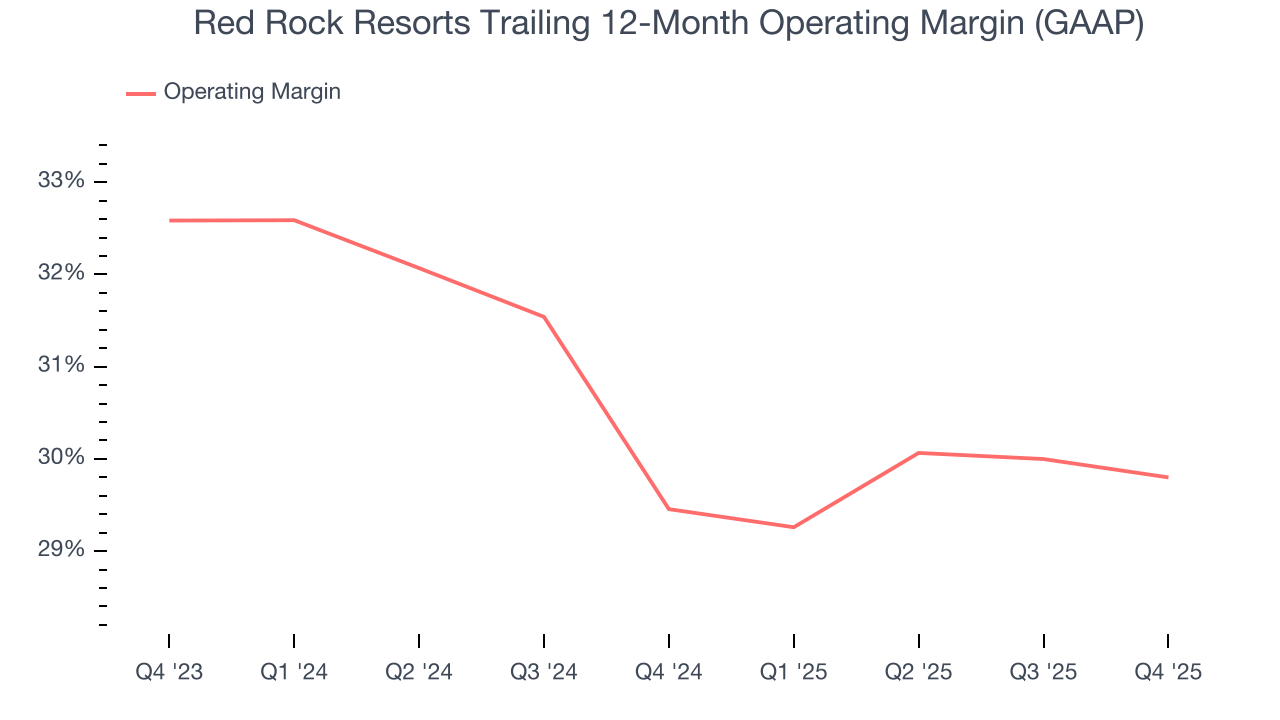
This quarter, Red Rock Resorts generated an operating margin profit margin of 28.1%, in line with the same quarter last year. This indicates the company’s overall cost structure has been relatively stable.
7. Earnings Per Share
We track the long-term change in earnings per share (EPS) for the same reason as long-term revenue growth. Compared to revenue, however, EPS highlights whether a company’s growth is profitable.
Red Rock Resorts’s full-year EPS flipped from negative to positive over the last five years. This is encouraging and shows it’s at a critical moment in its life.
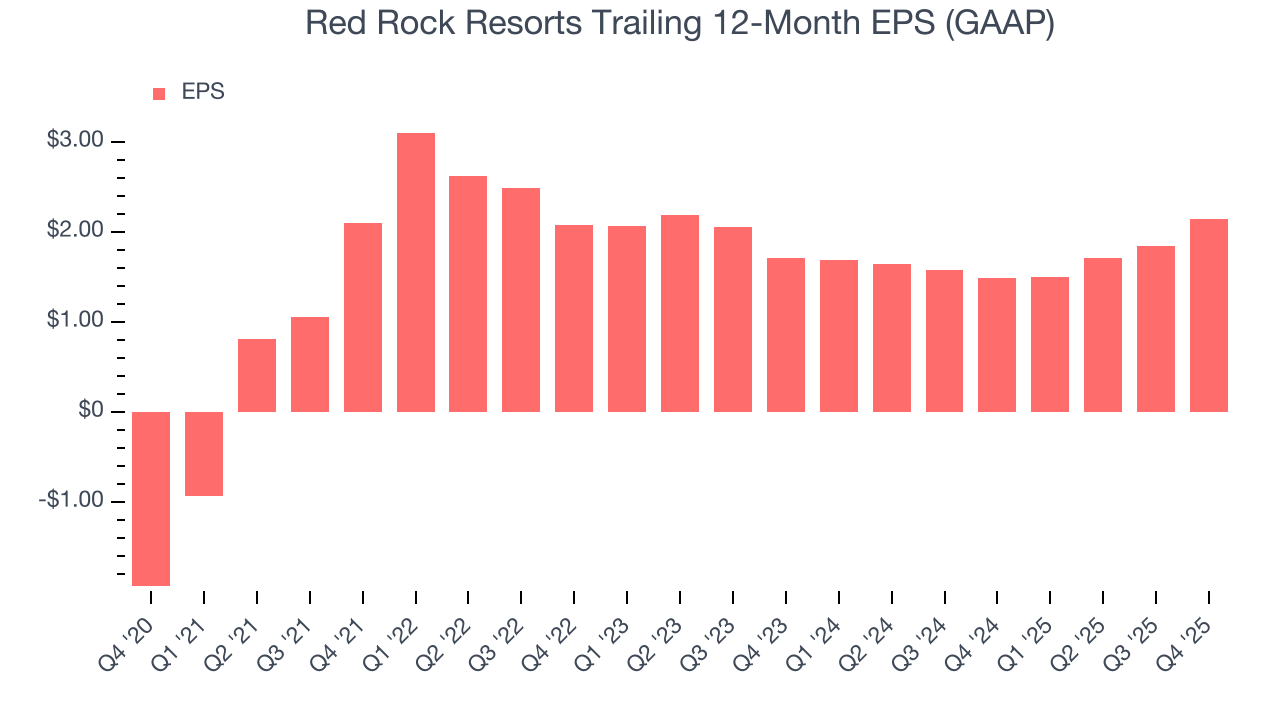
In Q4, Red Rock Resorts reported EPS of $0.75, up from $0.45 in the same quarter last year. This print easily cleared analysts’ estimates, and shareholders should be content with the results. Over the next 12 months, Wall Street expects Red Rock Resorts’s full-year EPS of $2.14 to shrink by 2.4%.
8. Cash Is King
If you’ve followed StockStory for a while, you know we emphasize free cash flow. Why, you ask? We believe that in the end, cash is king, and you can’t use accounting profits to pay the bills.
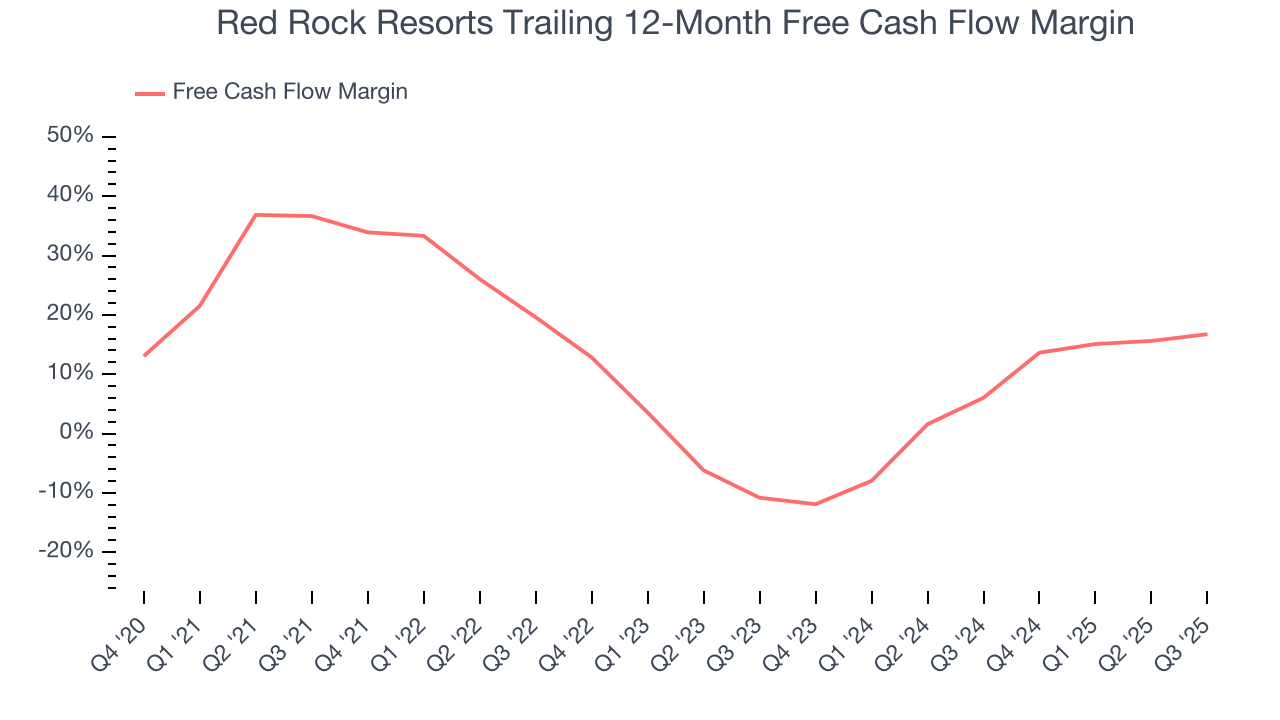
Red Rock Resorts has shown poor cash profitability over the last two years, giving the company limited opportunities to return capital to shareholders. Its free cash flow margin averaged 13.9%, lousy for a consumer discretionary business.
9. Return on Invested Capital (ROIC)
EPS and free cash flow tell us whether a company was profitable while growing its revenue. But was it capital-efficient? Enter ROIC, a metric showing how much operating profit a company generates relative to the money it has raised (debt and equity).
Red Rock Resorts historically did a mediocre job investing in profitable growth initiatives. Its five-year average ROIC was 16.9%, somewhat low compared to the best consumer discretionary companies that consistently pump out 25%+.
We like to invest in businesses with high returns, but the trend in a company’s ROIC is what often surprises the market and moves the stock price. On average, Red Rock Resorts’s ROIC decreased by 1.8 percentage points annually each year over the last few years. Paired with its already low returns, these declines suggest its profitable growth opportunities are few and far between.
10. Balance Sheet Assessment
Red Rock Resorts reported $142.5 million of cash and $3.4 billion of debt on its balance sheet in the most recent quarter. As investors in high-quality companies, we primarily focus on two things: 1) that a company’s debt level isn’t too high and 2) that its interest payments are not excessively burdening the business.
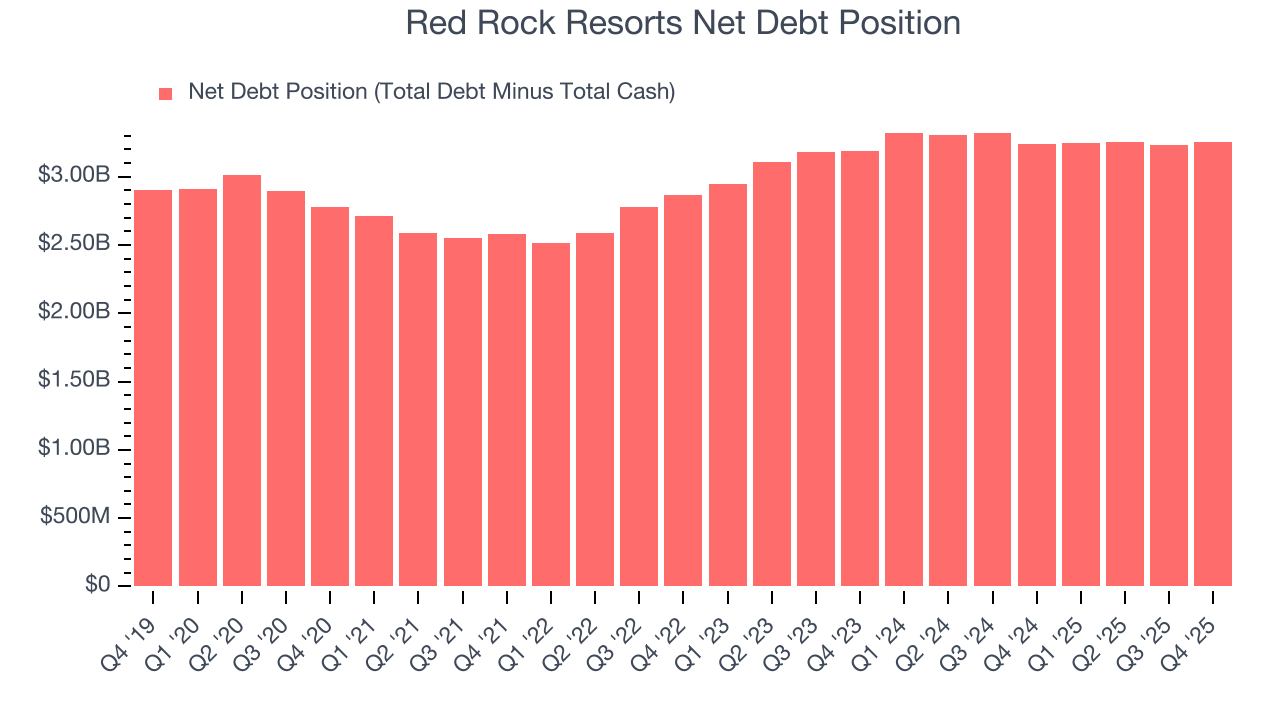
With $848.6 million of EBITDA over the last 12 months, we view Red Rock Resorts’s 3.8× net-debt-to-EBITDA ratio as safe. We also see its $152.2 million of annual interest expenses as appropriate. The company’s profits give it plenty of breathing room, allowing it to continue investing in growth initiatives.
11. Key Takeaways from Red Rock Resorts’s Q4 Results
It was good to see Red Rock Resorts beat analysts’ EPS expectations this quarter. We were also happy its revenue outperformed Wall Street’s estimates. Overall, we think this was a solid quarter with some key areas of upside. The stock remained flat at $66.98 immediately after reporting.
12. Is Now The Time To Buy Red Rock Resorts?
Updated: March 29, 2026 at 11:06 PM EDT
Before deciding whether to buy Red Rock Resorts or pass, we urge investors to consider business quality, valuation, and the latest quarterly results.
Red Rock Resorts doesn’t pass our quality test. While its spectacular EPS growth over the last five years shows its profits are trickling down to shareholders, the downside is its Forecasted free cash flow margin suggests the company will ramp up its investments next year. On top of that, its relatively low ROIC suggests management has struggled to find compelling investment opportunities.
Red Rock Resorts’s P/E ratio based on the next 12 months is 19.2x. This valuation multiple is fair, but we don’t have much confidence in the company. There are better stocks to buy right now.
Wall Street analysts have a consensus one-year price target of $72.94 on the company (compared to the current share price of $53.87).
Although the price target is bullish, readers should exercise caution because analysts tend to be overly optimistic. The firms they work for, often big banks, have relationships with companies that extend into fundraising, M&A advisory, and other rewarding business lines. As a result, they typically hesitate to say bad things for fear they will lose out. We at StockStory do not suffer from such conflicts of interest, so we’ll always tell it like it is.