Starbucks (SBUX)
Starbucks is in for a bumpy ride. Its weak revenue growth and gross margin show it not only lacks demand but also decent unit economics.― StockStory Analyst Team
1. News

2. Summary
Why We Think Starbucks Will Underperform
Started by three friends in Seattle’s historic Pike Place Market, Starbucks (NASDAQ:SBUX) is a globally-renowned coffeehouse chain that offers a wide selection of high-quality coffee, beverages, and food items.
- Poor same-store sales performance over the past two years indicates it’s having trouble bringing new diners into its restaurants
- Earnings per share fell by 5.9% annually over the last six years while its revenue grew, showing its incremental sales were much less profitable
- Estimated sales growth of 3.2% for the next 12 months implies demand will slow from its six-year trend


Starbucks’s quality is lacking. We believe there are better businesses elsewhere.
Why There Are Better Opportunities Than Starbucks
At $95.80 per share, Starbucks trades at 37.1x forward P/E. This multiple is higher than most restaurant companies, and we think it’s quite expensive for the weaker revenue growth you get.
We prefer to invest in similarly-priced but higher-quality companies with superior earnings growth.
3. Starbucks (SBUX) Research Report: Q4 CY2025 Update
Coffeehouse chain Starbucks (NASDAQ:SBUX) reported Q4 CY2025 results beating Wall Street’s revenue expectations, with sales up 5.5% year on year to $9.92 billion. Its non-GAAP profit of $0.56 per share was 4.6% below analysts’ consensus estimates.
Starbucks (SBUX) Q4 CY2025 Highlights:
- Revenue: $9.92 billion vs analyst estimates of $9.66 billion (5.5% year-on-year growth, 2.6% beat)
- Adjusted EPS: $0.56 vs analyst expectations of $0.59 (4.6% miss)
- Adjusted EBITDA: $1.45 billion vs analyst estimates of $1.41 billion (14.6% margin, 2.6% beat)
- Operating Margin: 9%, down from 11.9% in the same quarter last year
- Free Cash Flow Margin: 12.8%, down from 14.7% in the same quarter last year
- Locations: 41,118 at quarter end, up from 40,576 in the same quarter last year
- Same-Store Sales rose 4% year on year (-4% in the same quarter last year)
- Market Capitalization: $109.1 billion
Company Overview
Started by three friends in Seattle’s historic Pike Place Market, Starbucks (NASDAQ:SBUX) is a globally-renowned coffeehouse chain that offers a wide selection of high-quality coffee, beverages, and food items.
Specifically, the company was founded when Jerry Baldwin, Zev Siegl, and Gordon Bowker opened a humble coffee shop in 1971. Their goal was to create a unique, intimate coffeehouse experience where customers could savor freshly brewed coffee while connecting with their communities.
Starbucks’ growth trajectory hit an inflection point in 1982 when it hired Howard Schultz as its director of retail operations and marketing. Schultz played a pivotal role in the company’s expansion and broadened its offerings to include iced beverages, teas, seasonal specialties, food items, and merchandise, catering to a diverse range of tastes and preferences.
Today, Starbucks differentiates itself in a crowded field by focusing on quality, consistency, and customer experience. Each Starbucks store is designed to create a warm and inviting atmosphere, with cozy seating areas and high-speed Wi-Fi, encouraging customers to stay in the store for however long they wish.
Starbucks was also quick to recognize the power of technology. The company’s mobile app allows customers to pre-order items (enabling them to get in and out of the store in less than 30 seconds), pay through their smartphones, customize beverages, and earn compelling rewards.
4. Traditional Fast Food
Traditional fast-food restaurants are renowned for their speed and convenience, boasting menus filled with familiar and budget-friendly items. Their reputations for on-the-go consumption make them favored destinations for individuals and families needing a quick meal. This class of restaurants, however, is fighting the perception that their meals are unhealthy and made with inferior ingredients, a battle that's especially relevant today given the consumers increasing focus on health and wellness.
Some competitors that sell caffeinated beverages and small bites include private company Dunkin’ as well as public companies Dutch Bros (NYSE:BROS), McDonald’s (NYSE:MCD), and Tim Hortons (owned by Restaurant Brands, NYSE:QSR).
5. Revenue Growth
A company’s long-term sales performance can indicate its overall quality. Any business can put up a good quarter or two, but the best consistently grow over the long haul.
With $37.7 billion in revenue over the past 12 months, Starbucks is one of the most widely recognized restaurant chains and benefits from customer loyalty, a luxury many don’t have. Its scale also gives it negotiating leverage with suppliers, enabling it to source its ingredients at a lower cost. However, its scale is a double-edged sword because there are only a finite of number places to build restaurants, making it harder to find incremental growth. To accelerate system-wide sales, Starbucks likely needs to optimize its pricing or lean into new chains and international expansion.
As you can see below, Starbucks’s sales grew at a tepid 5.7% compounded annual growth rate over the last six years.
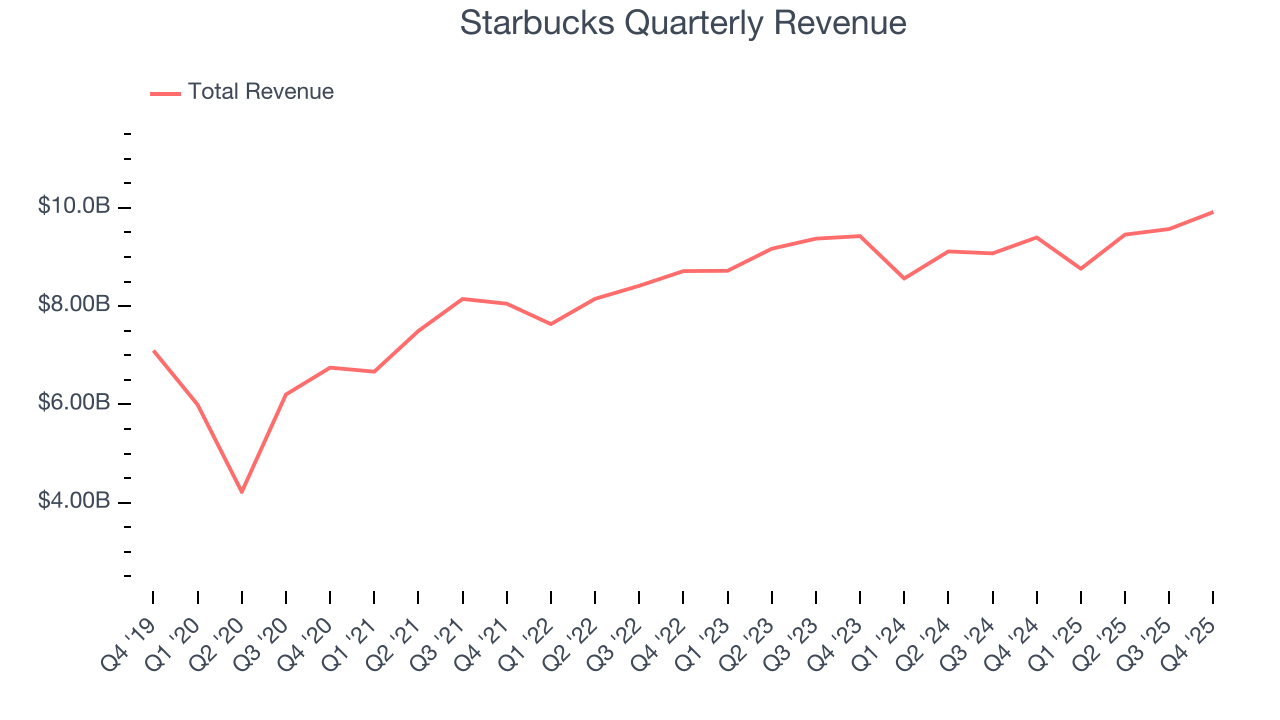
This quarter, Starbucks reported year-on-year revenue growth of 5.5%, and its $9.92 billion of revenue exceeded Wall Street’s estimates by 2.6%.
Looking ahead, sell-side analysts expect revenue to grow 3.1% over the next 12 months, a slight deceleration versus the last six years. This projection doesn't excite us and implies its menu offerings will face some demand challenges.
6. Restaurant Performance
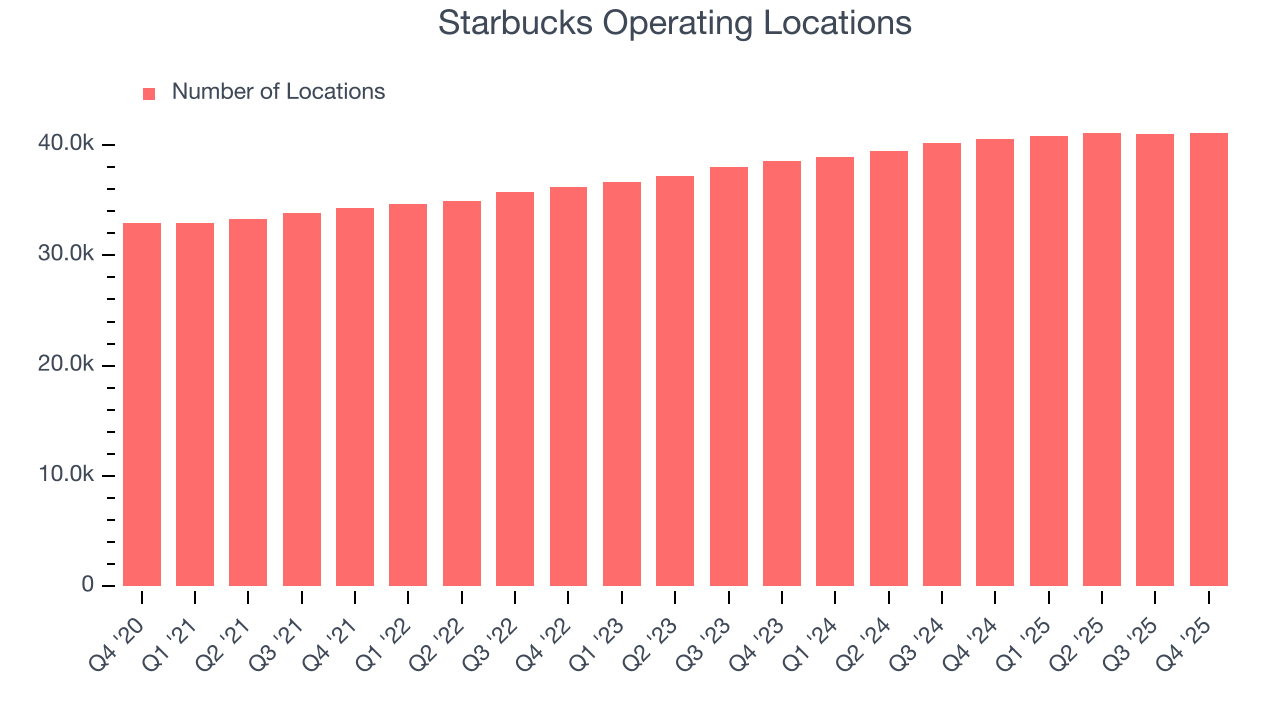
Number of Restaurants
Starbucks sported 41,118 locations in the latest quarter. Over the last two years, it has opened new restaurants at a rapid clip by averaging 4.4% annual growth, among the fastest in the restaurant sector.
When a chain opens new restaurants, it usually means it’s investing for growth because there’s healthy demand for its meals and there are markets where its concepts have few or no locations.
Same-Store Sales
A company's restaurant base only paints one part of the picture. When demand is high, it makes sense to open more. But when demand is low, it’s prudent to close some locations and use the money in other ways. Same-store sales provides a deeper understanding of this issue because it measures organic growth at restaurants open for at least a year.
Starbucks’s demand has been shrinking over the last two years as its same-store sales have averaged 2% annual declines. This performance is concerning - it shows Starbucks artificially boosts its revenue by building new restaurants. We’d like to see a company’s same-store sales rise before it takes on the costly, capital-intensive endeavor of expanding its restaurant base.
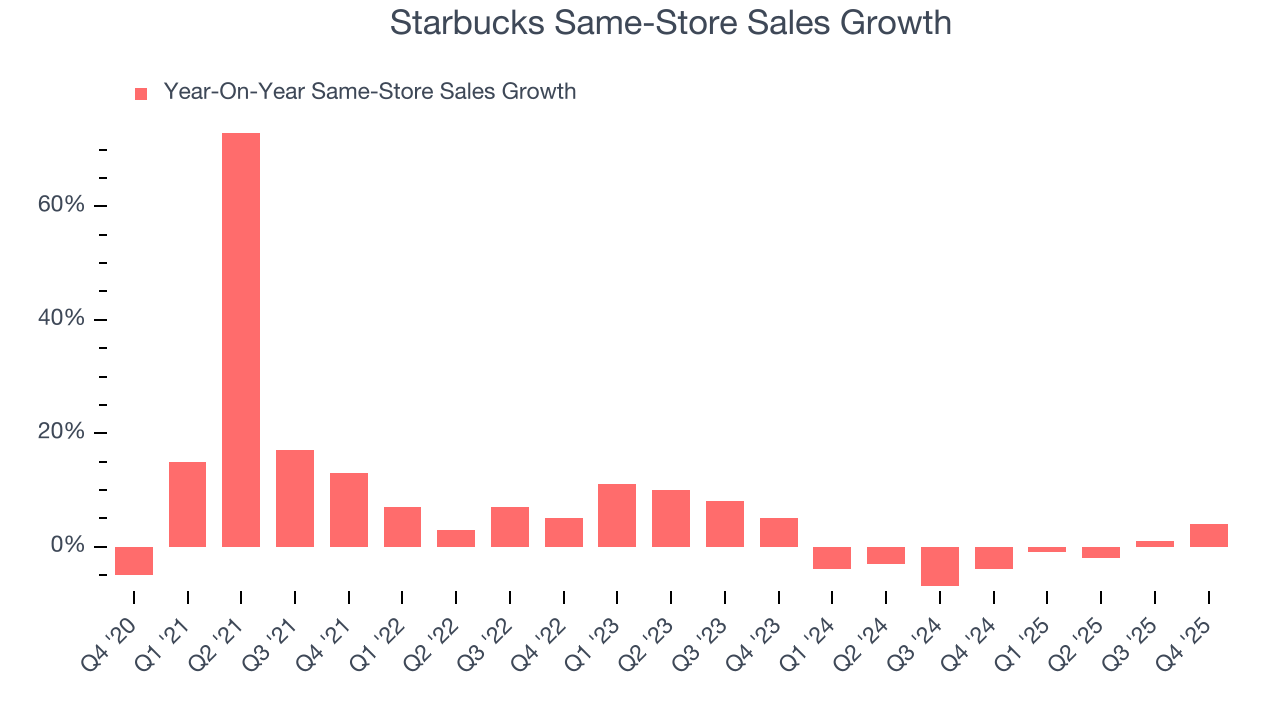
In the latest quarter, Starbucks’s same-store sales rose 4% year on year. This growth was a well-appreciated turnaround from its historical levels, showing the business is regaining momentum.
7. Gross Margin & Pricing Power
Starbucks’s gross margin is slightly below the average restaurant company, giving it less room to invest in areas such as marketing and talent to grow its brand. As you can see below, it averaged a 24.1% gross margin over the last two years. Said differently, Starbucks had to pay a chunky $75.90 to its suppliers for every $100 in revenue. 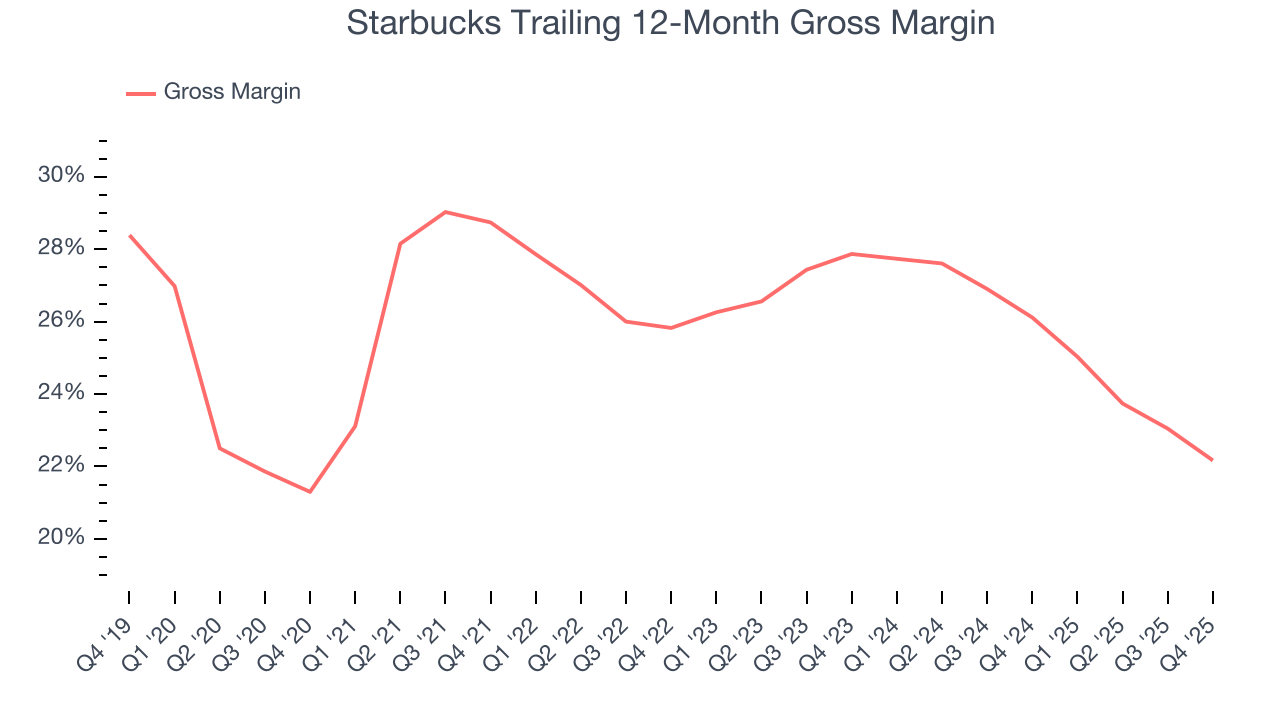
This quarter, Starbucks’s gross profit margin was 21.1%, marking a 3.4 percentage point decrease from 24.5% in the same quarter last year. Starbucks’s full-year margin has also been trending down over the past 12 months, decreasing by 3.9 percentage points. If this move continues, it could suggest a more competitive environment with some pressure to lower prices and higher input costs (such as ingredients and transportation expenses).
8. Operating Margin
Starbucks has done a decent job managing its cost base over the last two years. The company has produced an average operating margin of 10.5%, higher than the broader restaurant sector.
Analyzing the trend in its profitability, Starbucks’s operating margin decreased by 6.8 percentage points over the last year. This raises questions about the company’s expense base because its revenue growth should have given it leverage on its fixed costs, resulting in better economies of scale and profitability.
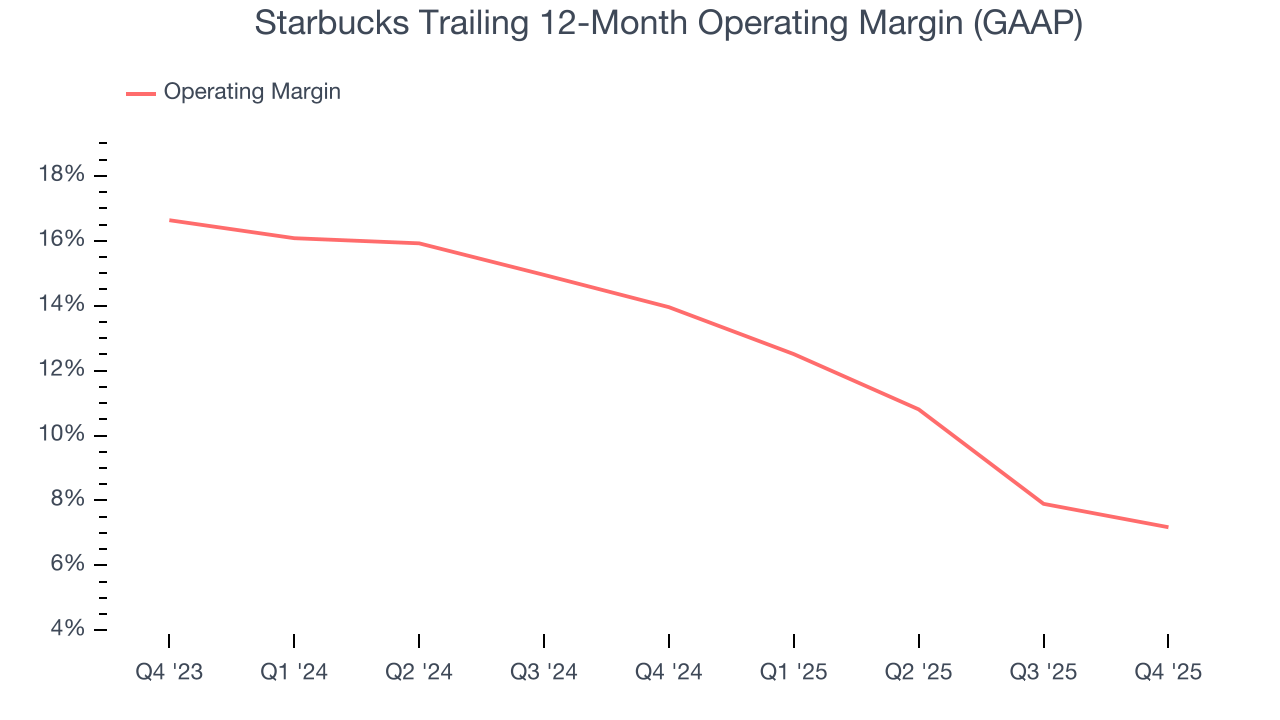
In Q4, Starbucks generated an operating margin profit margin of 9%, down 3 percentage points year on year. Since Starbucks’s gross margin decreased more than its operating margin, we can assume its recent inefficiencies were driven more by weaker leverage on its cost of sales rather than increased marketing, and administrative overhead expenses.
9. Earnings Per Share
We track the long-term change in earnings per share (EPS) for the same reason as long-term revenue growth. Compared to revenue, however, EPS highlights whether a company’s growth is profitable.
Sadly for Starbucks, its EPS declined by 5.9% annually over the last six years while its revenue grew by 5.7%. This tells us the company became less profitable on a per-share basis as it expanded due to non-fundamental factors such as interest expenses and taxes.
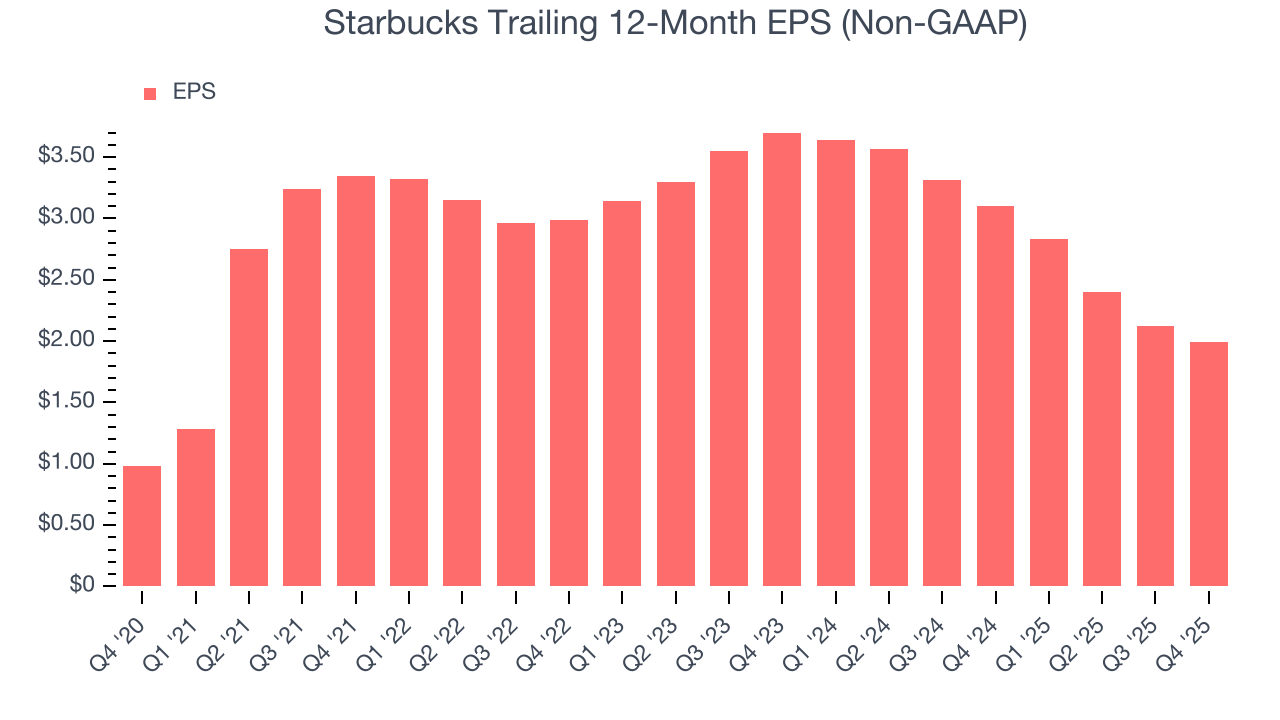
In Q4, Starbucks reported adjusted EPS of $0.56, down from $0.69 in the same quarter last year. This print missed analysts’ estimates. Over the next 12 months, Wall Street expects Starbucks’s full-year EPS of $1.99 to grow 26.7%.
10. Cash Is King
Although earnings are undoubtedly valuable for assessing company performance, we believe cash is king because you can’t use accounting profits to pay the bills.
Starbucks has shown impressive cash profitability, giving it the option to reinvest or return capital to investors. The company’s free cash flow margin averaged 7.1% over the last two years, better than the broader restaurant sector.
Taking a step back, we can see that Starbucks’s margin dropped by 1.8 percentage points over the last year. This decrease came from the higher costs associated with opening more restaurants.
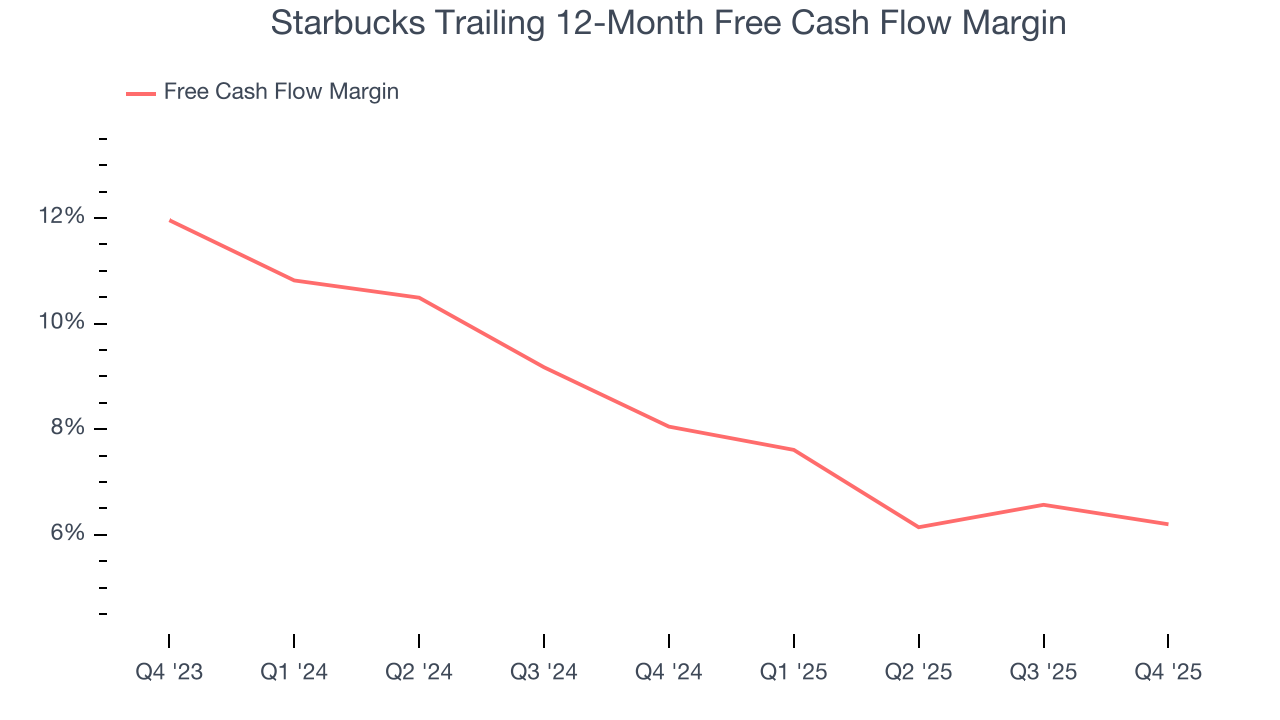
Starbucks’s free cash flow clocked in at $1.27 billion in Q4, equivalent to a 12.8% margin. The company’s cash profitability regressed as it was 1.8 percentage points lower than in the same quarter last year, but it’s still above its two-year average. We wouldn’t put too much weight on this quarter’s decline because investment needs can be seasonal, causing short-term swings. Long-term trends are more important.
11. Balance Sheet Assessment
Starbucks reported $3.60 billion of cash and $17.42 billion of debt on its balance sheet in the most recent quarter. As investors in high-quality companies, we primarily focus on two things: 1) that a company’s debt level isn’t too high and 2) that its interest payments are not excessively burdening the business.
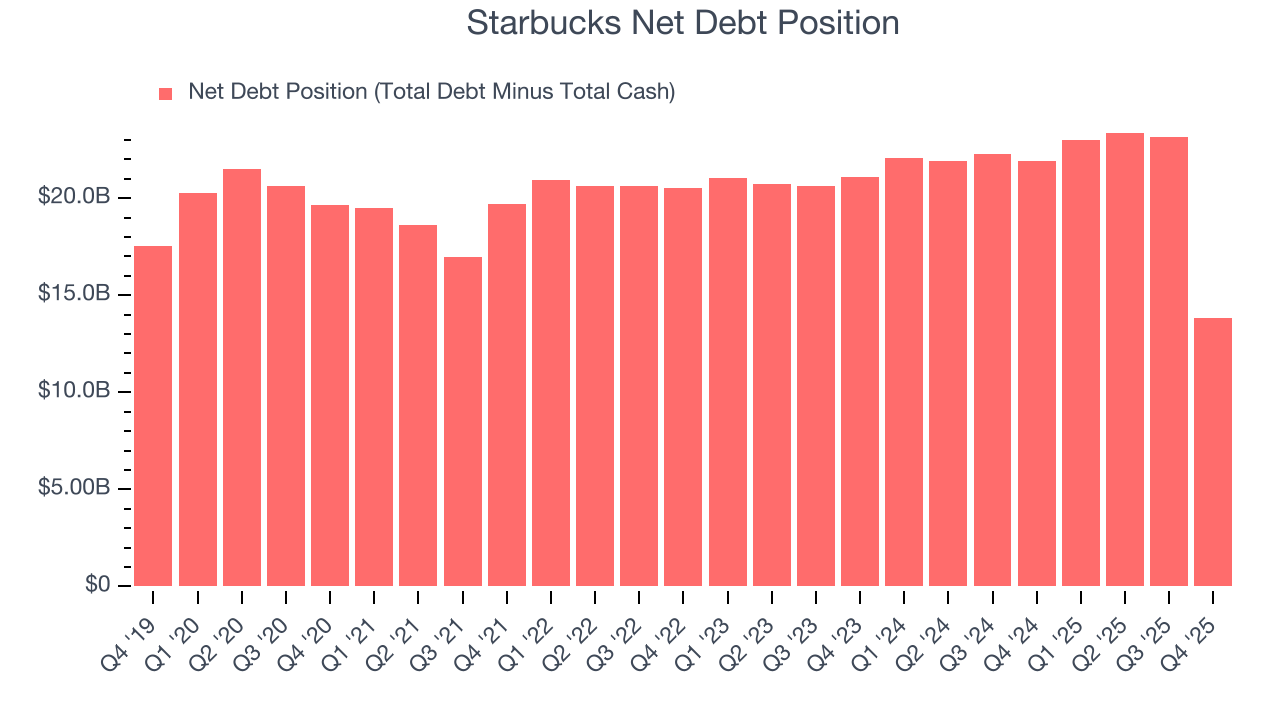
With $5.30 billion of EBITDA over the last 12 months, we view Starbucks’s 2.6× net-debt-to-EBITDA ratio as safe. We also see its $197.5 million of annual interest expenses as appropriate. The company’s profits give it plenty of breathing room, allowing it to continue investing in growth initiatives.
12. Key Takeaways from Starbucks’s Q4 Results
We were impressed by how significantly Starbucks blew past analysts’ same-store sales expectations this quarter, showing a revival in demand. We were also glad its revenue outperformed Wall Street’s estimates. On the other hand, its EPS missed. Zooming out, we think this quarter featured some important positives to show that a turnaround is afoot. The stock traded up 9.6% to $104.88 immediately following the results.
13. Is Now The Time To Buy Starbucks?
Updated: March 19, 2026 at 10:42 PM EDT
We think that the latest earnings result is only one piece of the bigger puzzle. If you’re deciding whether to own Starbucks, you should also grasp the company’s longer-term business quality and valuation.
We cheer for all companies serving everyday consumers, but in the case of Starbucks, we’ll be cheering from the sidelines. To begin with, its revenue growth was a little slower over the last six years, and analysts expect its demand to deteriorate over the next 12 months. While its new restaurant openings have increased its brand equity, the downside is its shrinking same-store sales tell us it will need to change its strategy to succeed. On top of that, its declining EPS over the last six years makes it a less attractive asset to the public markets.
Starbucks’s P/E ratio based on the next 12 months is 37.1x. This multiple tells us a lot of good news is priced in - we think other companies feature superior fundamentals at the moment.
Wall Street analysts have a consensus one-year price target of $99.94 on the company (compared to the current share price of $95.80).