
Simmons First National (SFNC)
Simmons First National faces an uphill battle. Its weak sales growth and low returns on capital show it struggled to generate demand and profits.― StockStory Analyst Team
1. News


2. Summary
Why We Think Simmons First National Will Underperform
With roots dating back to 1903 and a presence across Arkansas, Kansas, Missouri, Oklahoma, Tennessee, and Texas, Simmons First National (NASDAQ:SFNC) is a regional bank holding company that provides banking and financial services to individuals and businesses.
- Incremental sales over the last five years were much less profitable as its earnings per share fell by 6.7% annually while its revenue grew
- Products and services are facing significant credit quality challenges during this cycle as tangible book value per share has declined by 3.4% annually over the last five years
- Estimated net interest income decline of 6.8% for the next 12 months implies a challenging demand environment


Simmons First National’s quality isn’t great. We’d rather invest in businesses with stronger moats.
Why There Are Better Opportunities Than Simmons First National


At $19.09 per share, Simmons First National trades at 0.8x forward P/B. This is a cheap valuation multiple, but for good reason. You get what you pay for.
Our advice is to pay up for elite businesses whose advantages are tailwinds to earnings growth. Don’t get sucked into lower-quality businesses just because they seem like bargains. These mediocre businesses often never achieve a higher multiple as hoped, a phenomenon known as a “value trap”.
3. Simmons First National (SFNC) Research Report: Q4 CY2025 Update
Regional banking company Simmons First National (NASDAQ:SFNC) announced better-than-expected revenue in Q4 CY2025, with sales up 15.9% year on year to $249 million. Its non-GAAP profit of $0.54 per share was 12.9% above analysts’ consensus estimates.
Simmons First National (SFNC) Q4 CY2025 Highlights:
- Net Interest Income: $197.3 million vs analyst estimates of $192.8 million (19.6% year-on-year growth, 2.3% beat)
- Net Interest Margin: 3.8% vs analyst estimates of 3.7% (13.2 basis point beat)
- Revenue: $249 million vs analyst estimates of $239.2 million (15.9% year-on-year growth, 4.1% beat)
- Efficiency Ratio: 55.5% vs analyst estimates of 57.8% (227.6 basis point beat)
- Adjusted EPS: $0.54 vs analyst estimates of $0.48 (12.9% beat)
- Tangible Book Value per Share: $13.91 vs analyst estimates of $13.77 (17.2% year-on-year decline, 1% beat)
- Market Capitalization: $2.78 billion
Company Overview
With roots dating back to 1903 and a presence across Arkansas, Kansas, Missouri, Oklahoma, Tennessee, and Texas, Simmons First National (NASDAQ:SFNC) is a regional bank holding company that provides banking and financial services to individuals and businesses.
Simmons Bank, the company's primary subsidiary, operates through a network of financial centers offering a comprehensive range of banking products. The bank serves its market through two main operational groups: a community banking group focused on small-to-mid-size relationships and a commercial banking group handling larger, more complex clients with specialized banking needs.
For business customers, Simmons provides commercial banking services including various types of loans for real estate, construction, equipment financing, and general corporate purposes. The bank also offers Small Business Administration (SBA) lending, agricultural financing, corporate credit cards, treasury management services, and deposit products tailored to business needs.
Individual consumers can access a variety of personal banking services such as checking, savings, and time deposit accounts; real estate and home equity loans; consumer loans; credit cards; and digital banking platforms including internet and mobile banking. A typical customer might use Simmons for their mortgage when purchasing a home, maintain checking and savings accounts for daily transactions, and utilize the bank's mobile app to transfer funds or deposit checks remotely.
Beyond traditional banking, Simmons offers trust and investment services through its trust department, which administers estates and personal trusts while managing investment accounts. The company also maintains insurance agencies—Simmons First Insurance Services, Inc. and Simmons First Insurance Services of TN, LLC—providing various personal and commercial insurance products to complement its banking relationships.
4. Regional Banks
Regional banks, financial institutions operating within specific geographic areas, serve as intermediaries between local depositors and borrowers. They benefit from rising interest rates that improve net interest margins (the difference between loan yields and deposit costs), digital transformation reducing operational expenses, and local economic growth driving loan demand. However, these banks face headwinds from fintech competition, deposit outflows to higher-yielding alternatives, credit deterioration (increasing loan defaults) during economic slowdowns, and regulatory compliance costs. Recent concerns about regional bank stability following high-profile failures and significant commercial real estate exposure present additional challenges.
Simmons First National competes with other regional banks operating in the southern and midwestern United States, including Regions Financial (NYSE:RF), Prosperity Bancshares (NYSE:PB), Bank OZK (NASDAQ:OZK), and Trustmark Corporation (NASDAQ:TRMK).
5. Sales Growth
Net interest income and and fee-based revenue are the two pillars supporting bank earnings. The former captures profit from the gap between lending rates and deposit costs, while the latter encompasses charges for banking services, credit products, wealth management, and trading activities. Unfortunately, Simmons First National’s 1.9% annualized revenue growth over the last five years was weak. This fell short of our benchmarks and is a tough starting point for our analysis.
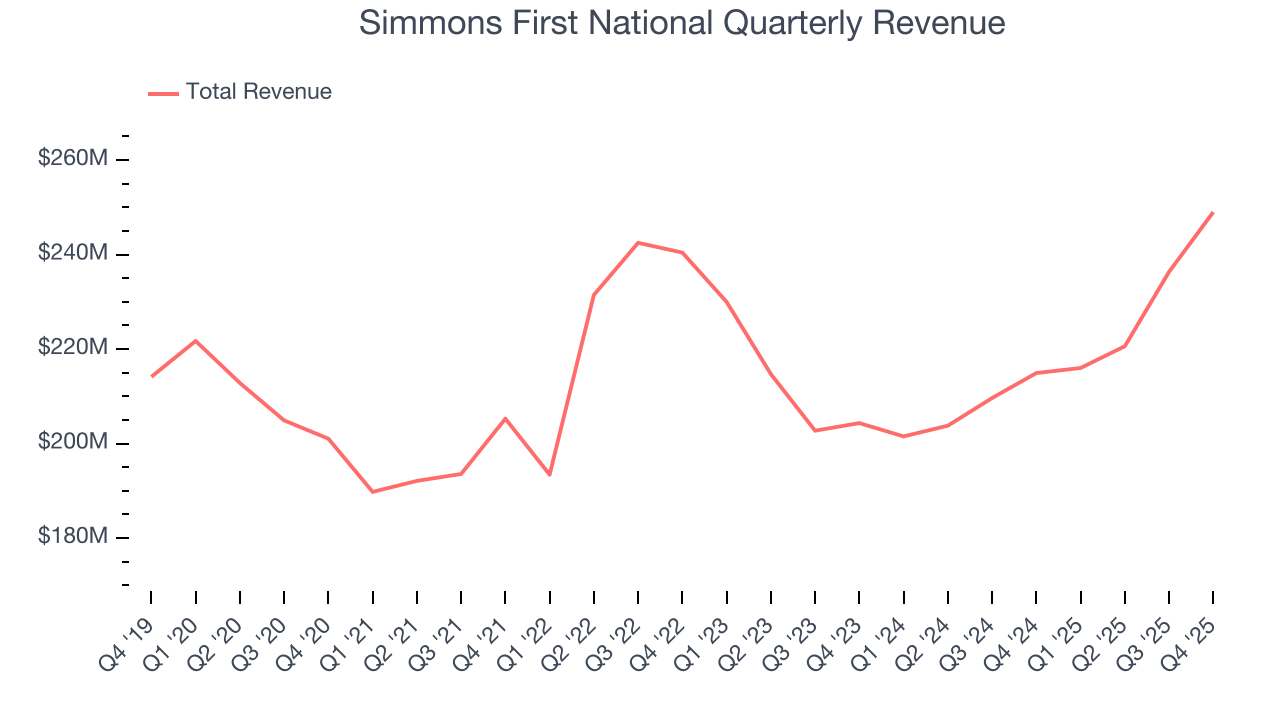
We at StockStory place the most emphasis on long-term growth, but within financials, a half-decade historical view may miss recent interest rate changes, market returns, and industry trends. Simmons First National’s annualized revenue growth of 4% over the last two years is above its five-year trend, but we were still disappointed by the results. 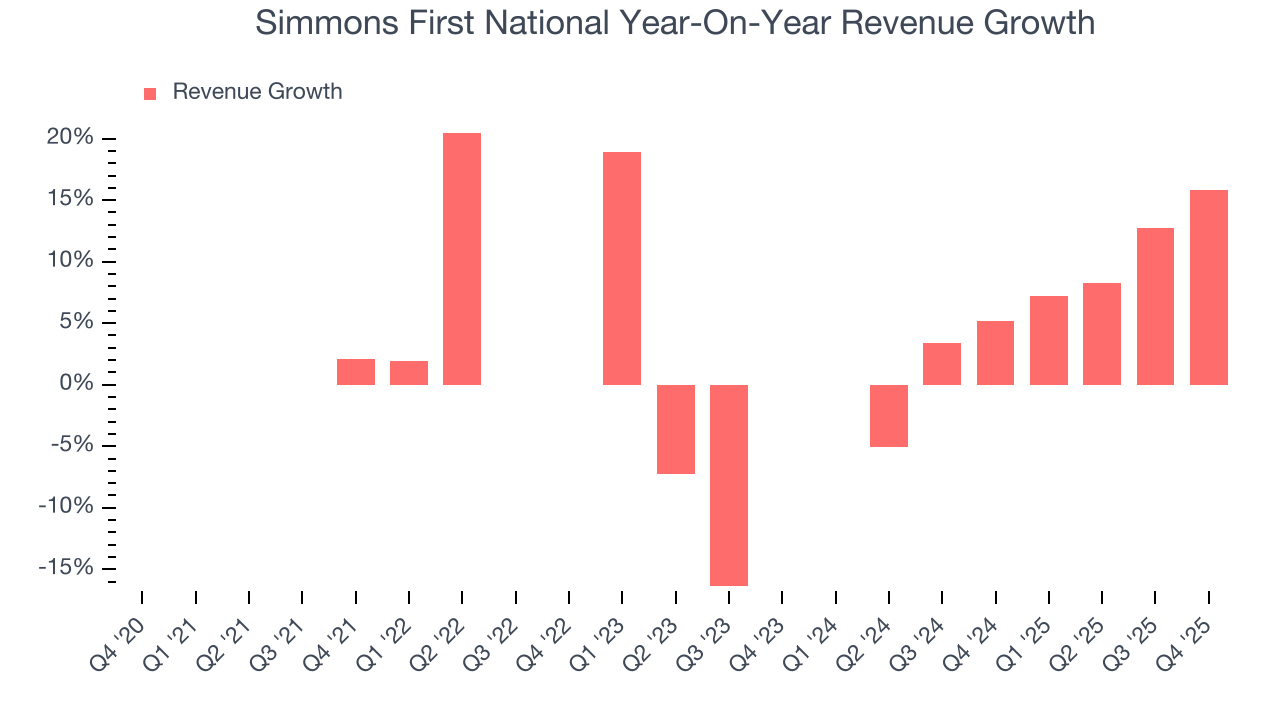 Note: Quarters not shown were determined to be outliers, impacted by outsized investment gains/losses that are not indicative of the recurring fundamentals of the business.
This quarter, Simmons First National reported year-on-year revenue growth of 15.9%, and its $249 million of revenue exceeded Wall Street’s estimates by 4.1%.
Net interest income made up 76.9% of the company’s total revenue during the last five years, meaning lending operations are Simmons First National’s largest source of revenue.
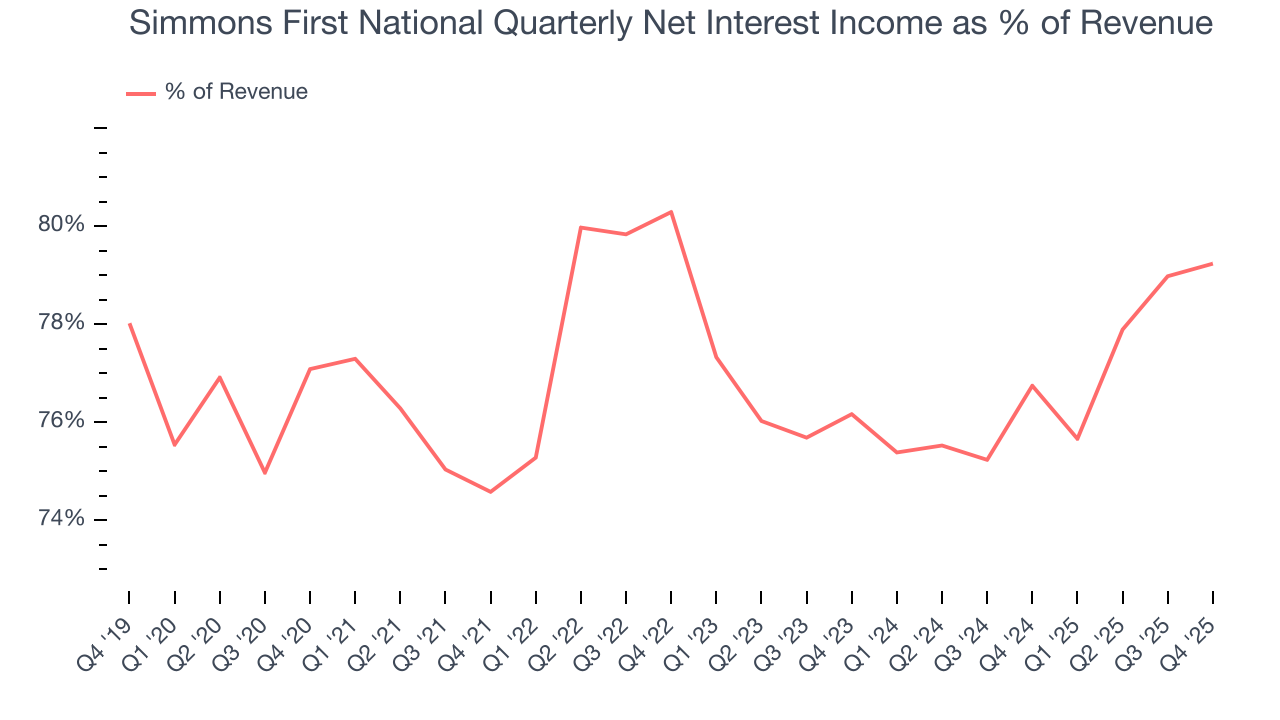
Markets consistently prioritize net interest income growth over fee-based revenue, recognizing its superior quality and recurring nature compared to the more unpredictable non-interest income streams.
6. Earnings Per Share
We track the long-term change in earnings per share (EPS) for the same reason as long-term revenue growth. Compared to revenue, however, EPS highlights whether a company’s growth is profitable.
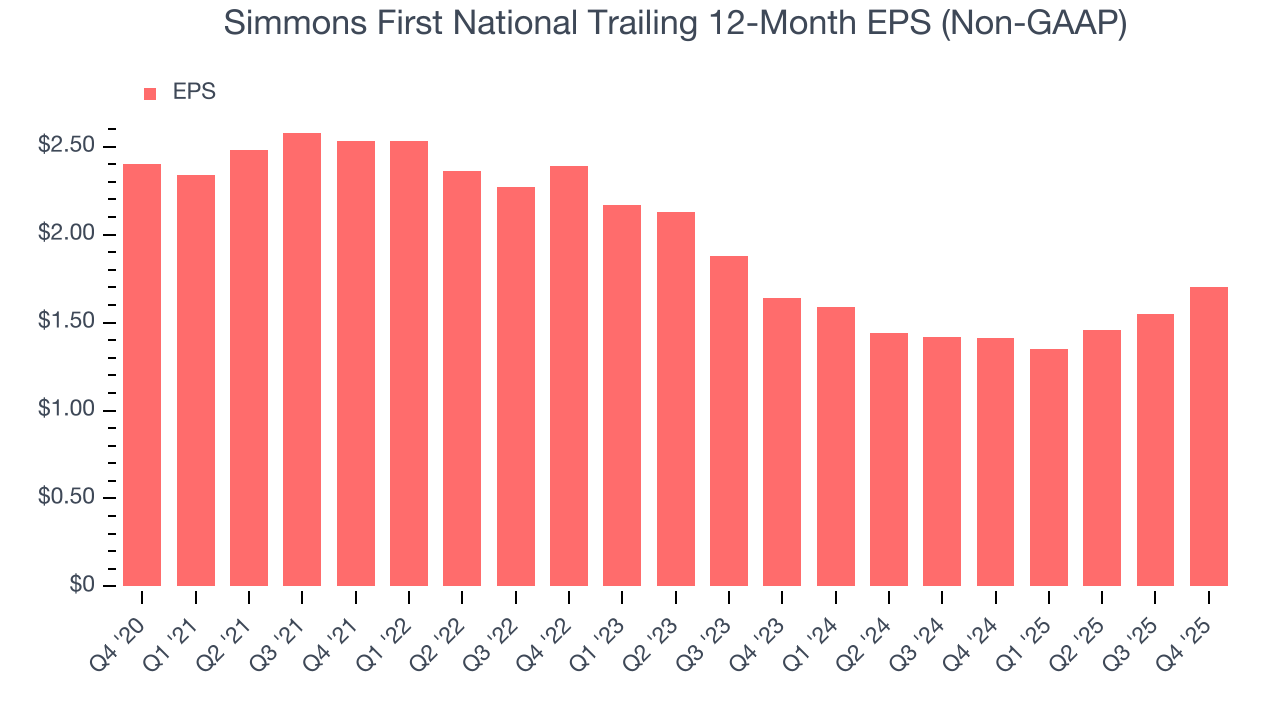
Sadly for Simmons First National, its EPS declined by 6.7% annually over the last five years while its revenue grew by 1.9%. However, its efficiency ratio didn’t change during this time, telling us that non-fundamental factors such as interest and taxes affected its ultimate earnings.
Like with revenue, we analyze EPS over a more recent period because it can provide insight into an emerging theme or development for the business.
For Simmons First National, its two-year annual EPS growth of 1.8% was higher than its five-year trend. Accelerating earnings growth is almost always an encouraging data point.
In Q4, Simmons First National reported adjusted EPS of $0.54, up from $0.39 in the same quarter last year. This print easily cleared analysts’ estimates, and shareholders should be content with the results. Over the next 12 months, Wall Street expects Simmons First National’s full-year EPS of $1.70 to grow 13.5%.
7. Tangible Book Value Per Share (TBVPS)
Banks operate as balance sheet businesses, with profits generated through borrowing and lending activities. Valuations reflect this reality, emphasizing balance sheet strength and long-term book value compounding ability.
This explains why tangible book value per share (TBVPS) stands as the premier banking metric. TBVPS strips away questionable intangible assets, revealing concrete per-share net worth that investors can trust. EPS can become murky due to acquisition impacts or accounting flexibility around loan provisions, and TBVPS resists financial engineering manipulation.
Simmons First National’s TBVPS declined at a 3.4% annual clip over the last five years. A turnaround doesn’t seem to be in sight as its TBVPS also dropped by 6.5% annually over the last two years ($15.92 to $13.91 per share).
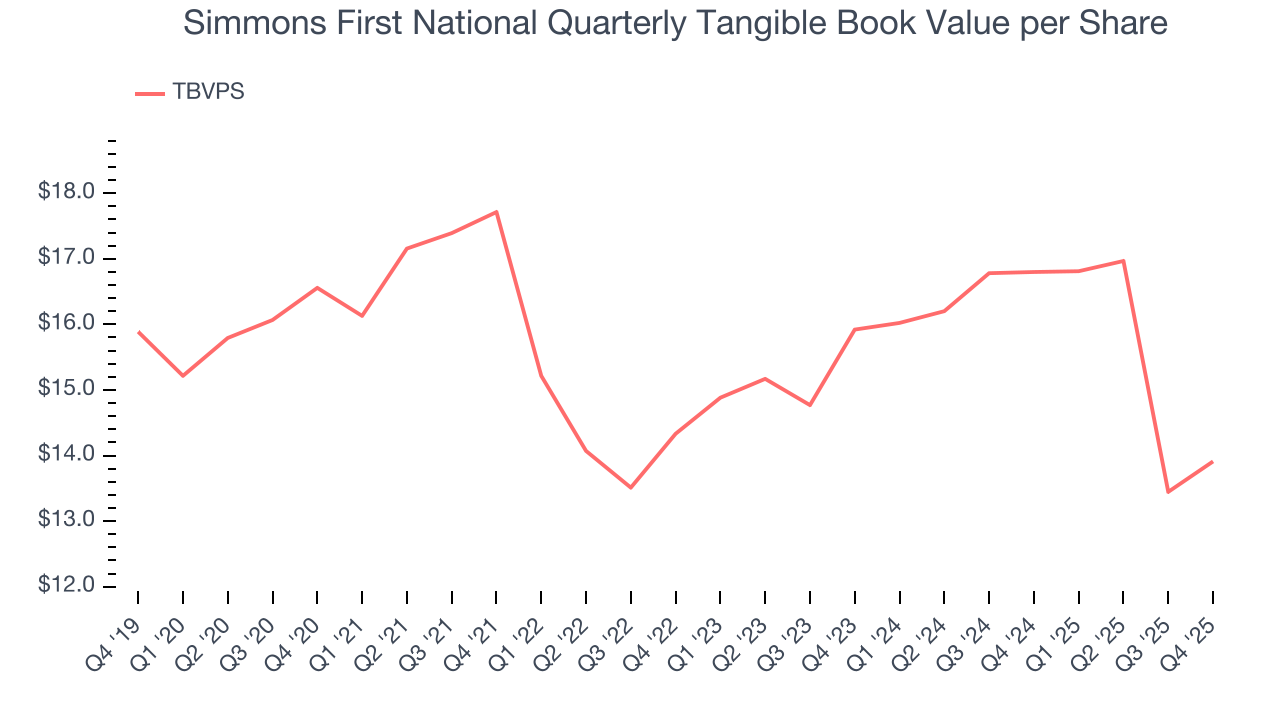
Over the next 12 months, Consensus estimates call for Simmons First National’s TBVPS to grow by 8.4% to $15.07, paltry growth rate.
8. Balance Sheet Assessment
Leverage is core to a financial firm’s business model (loans funded by deposits). To ensure economic stability and avoid a repeat of the 2008 GFC, regulators require certain levels of capital and liquidity, focusing on the Tier 1 capital ratio.
Tier 1 capital is the highest-quality capital that a firm holds, consisting primarily of common stock and retained earnings, but also physical gold. It serves as the primary cushion against losses and is the first line of defense in times of financial distress.
This capital is divided by risk-weighted assets to derive the Tier 1 capital ratio. Risk-weighted means that cash and US treasury securities are assigned little risk while unsecured consumer loans and equity investments get much higher risk weights, for example.
New regulation after the 2008 financial crisis requires that all firms must maintain a Tier 1 capital ratio greater than 4.5%. On top of this, there are additional buffers based on scale, risk profile, and other regulatory classifications, so that at the end of the day, firms generally must maintain a 7-10% ratio at minimum.
Over the last two years, Simmons First National has averaged a Tier 1 capital ratio of 12%, which is considered safe and well capitalized in the event that macro or market conditions suddenly deteriorate.
9. Return on Equity
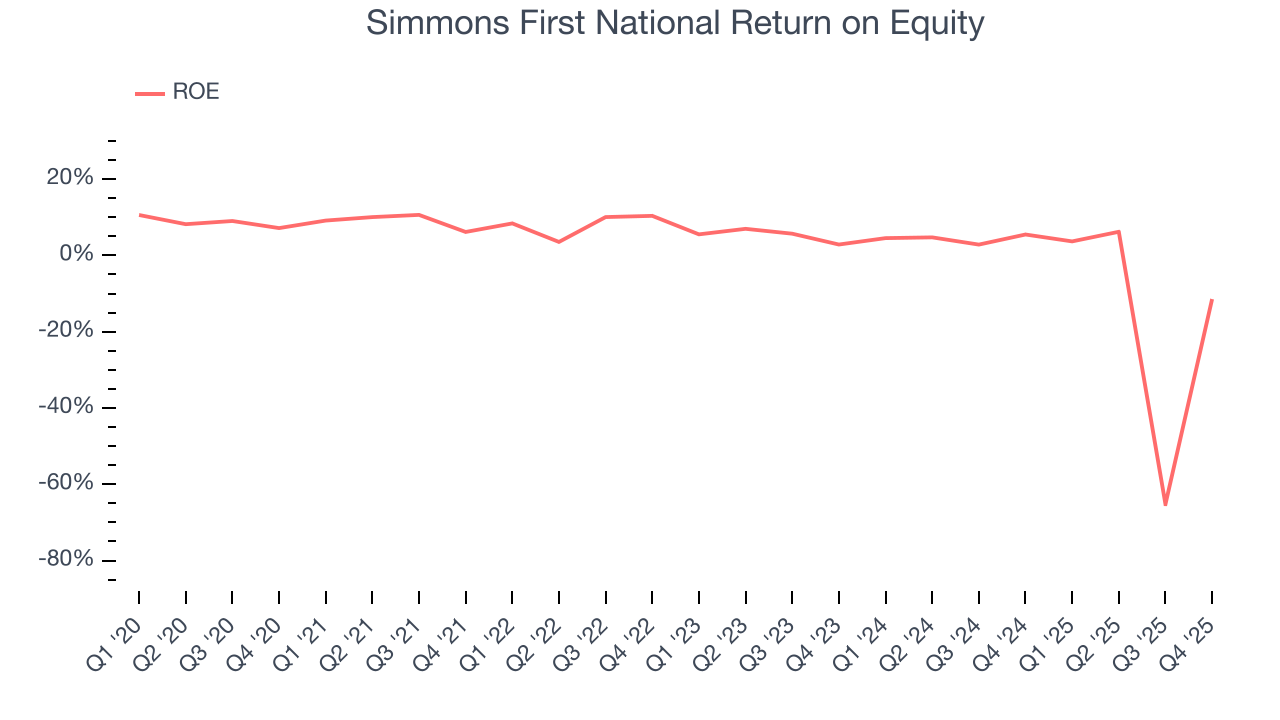
Return on equity, or ROE, quantifies bank profitability relative to shareholder equity - an essential capital source for these institutions. Over extended periods, superior ROE performance drives faster shareholder wealth compounding through reinvestment, share repurchases, and dividend growth.
Over the last five years, Simmons First National has averaged an ROE of 2%, uninspiring for a company operating in a sector where the average shakes out around 7.5%.
10. Key Takeaways from Simmons First National’s Q4 Results
We enjoyed seeing Simmons First National beat analysts’ revenue expectations this quarter. We were also glad its EPS outperformed Wall Street’s estimates. Zooming out, we think this quarter featured some important positives. The stock remained flat at $19.29 immediately following the results.
11. Is Now The Time To Buy Simmons First National?
Updated: March 22, 2026 at 12:59 AM EDT
When considering an investment in Simmons First National, investors should account for its valuation and business qualities as well as what’s happened in the latest quarter.
Simmons First National doesn’t pass our quality test. To begin with, its revenue growth was weak over the last five years. While its projected EPS for the next year implies the company’s fundamentals will improve, the downside is its TBVPS has declined over the last five years. On top of that, its declining EPS over the last five years makes it a less attractive asset to the public markets.
Simmons First National’s P/B ratio based on the next 12 months is 0.8x. While this valuation is optically cheap, the potential downside is huge given its shaky fundamentals. There are better investments elsewhere.
Wall Street analysts have a consensus one-year price target of $23 on the company (compared to the current share price of $19.09).
Although the price target is bullish, readers should exercise caution because analysts tend to be overly optimistic. The firms they work for, often big banks, have relationships with companies that extend into fundraising, M&A advisory, and other rewarding business lines. As a result, they typically hesitate to say bad things for fear they will lose out. We at StockStory do not suffer from such conflicts of interest, so we’ll always tell it like it is.