
Stock Yards Bank (SYBT)
Stock Yards Bank is intriguing. It’s one of the fastest-growing companies we cover, and there’s a solid chance its momentum will continue.― StockStory Analyst Team
1. News


2. Summary
Why Stock Yards Bank Is Interesting
Founded in 1904 in Louisville and named after the city's historic livestock market district, Stock Yards Bancorp (NASDAQ:SYBT) operates a regional bank providing commercial banking, wealth management, and trust services across Kentucky, Indiana, and Ohio.
- Impressive 18.5% annual tangible book value per share growth over the last two years indicates it’s building equity value this cycle
- Impressive 17.1% annual net interest income growth over the last five years indicates it’s winning market share this cycle
- A drawback is its net interest margin of 3.4% reflects its high servicing and capital costs


Stock Yards Bank shows some promise. This is a good stock to keep your eye on.
Why Should You Watch Stock Yards Bank


Stock Yards Bank is trading at $63.35 per share, or 1.7x forward P/B. This multiple is higher than most banking companies.
If Stock Yards Bank strings together a few solid quarters and proves it can be a high-quality company, we’d be more open to investing.
3. Stock Yards Bank (SYBT) Research Report: Q3 CY2025 Update
Regional banking company Stock Yards Bancorp (NASDAQ:SYBT) reported Q3 CY2025 results topping the market’s revenue expectations, with sales up 13.1% year on year to $101.5 million. Its GAAP profit of $1.23 per share was 6% above analysts’ consensus estimates.
Stock Yards Bank (SYBT) Q3 CY2025 Highlights:
- Net Interest Income: $77.04 million vs analyst estimates of $75.58 million (18.6% year-on-year growth, 1.9% beat)
- Net Interest Margin: 3.6% vs analyst estimates of 3.5% (3.3 basis point beat)
- Revenue: $101.5 million vs analyst estimates of $99.82 million (13.1% year-on-year growth, 1.7% beat)
- Efficiency Ratio: 53% vs analyst estimates of 53% (in line)
- EPS (GAAP): $1.23 vs analyst estimates of $1.16 (6% beat)
- Tangible Book Value per Share: $28.30 vs analyst estimates of $28.03 (15.2% year-on-year growth, 1% beat)
- Market Capitalization: $1.98 billion
Company Overview
Founded in 1904 in Louisville and named after the city's historic livestock market district, Stock Yards Bancorp (NASDAQ:SYBT) operates a regional bank providing commercial banking, wealth management, and trust services across Kentucky, Indiana, and Ohio.
Stock Yards Bank serves businesses and individuals through two primary segments: Commercial Banking and Wealth Management & Trust (WM&T). The Commercial Banking segment offers a comprehensive suite of services including commercial and residential real estate loans, business term loans and lines of credit, construction financing, and consumer banking products. The bank's lending portfolio is diversified across various sectors, with particular strength in commercial real estate for both owner-occupied and investment properties.
A business owner might use Stock Yards Bank to secure financing for purchasing their office building, establish operating lines of credit, manage cash flow through treasury services, and handle employee payroll processing—all while receiving personalized attention from relationship managers who understand local market conditions.
The WM&T segment provides investment management, financial planning, trust administration, and retirement plan services for individuals, businesses, and corporations. This division generates fee-based income that complements the bank's traditional interest-based revenue streams.
Stock Yards Bank operates through a network of full-service banking centers strategically positioned throughout its tri-state footprint of Kentucky, Indiana, and Ohio. The bank emphasizes relationship banking and local decision-making, allowing it to compete with larger financial institutions while maintaining the personalized service of a community bank.
The bank generates revenue primarily through interest income on loans, fees from deposit services and wealth management, and merchant services. As a regulated financial institution, Stock Yards operates under the supervision of the Federal Reserve, FDIC, and Kentucky Department of Financial Institutions.
4. Regional Banks
Regional banks, financial institutions operating within specific geographic areas, serve as intermediaries between local depositors and borrowers. They benefit from rising interest rates that improve net interest margins (the difference between loan yields and deposit costs), digital transformation reducing operational expenses, and local economic growth driving loan demand. However, these banks face headwinds from fintech competition, deposit outflows to higher-yielding alternatives, credit deterioration (increasing loan defaults) during economic slowdowns, and regulatory compliance costs. Recent concerns about regional bank stability following high-profile failures and significant commercial real estate exposure present additional challenges.
Stock Yards Bancorp competes with other regional banks operating in the Kentucky, Indiana, and Ohio markets, including Fifth Third Bancorp (NASDAQ:FITB), Huntington Bancshares (NASDAQ:HBAN), PNC Financial Services (NYSE:PNC), and Republic Bancorp (NASDAQ:RBCAA).
5. Sales Growth
From lending activities to service fees, most banks build their revenue model around two income sources. Interest rate spreads between loans and deposits create the first stream, with the second coming from charges on everything from basic bank accounts to complex investment banking transactions. Over the last five years, Stock Yards Bank grew its revenue at an incredible 16% compounded annual growth rate. Its growth beat the average banking company and shows its offerings resonate with customers, a helpful starting point for our analysis.
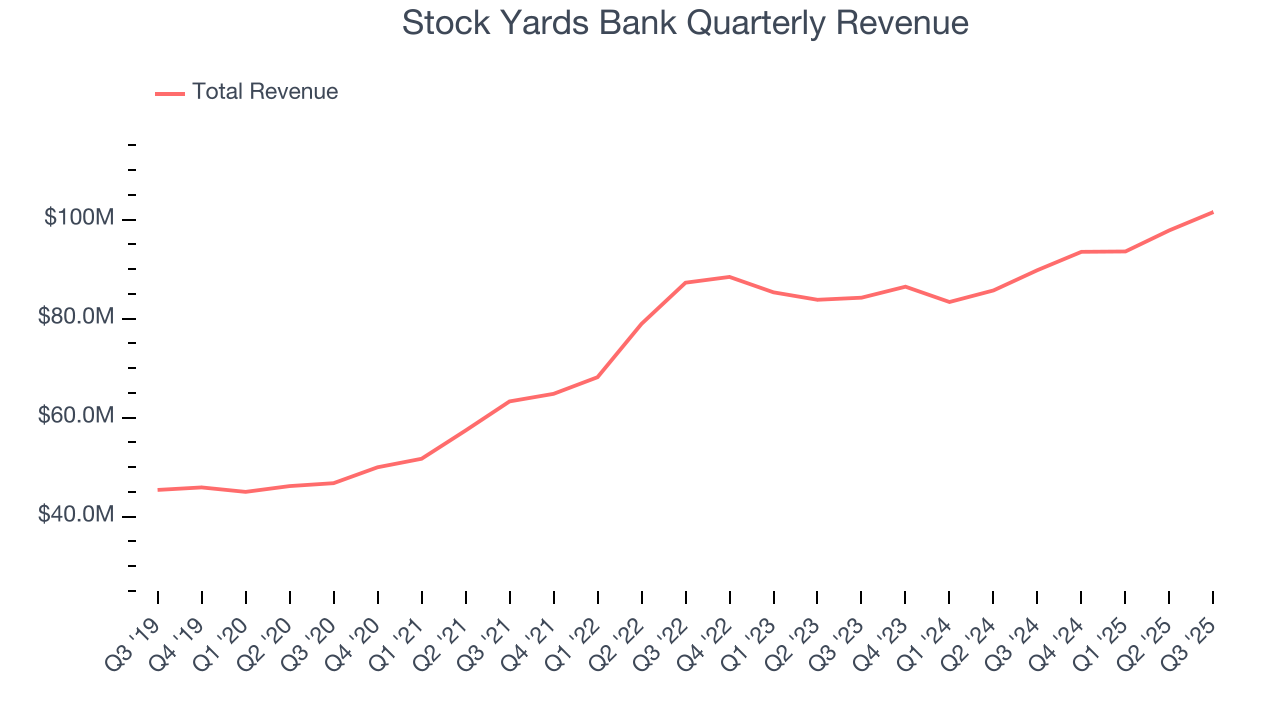
Long-term growth is the most important, but within financials, a half-decade historical view may miss recent interest rate changes and market returns. Stock Yards Bank’s annualized revenue growth of 6.3% over the last two years is below its five-year trend, but we still think the results were respectable. 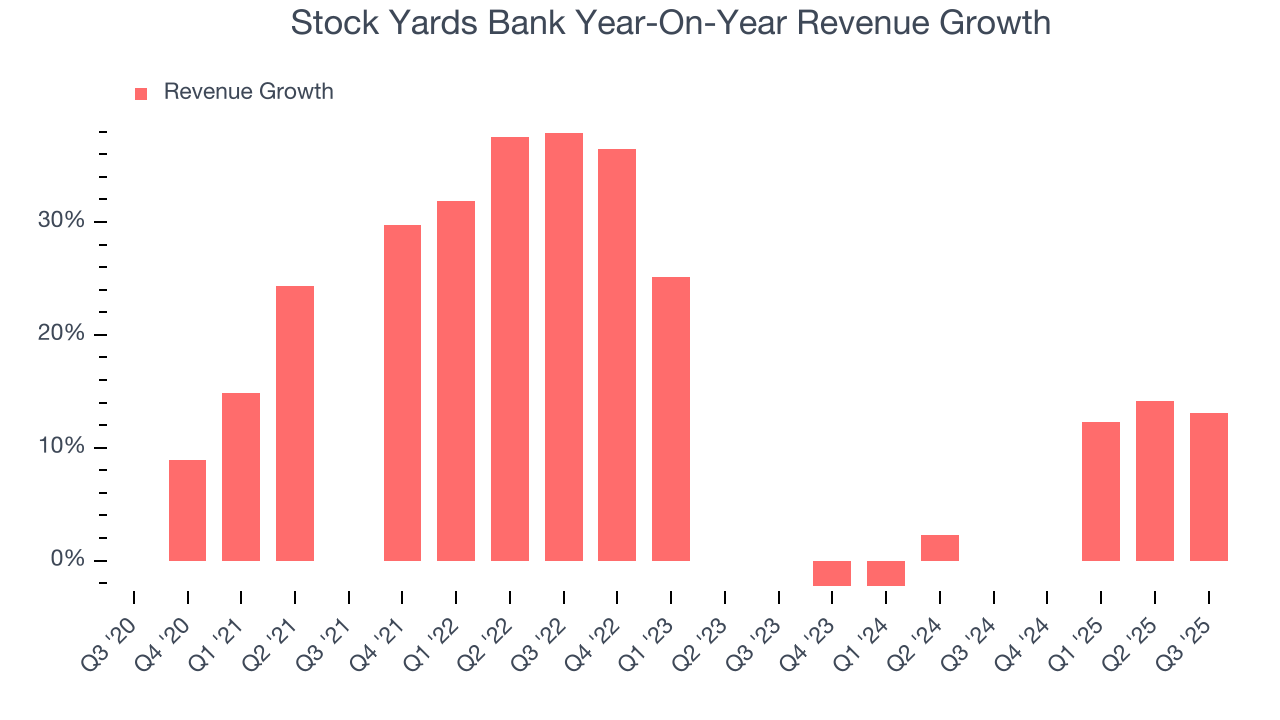 Note: Quarters not shown were determined to be outliers, impacted by outsized investment gains/losses that are not indicative of the recurring fundamentals of the business.
This quarter, Stock Yards Bank reported year-on-year revenue growth of 13.1%, and its $101.5 million of revenue exceeded Wall Street’s estimates by 1.7%.
Net interest income made up 73% of the company’s total revenue during the last five years, meaning lending operations are Stock Yards Bank’s largest source of revenue.
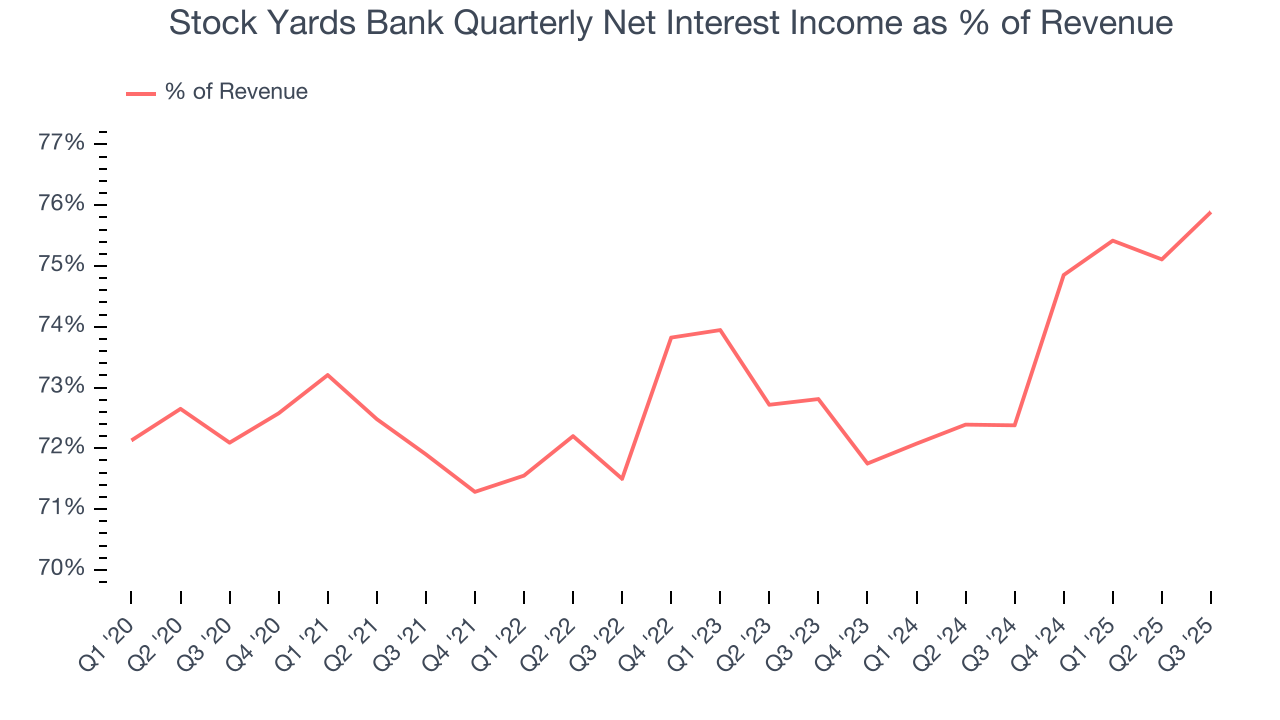
Markets consistently prioritize net interest income growth over fee-based revenue, recognizing its superior quality and recurring nature compared to the more unpredictable non-interest income streams.
6. Efficiency Ratio
Topline growth carries importance, but the overall profitability behind this expansion determines true value creation. For banks, the efficiency ratio captures this relationship by measuring non-interest expenses, including salaries, facilities, technology, and marketing, against total revenue.
Markets emphasize efficiency ratio trends over static measurements, recognizing that revenue compositions drive different expense bases. Lower efficiency ratios signal superior performance by indicating that banks are controlling costs effectively relative to their income.
Over the last five years, Stock Yards Bank’s efficiency ratio has increased by 1.3 percentage points, going from 51% to 53.8%. Said differently, the company’s expenses have increased at a faster rate than revenue, which usually raises questions unless the company is in high-growth mode and reinvesting its profits into attractive ventures.
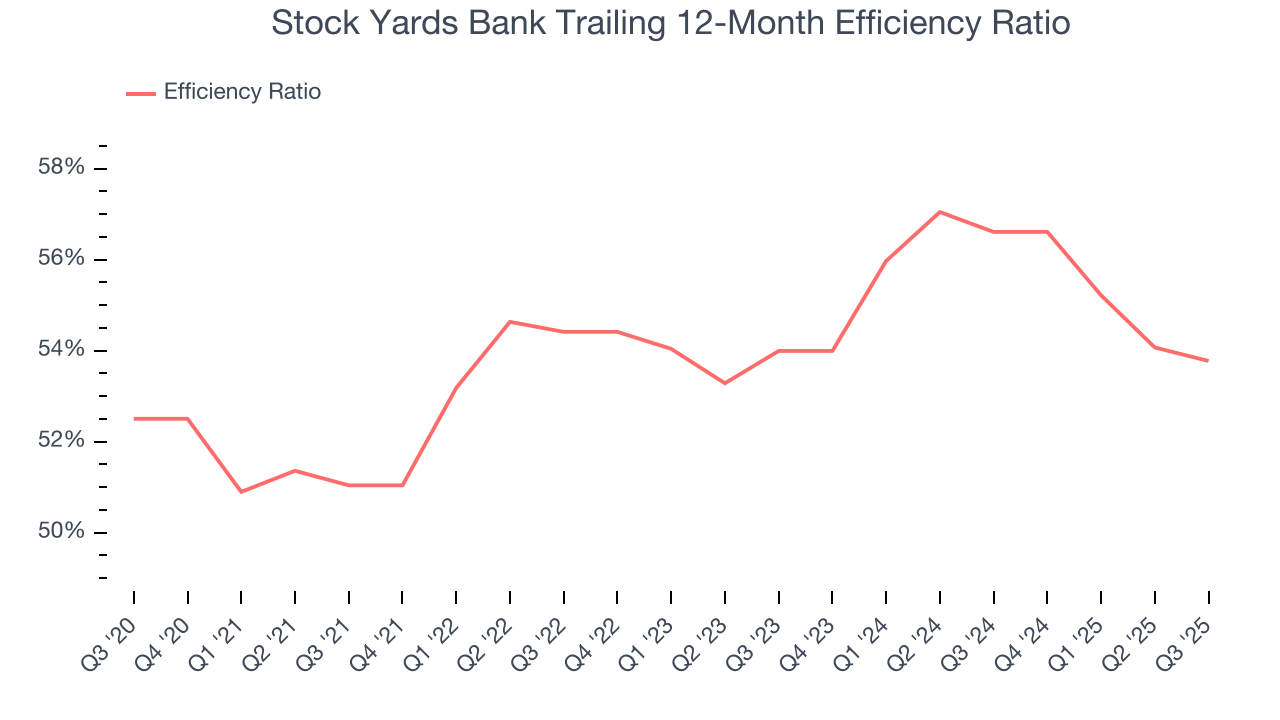
Stock Yards Bank’s efficiency ratio came in at 53% this quarter, close to analysts’ expectations. This result was in line with the same quarter last year.
For the next 12 months, Wall Street expects Stock Yards Bank to maintain its trailing one-year ratio with a projection of 53.5%.
7. Earnings Per Share
We track the long-term change in earnings per share (EPS) for the same reason as long-term revenue growth. Compared to revenue, however, EPS highlights whether a company’s growth is profitable.
Stock Yards Bank’s EPS grew at an astounding 12.5% compounded annual growth rate over the last five years. Despite its efficiency ratio improvement during that time, this performance was lower than its 16% annualized revenue growth, telling us that non-fundamental factors such as interest and taxes affected its ultimate earnings.
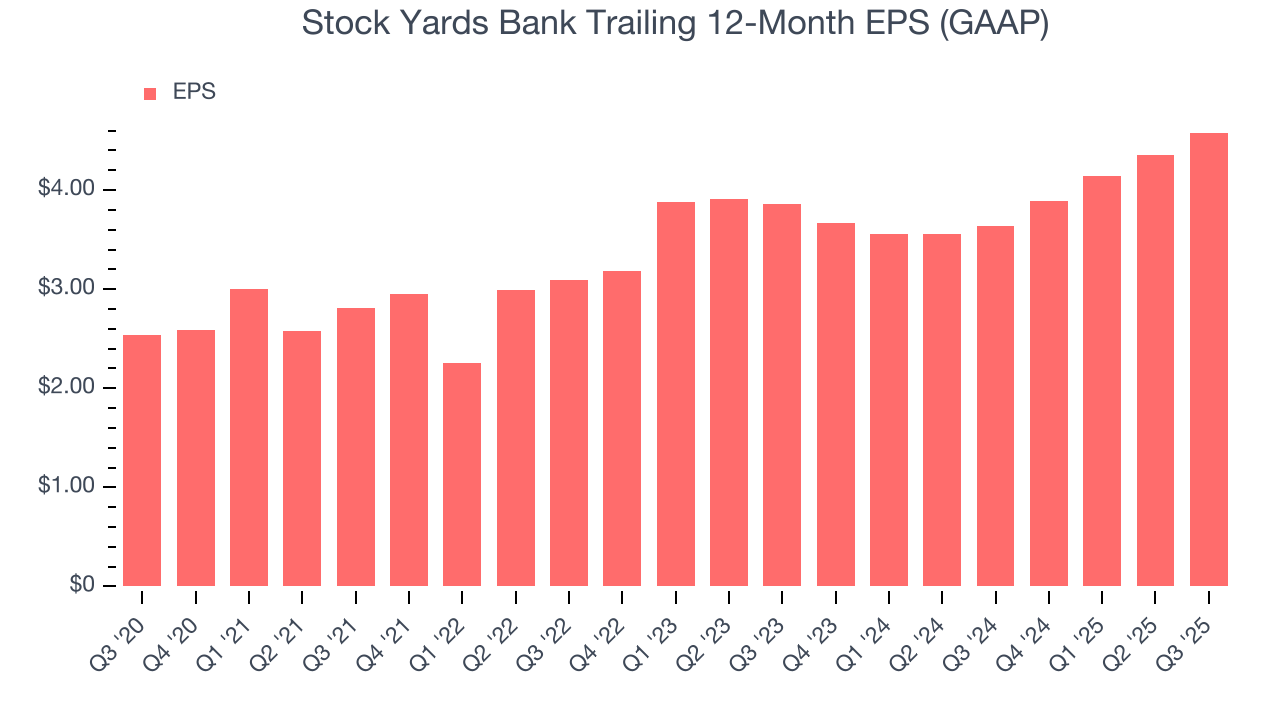
Like with revenue, we analyze EPS over a more recent period because it can provide insight into an emerging theme or development for the business.
For Stock Yards Bank, its two-year annual EPS growth of 8.9% was lower than its five-year trend. We still think its growth was good and hope it can accelerate in the future.
In Q3, Stock Yards Bank reported EPS of $1.23, up from $1 in the same quarter last year. This print beat analysts’ estimates by 6%. Over the next 12 months, Wall Street expects Stock Yards Bank’s full-year EPS of $4.58 to stay about the same.
8. Tangible Book Value Per Share (TBVPS)
Banks are balance sheet-driven businesses because they generate earnings primarily through borrowing and lending. They’re also valued based on their balance sheet strength and ability to compound book value (another name for shareholders’ equity) over time.
Because of this, tangible book value per share (TBVPS) emerges as the critical performance benchmark. By excluding intangible assets with uncertain liquidation values, this metric captures real, liquid net worth per share. Traditional metrics like EPS are helpful but face distortion from M&A activity and loan loss accounting rules.
Stock Yards Bank’s TBVPS grew at an exceptional 9.2% annual clip over the last five years. TBVPS growth has also accelerated recently, growing by 18.5% annually over the last two years from $20.17 to $28.30 per share.
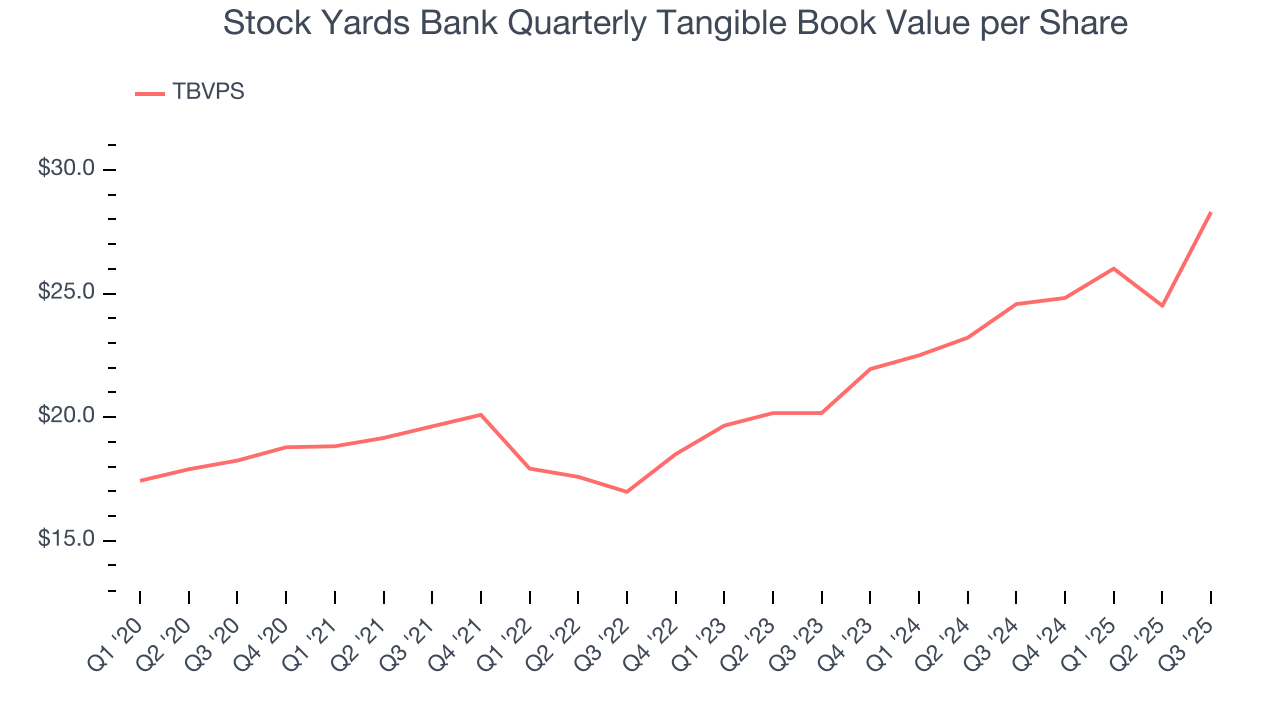
Over the next 12 months, Consensus estimates call for Stock Yards Bank’s TBVPS to grow by 11.8% to $31.65, top-notch growth rate.
9. Balance Sheet Assessment
Leverage is core to a financial firm’s business model (loans funded by deposits). To ensure economic stability and avoid a repeat of the 2008 GFC, regulators require certain levels of capital and liquidity, focusing on the Tier 1 capital ratio.
Tier 1 capital is the highest-quality capital that a firm holds, consisting primarily of common stock and retained earnings, but also physical gold. It serves as the primary cushion against losses and is the first line of defense in times of financial distress.
This capital is divided by risk-weighted assets to derive the Tier 1 capital ratio. Risk-weighted means that cash and US treasury securities are assigned little risk while unsecured consumer loans and equity investments get much higher risk weights, for example.
New regulation after the 2008 financial crisis requires that all firms must maintain a Tier 1 capital ratio greater than 4.5%. On top of this, there are additional buffers based on scale, risk profile, and other regulatory classifications, so that at the end of the day, firms generally must maintain a 7-10% ratio at minimum.
Over the last two years, Stock Yards Bank has averaged a Tier 1 capital ratio of 11.2%, which is considered safe and well capitalized in the event that macro or market conditions suddenly deteriorate.
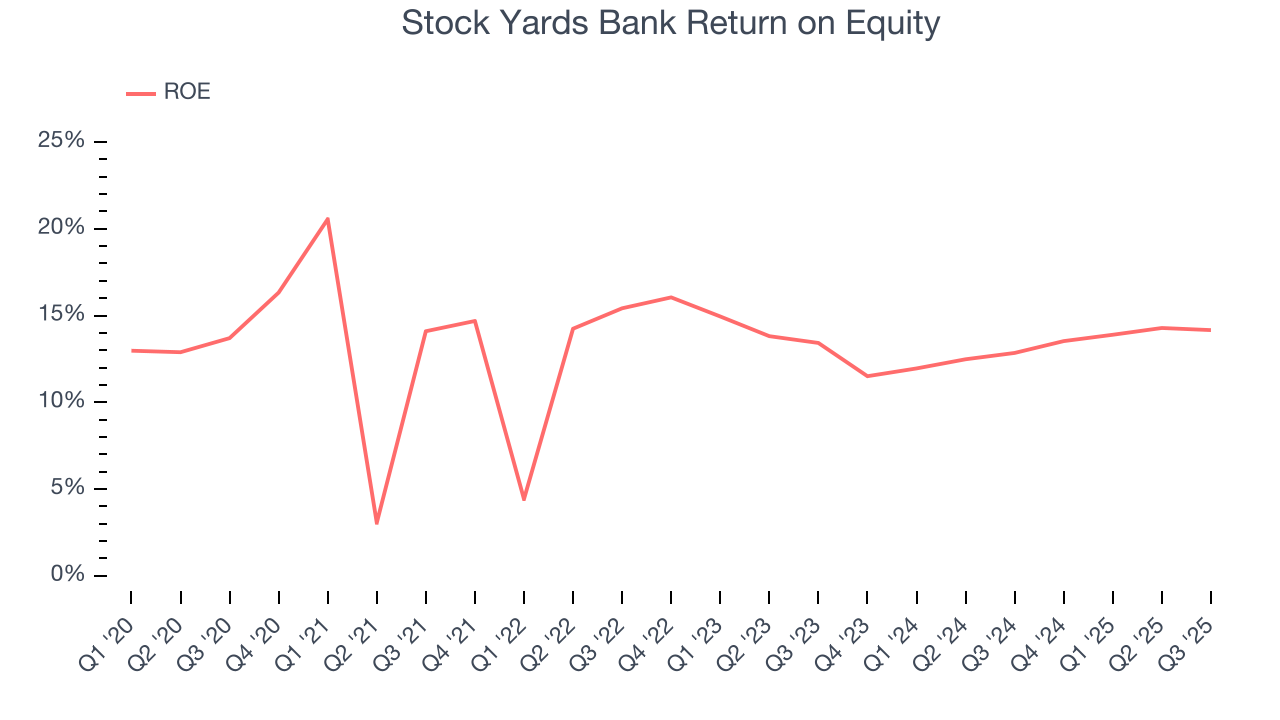
10. Return on Equity
Return on equity, or ROE, quantifies bank profitability relative to shareholder equity - an essential capital source for these institutions. Over extended periods, superior ROE performance drives faster shareholder wealth compounding through reinvestment, share repurchases, and dividend growth.
Over the last five years, Stock Yards Bank has averaged an ROE of 13.3%, excellent for a company operating in a sector where the average shakes out around 7.5% and those putting up 15%+ are greatly admired. This shows Stock Yards Bank has a strong competitive moat.
11. Key Takeaways from Stock Yards Bank’s Q3 Results
It was encouraging to see Stock Yards Bank beat analysts’ net interest income and net interest margin expectations this quarter. We were also happy its revenue, EPS, and TBVPS outperformed Wall Street’s estimates. Overall, this print had some key positives. The stock remained flat at $66.42 immediately after reporting.
12. Is Now The Time To Buy Stock Yards Bank?
Updated: March 19, 2026 at 12:53 AM EDT
The latest quarterly earnings matters, sure, but we actually think longer-term fundamentals and valuation matter more. Investors should consider all these pieces before deciding whether or not to invest in Stock Yards Bank.
There are some positives when it comes to Stock Yards Bank’s fundamentals. First off, its revenue growth was impressive over the last five years. And while its projected EPS for the next year is lacking, its TBVPS growth was exceptional over the last five years. On top of that, its net interest income growth was impressive over the last five years.
Stock Yards Bank’s P/B ratio based on the next 12 months is 1.7x. This valuation tells us that a lot of optimism is priced in. This is a good one to add to your watchlist - there are better opportunities elsewhere at the moment.
Wall Street analysts have a consensus one-year price target of $76 on the company (compared to the current share price of $62.04).