
Universal Logistics (ULH)
Universal Logistics keeps us up at night. Its weak sales growth and declining returns on capital show its demand and profits are shrinking.― StockStory Analyst Team
1. News


2. Summary
Why We Think Universal Logistics Will Underperform
Founded in 1932, Universal Logistics (NASDAQ:ULH) is a provider of customized transportation and logistics solutions operating throughout the United States and in Mexico, Canada, and Colombia.
- Sales tumbled by 2.7% annually over the last two years, showing market trends are working against its favor during this cycle
- Performance over the past five years shows its incremental sales were much less profitable, as its earnings per share fell by 5.5% annually
- Sales are projected to tank by 3.6% over the next 12 months as its demand continues evaporating


Universal Logistics falls short of our expectations. We’re looking for better stocks elsewhere.
Why There Are Better Opportunities Than Universal Logistics


Universal Logistics is trading at $16.09 per share, or 24.1x forward P/E. Universal Logistics’s valuation may seem like a bargain, especially when stacked up against other industrials companies. We remind you that you often get what you pay for, though.
It’s better to pay up for high-quality businesses with higher long-term earnings potential rather than to buy lower-quality stocks because they appear cheap. These challenged businesses often don’t re-rate, a phenomenon known as a “value trap”.
3. Universal Logistics (ULH) Research Report: Q3 CY2025 Update
Transportation and logistics solutions provider Universal Logistics (NASDAQ:ULH) missed Wall Street’s revenue expectations in Q3 CY2025, with sales falling 7% year on year to $396.8 million. Its non-GAAP loss of $0.07 per share was significantly below analysts’ consensus estimates.
Universal Logistics (ULH) Q3 CY2025 Highlights:
- Revenue: $396.8 million vs analyst estimates of $400.6 million (7% year-on-year decline, 1% miss)
- Adjusted EPS: -$0.07 vs analyst estimates of $0.18 (significant miss)
- Adjusted EBITDA: $43.33 million vs analyst estimates of $58.6 million (10.9% margin, 26.1% miss)
- Operating Margin: 1.8%, down from 10.9% in the same quarter last year
- Free Cash Flow was -$28.59 million compared to -$58.9 million in the same quarter last year
- Market Capitalization: $429.2 million
Company Overview
Founded in 1932, Universal Logistics (NASDAQ:ULH) is a provider of customized transportation and logistics solutions operating throughout the United States and in Mexico, Canada, and Colombia.
The company offers services including truckload, brokerage, intermodal, dedicated, and value-added services, catering to a diverse customer base across various industries. Its operations are structured into four distinct reportable segments: contract logistics, intermodal, trucking, and company-managed brokerage.
The contract logistics segment focuses on value-added and dedicated transportation services, primarily serving original equipment manufacturers and major retailers. The intermodal segment specializes in local and regional drayage moves, while the trucking segment handles individual freight shipments coordinated by agents. The company-managed brokerage segment deals with the pick-up and delivery of individual freight shipments using third-party carriers.
Truckload services, which include dry van, flatbed, heavy-haul, and refrigerated operations, make up the majority of sales. Brokerage services, including domestic and international freight forwarding and customs brokerage, form another important revenue stream. Intermodal operations, focusing on steamship-truck and rail-truck support services, represent a substantial portion of the company's earnings. Dedicated services, primarily supporting automotive customers, and value-added services, such as material handling, consolidation, and warehousing round out the company's revenue sources.
4. Ground Transportation
The growth of e-commerce and global trade continues to drive demand for shipping services, especially last-mile delivery, presenting opportunities for ground transportation companies. The industry continues to invest in data, analytics, and autonomous fleets to optimize efficiency and find the most cost-effective routes. Despite the essential services this industry provides, ground transportation companies are still at the whim of economic cycles. Consumer spending, for example, can greatly impact the demand for these companies’ offerings while fuel costs can influence profit margins.
Competitors in the transportation and logistics industry include J.B. Hunt (NASDAQ:JBHT), C.H. Robinson (NASDAQ:CHRW), and XPO Logistics (NYSE:XPO)
5. Revenue Growth
A company’s long-term sales performance is one signal of its overall quality. Even a bad business can shine for one or two quarters, but a top-tier one grows for years. Regrettably, Universal Logistics’s sales grew at a sluggish 3.5% compounded annual growth rate over the last five years. This was below our standard for the industrials sector and is a rough starting point for our analysis.
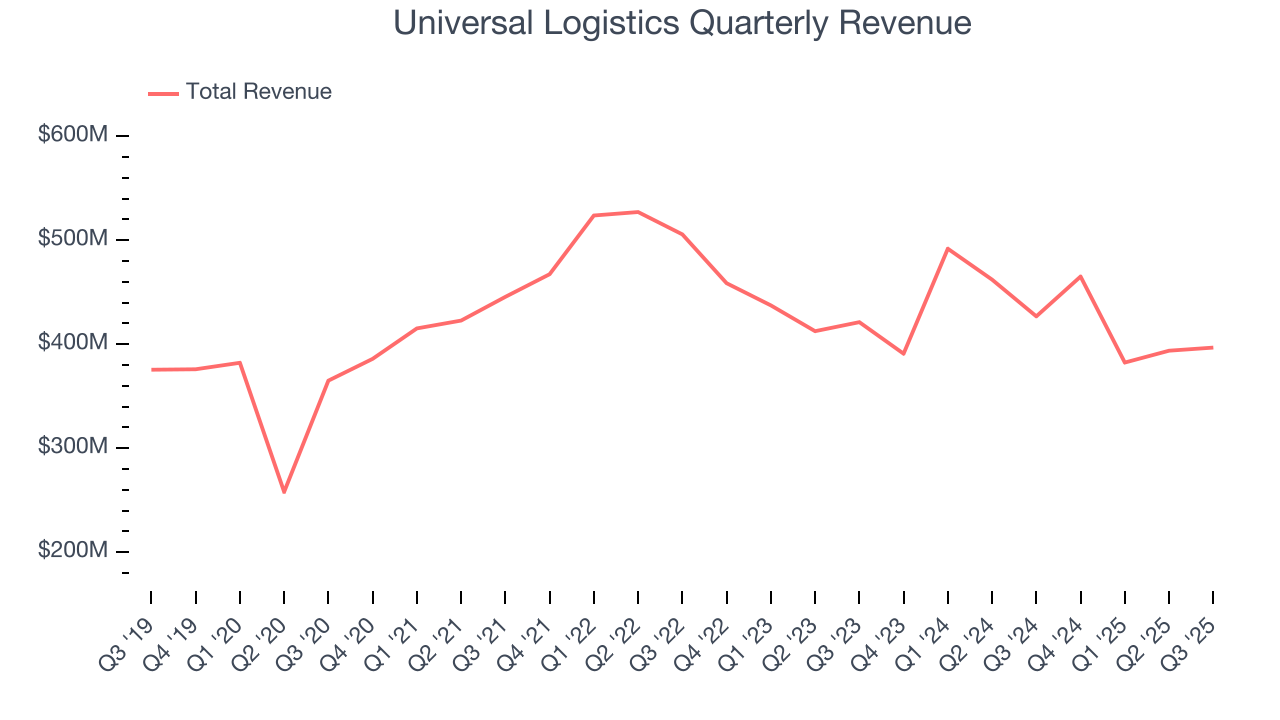
Long-term growth is the most important, but within industrials, a half-decade historical view may miss new industry trends or demand cycles. Universal Logistics’s performance shows it grew in the past but relinquished its gains over the last two years, as its revenue fell by 2.7% annually. Universal Logistics isn’t alone in its struggles as the Ground Transportation industry experienced a cyclical downturn, with many similar businesses observing lower sales at this time. 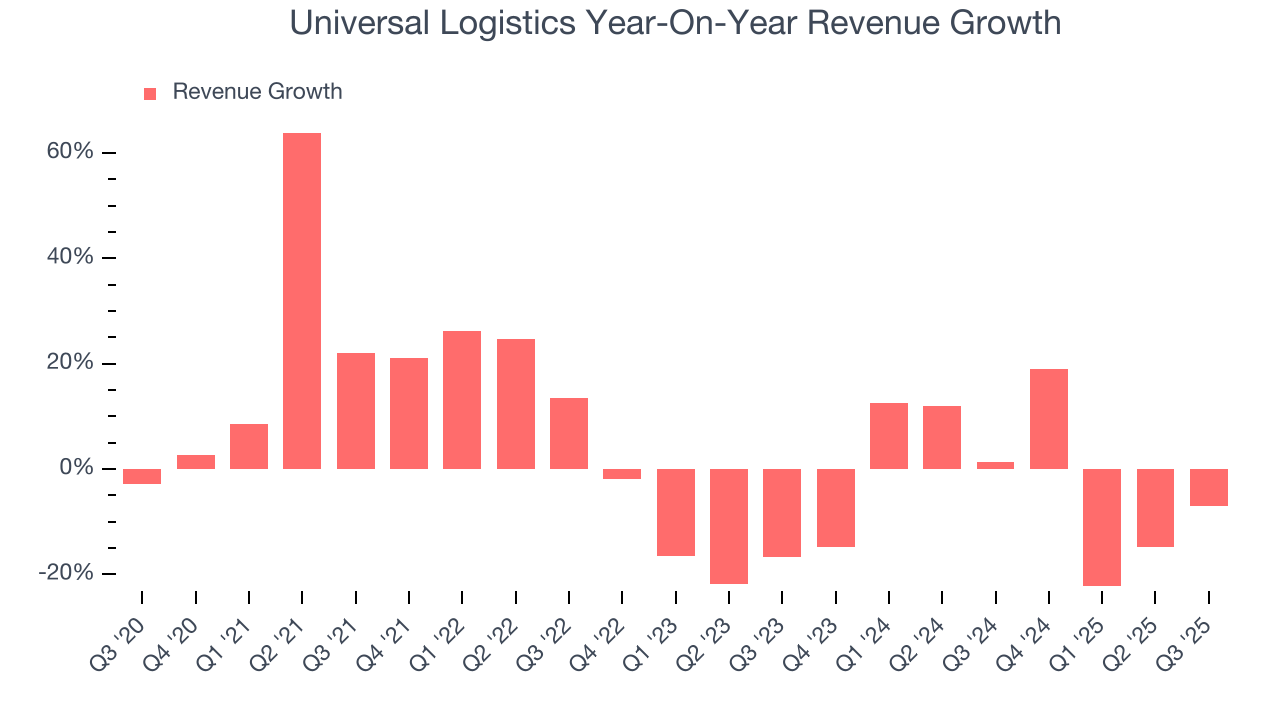
This quarter, Universal Logistics missed Wall Street’s estimates and reported a rather uninspiring 7% year-on-year revenue decline, generating $396.8 million of revenue.
Looking ahead, sell-side analysts expect revenue to decline by 3.6% over the next 12 months, similar to its two-year rate. This projection doesn't excite us and suggests its newer products and services will not catalyze better top-line performance yet.
6. Gross Margin & Pricing Power
All else equal, we prefer higher gross margins because they make it easier to generate more operating profits and indicate that a company commands pricing power by offering more differentiated products.
Universal Logistics has bad unit economics for an industrials business, signaling it operates in a competitive market. As you can see below, it averaged a 20.1% gross margin over the last five years. That means Universal Logistics paid its suppliers a lot of money ($79.89 for every $100 in revenue) to run its business. 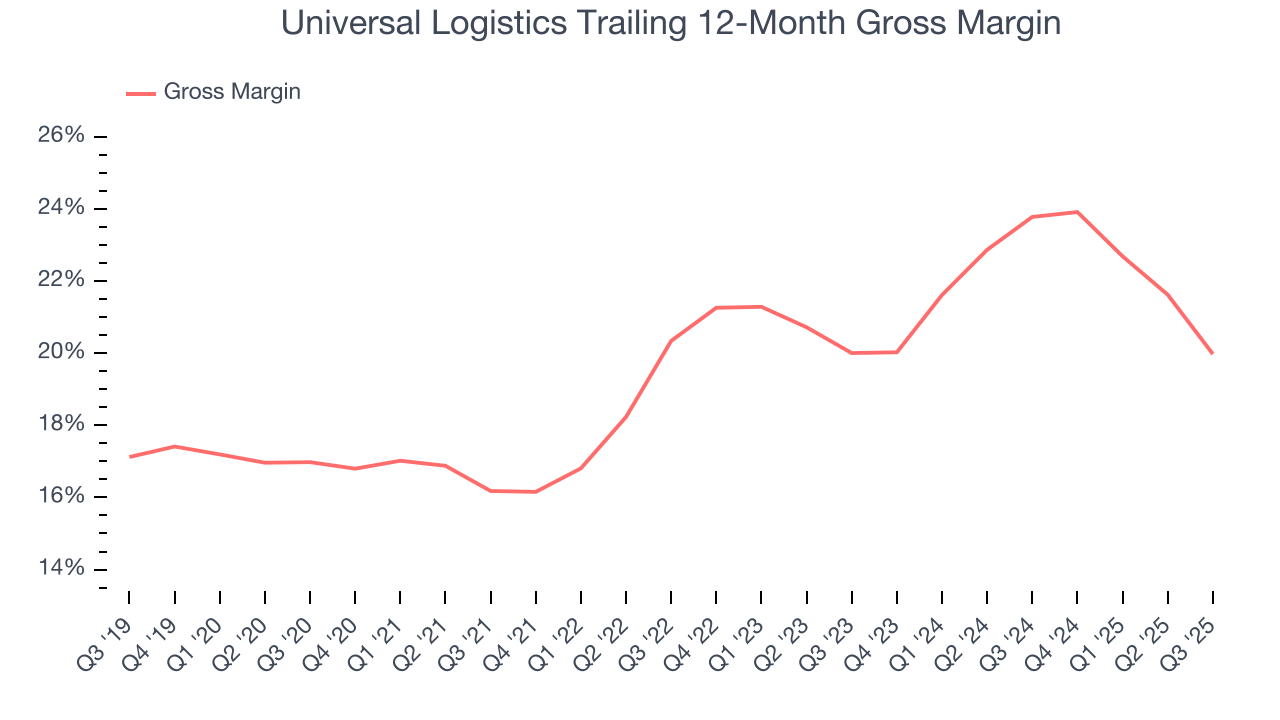
This quarter, Universal Logistics’s gross profit margin was 17.4%, down 6.6 percentage points year on year. Universal Logistics’s full-year margin has also been trending down over the past 12 months, decreasing by 3.8 percentage points. If this move continues, it could suggest a more competitive environment with some pressure to lower prices and higher input costs (such as raw materials and manufacturing expenses).
7. Operating Margin
Universal Logistics has done a decent job managing its cost base over the last five years. The company has produced an average operating margin of 8.8%, higher than the broader industrials sector.
Analyzing the trend in its profitability, Universal Logistics’s operating margin decreased by 1.5 percentage points over the last five years. Many Ground Transportation companies also saw their margins fall (along with revenue, as mentioned above) because the cycle turned in the wrong direction. We hope Universal Logistics can emerge from this a stronger company, as the silver lining of a downturn is that market share can be won and efficiencies found.
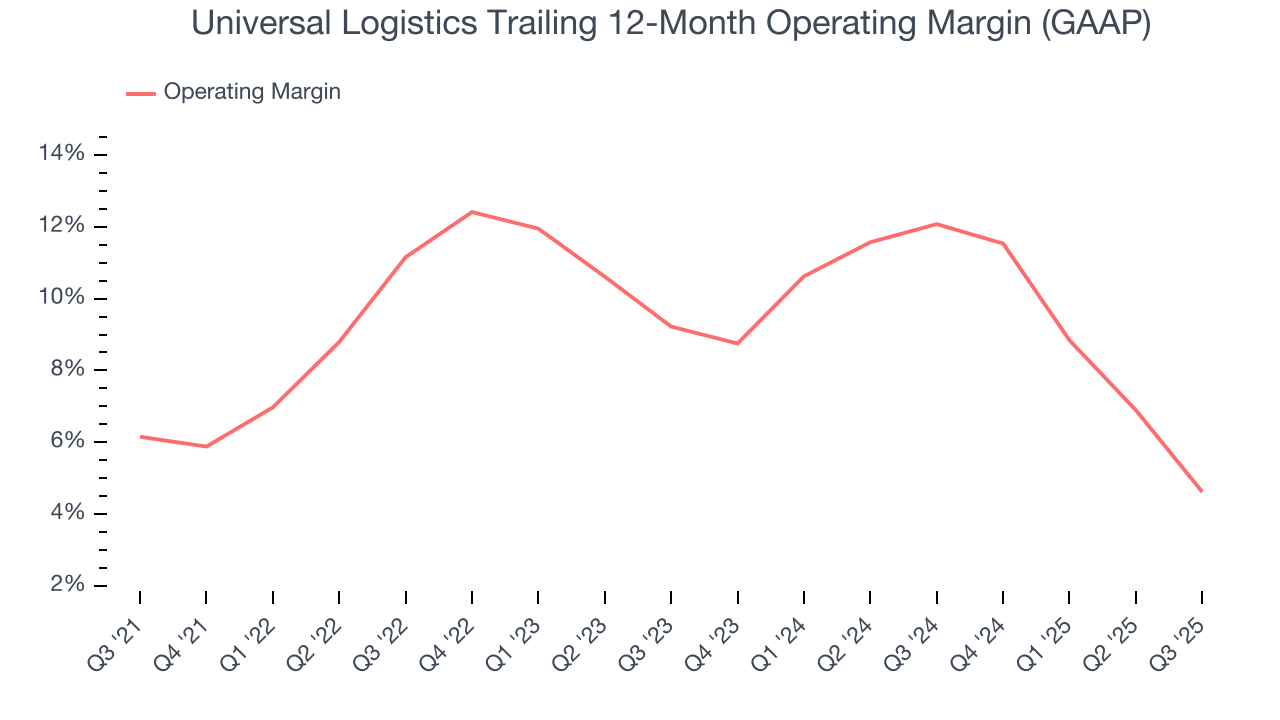
In Q3, Universal Logistics generated an operating margin profit margin of 1.8%, down 9.1 percentage points year on year. Since Universal Logistics’s operating margin decreased more than its gross margin, we can assume it was less efficient because expenses such as marketing, R&D, and administrative overhead increased.
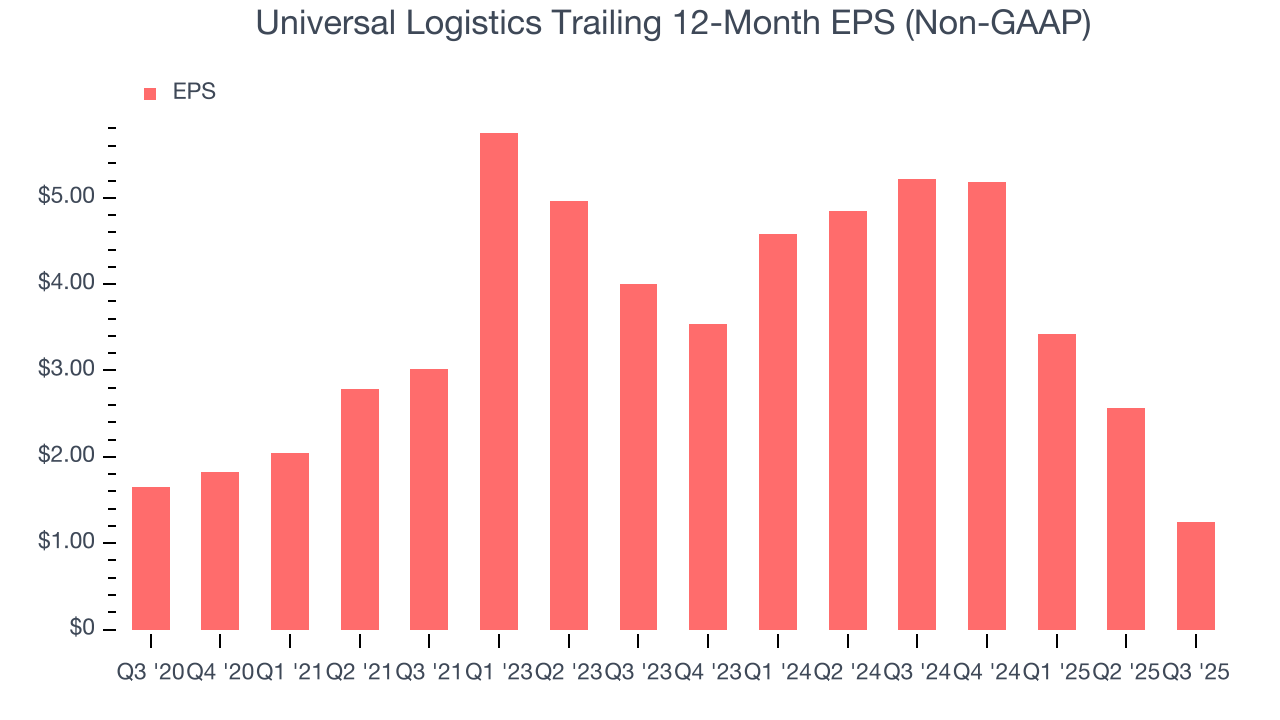
8. Earnings Per Share
Revenue trends explain a company’s historical growth, but the long-term change in earnings per share (EPS) points to the profitability of that growth – for example, a company could inflate its sales through excessive spending on advertising and promotions.
Sadly for Universal Logistics, its EPS declined by 5.5% annually over the last five years while its revenue grew by 3.5%. This tells us the company became less profitable on a per-share basis as it expanded due to non-fundamental factors such as interest expenses and taxes.
Diving into the nuances of Universal Logistics’s earnings can give us a better understanding of its performance. As we mentioned earlier, Universal Logistics’s operating margin declined by 1.5 percentage points over the last five years. This was the most relevant factor (aside from the revenue impact) behind its lower earnings; interest expenses and taxes can also affect EPS but don’t tell us as much about a company’s fundamentals.
Like with revenue, we analyze EPS over a more recent period because it can provide insight into an emerging theme or development for the business.
For Universal Logistics, its two-year annual EPS declines of 44.2% show it’s continued to underperform. These results were bad no matter how you slice the data.
In Q3, Universal Logistics reported adjusted EPS of negative $0.07, down from $1.25 in the same quarter last year. This print missed analysts’ estimates. Over the next 12 months, Wall Street expects Universal Logistics’s full-year EPS of $1.25 to shrink by 47.1%.
9. Cash Is King
If you’ve followed StockStory for a while, you know we emphasize free cash flow. Why, you ask? We believe that in the end, cash is king, and you can’t use accounting profits to pay the bills.
Universal Logistics broke even from a free cash flow perspective over the last five years, giving the company limited opportunities to return capital to shareholders.
Taking a step back, we can see that Universal Logistics’s margin dropped by 4.1 percentage points during that time. It may have ticked higher more recently, but shareholders are likely hoping for its margin to at least revert to its historical level. Almost any movement in the wrong direction is undesirable because of its already low cash conversion. If the longer-term trend returns, it could signal it’s becoming a more capital-intensive business.
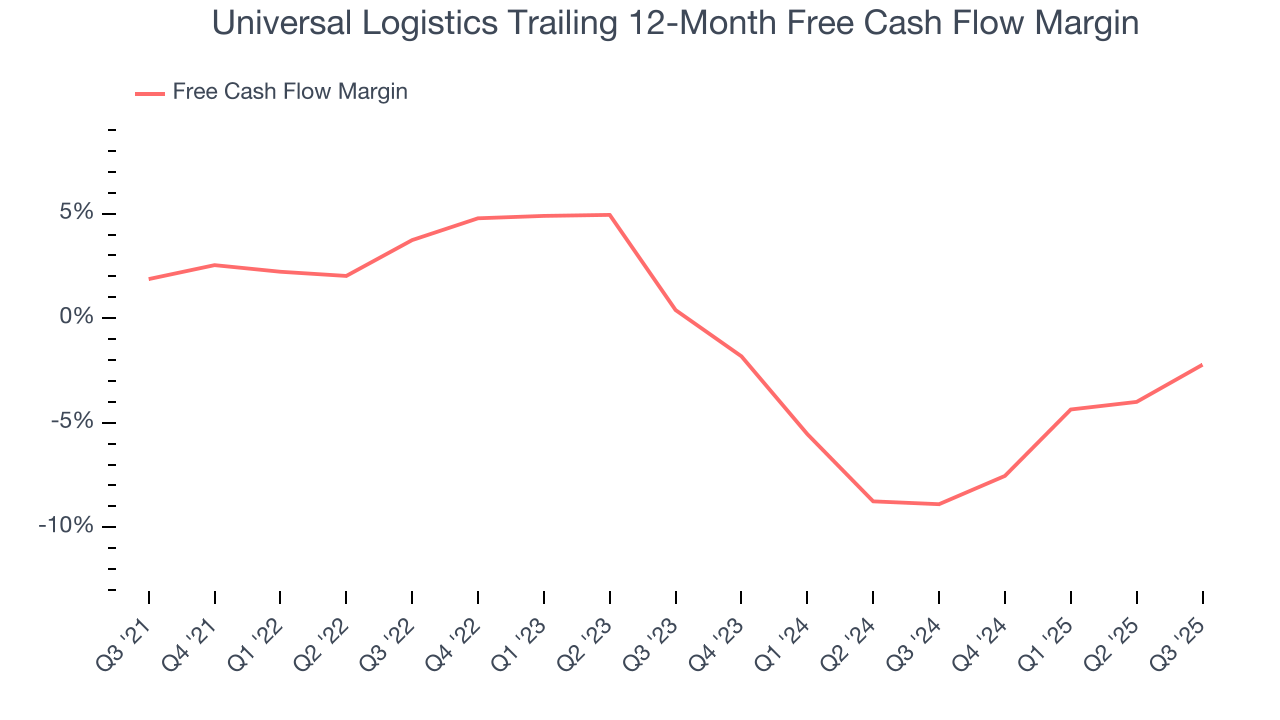
Universal Logistics burned through $28.59 million of cash in Q3, equivalent to a negative 7.2% margin. The company’s cash burn slowed from $58.9 million of lost cash in the same quarter last year.
10. Return on Invested Capital (ROIC)
EPS and free cash flow tell us whether a company was profitable while growing its revenue. But was it capital-efficient? A company’s ROIC explains this by showing how much operating profit it makes compared to the money it has raised (debt and equity).
Although Universal Logistics hasn’t been the highest-quality company lately because of its poor revenue and EPS performance, it historically found a few growth initiatives that worked out well. Its five-year average ROIC was 15%, impressive for an industrials business.
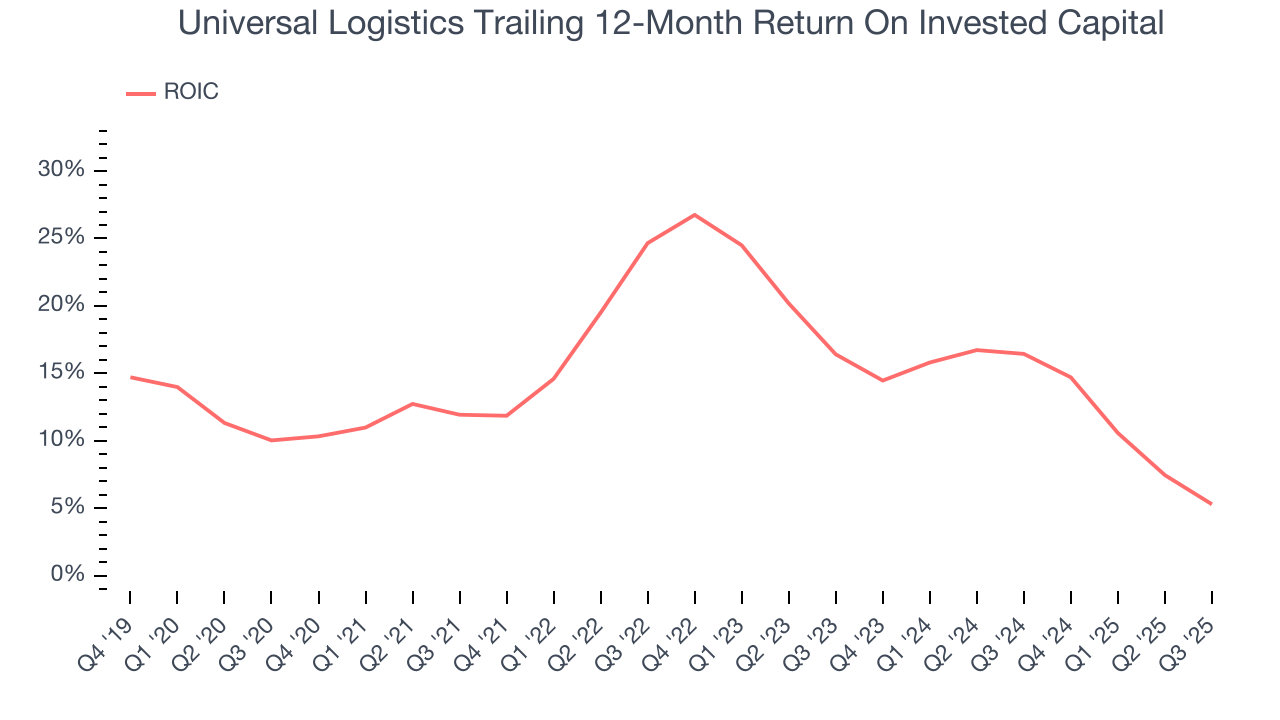
We like to invest in businesses with high returns, but the trend in a company’s ROIC is what often surprises the market and moves the stock price. Unfortunately, Universal Logistics’s ROIC has decreased over the last few years. We like what management has done in the past, but its declining returns are perhaps a symptom of fewer profitable growth opportunities.
11. Balance Sheet Assessment
Universal Logistics reported $37.17 million of cash and $962.4 million of debt on its balance sheet in the most recent quarter. As investors in high-quality companies, we primarily focus on two things: 1) that a company’s debt level isn’t too high and 2) that its interest payments are not excessively burdening the business.
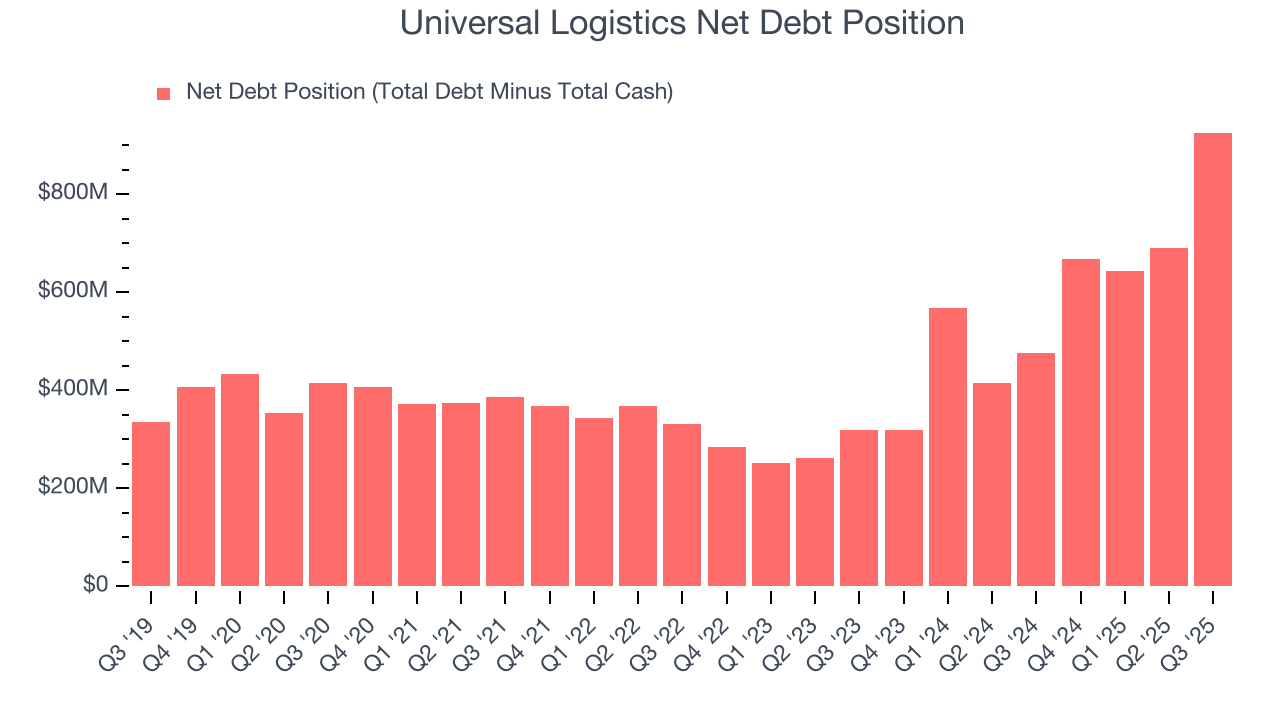
With $224.8 million of EBITDA over the last 12 months, we view Universal Logistics’s 4.1× net-debt-to-EBITDA ratio as safe. We also see its $36.89 million of annual interest expenses as appropriate. The company’s profits give it plenty of breathing room, allowing it to continue investing in growth initiatives.
12. Key Takeaways from Universal Logistics’s Q3 Results
We struggled to find many positives in these results. Its EBITDA missed and its EPS fell short of Wall Street’s estimates. Overall, this quarter could have been better. The stock remained flat at $16.16 immediately after reporting.
13. Is Now The Time To Buy Universal Logistics?
Updated: February 14, 2026 at 10:58 PM EST
We think that the latest earnings result is only one piece of the bigger puzzle. If you’re deciding whether to own Universal Logistics, you should also grasp the company’s longer-term business quality and valuation.
Universal Logistics doesn’t pass our quality test. For starters, its revenue growth was weak over the last five years, and analysts expect its demand to deteriorate over the next 12 months. While its solid ROIC suggests it has grown profitably in the past, the downside is its diminishing returns show management's prior bets haven't worked out. On top of that, its projected EPS for the next year is lacking.
Universal Logistics’s P/E ratio based on the next 12 months is 24.1x. At this valuation, there’s a lot of good news priced in - you can find more timely opportunities elsewhere.
Wall Street analysts have a consensus one-year price target of $17 on the company (compared to the current share price of $16.09).