
Valley National Bank (VLY)
Valley National Bank is in for a bumpy ride. Its weak sales growth and low returns on capital show it struggled to generate demand and profits.― StockStory Analyst Team
1. News


2. Summary
Why We Think Valley National Bank Will Underperform
Tracing its roots back to 1927 during the economic boom before the Great Depression, Valley National Bancorp (NASDAQGS:VLY) operates Valley National Bank, providing commercial, consumer, and wealth management banking services across several states.
- Earnings per share were flat over the last five years while its revenue grew, showing its incremental sales were less profitable
- Estimated net interest income decline of 7.1% for the next 12 months implies a challenging demand environment
- Sales trends were unexciting over the last two years as its 3.7% annual growth was below the typical banking company


Valley National Bank doesn’t check our boxes. There are more appealing investments to be made.
Why There Are Better Opportunities Than Valley National Bank


At $12.00 per share, Valley National Bank trades at 0.8x forward P/B. Valley National Bank’s valuation may seem like a bargain, especially when stacked up against other banking companies. We remind you that you often get what you pay for, though.
Cheap stocks can look like a great deal at first glance, but they can be value traps. They often have less earnings power, meaning there is more reliance on a re-rating to generate good returns - an unlikely scenario for low-quality companies.
3. Valley National Bank (VLY) Research Report: Q4 CY2025 Update
Regional banking company Valley National Bancorp (NASDAQ:VLY) reported Q4 CY2025 results exceeding the market’s revenue expectations, with sales up 12% year on year to $541.2 million. Its non-GAAP profit of $0.31 per share was 7.1% above analysts’ consensus estimates.
Valley National Bank (VLY) Q4 CY2025 Highlights:
- Net Interest Income: $464.9 million vs analyst estimates of $462.3 million (9.9% year-on-year growth, 0.6% beat)
- Net Interest Margin: 3.2% vs analyst estimates of 3.1% (6.1 basis point beat)
- Revenue: $541.2 million vs analyst estimates of $526 million (12% year-on-year growth, 2.9% beat)
- Efficiency Ratio: 53.5% vs analyst estimates of 53.2% (31.6 basis point miss)
- Adjusted EPS: $0.31 vs analyst estimates of $0.29 (7.1% beat)
- Tangible Book Value per Share: $9.85 vs analyst estimates of $9.77 (7.8% year-on-year growth, 0.9% beat)
- Market Capitalization: $6.84 billion
Company Overview
Tracing its roots back to 1927 during the economic boom before the Great Depression, Valley National Bancorp (NASDAQGS:VLY) operates Valley National Bank, providing commercial, consumer, and wealth management banking services across several states.
Valley National Bank serves both businesses and individuals through its network of branches spanning New Jersey, New York, Florida, Alabama, California, and Illinois. For commercial clients, the bank offers a comprehensive suite of lending solutions including commercial real estate financing, asset-based loans, equipment financing, and specialized services for industries like healthcare and cannabis. Its commercial real estate portfolio encompasses diverse property types from multifamily residential to industrial/warehouse facilities.
On the consumer side, Valley provides traditional banking products such as checking and savings accounts alongside residential mortgages, home equity loans, and automobile financing. The bank's digital services include online and mobile banking, remote deposit capture, and ATM access, complementing its physical branch network.
Beyond core banking, Valley operates a Wealth Management division offering asset management advisory services, brokerage, trust administration, and insurance products. For example, a high-net-worth client might use Valley's trust services to establish and manage an investment portfolio for generational wealth transfer, while simultaneously accessing the bank's mortgage services for property acquisition.
Valley generates revenue through interest income on loans and investments, as well as fees from wealth management services, insurance products, and various banking transactions. The bank's Treasury division manages its investment securities portfolio, which includes U.S. Treasury securities, mortgage-backed securities, and municipal bonds, providing additional income and liquidity management.
4. Regional Banks
Regional banks, financial institutions operating within specific geographic areas, serve as intermediaries between local depositors and borrowers. They benefit from rising interest rates that improve net interest margins (the difference between loan yields and deposit costs), digital transformation reducing operational expenses, and local economic growth driving loan demand. However, these banks face headwinds from fintech competition, deposit outflows to higher-yielding alternatives, credit deterioration (increasing loan defaults) during economic slowdowns, and regulatory compliance costs. Recent concerns about regional bank stability following high-profile failures and significant commercial real estate exposure present additional challenges.
Valley National Bancorp competes with other regional banks operating in its markets, including M&T Bank (NYSE:MTB), Citizens Financial Group (NYSE:CFG), and New York Community Bancorp (NYSE:NYCB), as well as larger national institutions like JPMorgan Chase (NYSE:JPM) and Bank of America (NYSE:BAC).
5. Sales Growth
Net interest income and and fee-based revenue are the two pillars supporting bank earnings. The former captures profit from the gap between lending rates and deposit costs, while the latter encompasses charges for banking services, credit products, wealth management, and trading activities. Over the last five years, Valley National Bank grew its revenue at a mediocre 9.2% compounded annual growth rate. This was below our standard for the banking sector and is a poor baseline for our analysis.
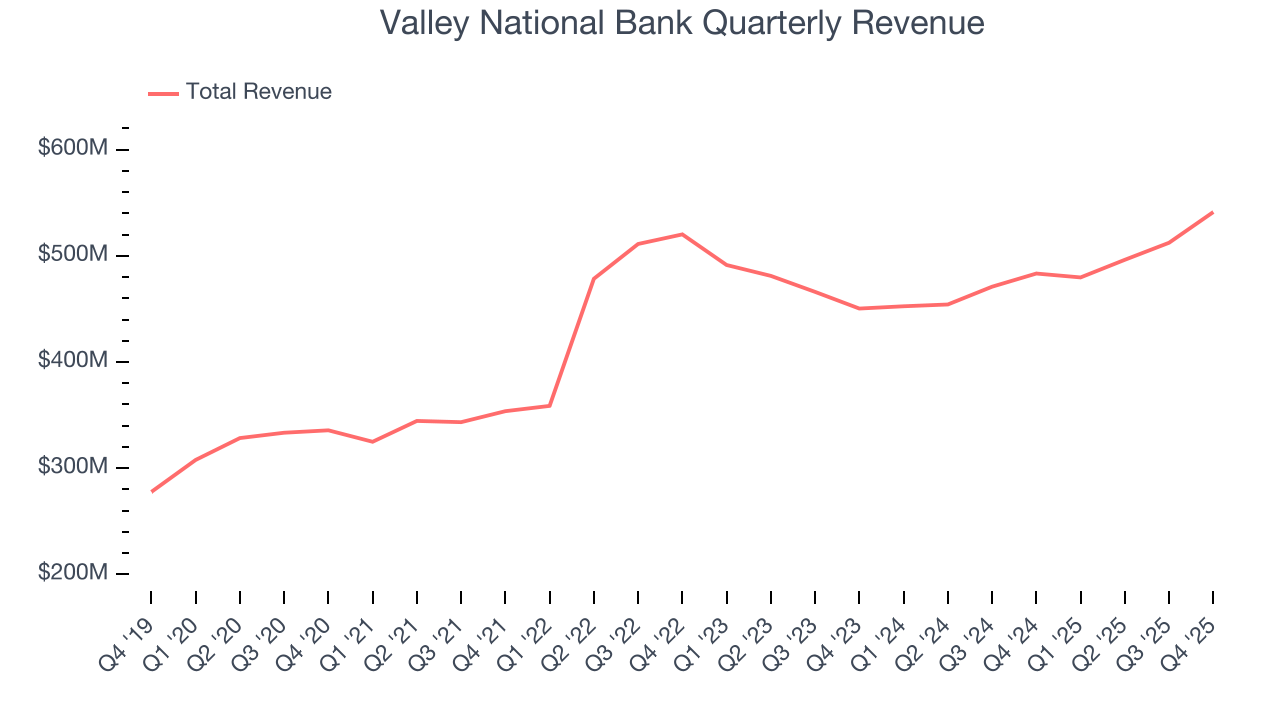
Long-term growth is the most important, but within financials, a half-decade historical view may miss recent interest rate changes and market returns. Valley National Bank’s recent performance shows its demand has slowed as its annualized revenue growth of 3.7% over the last two years was below its five-year trend. 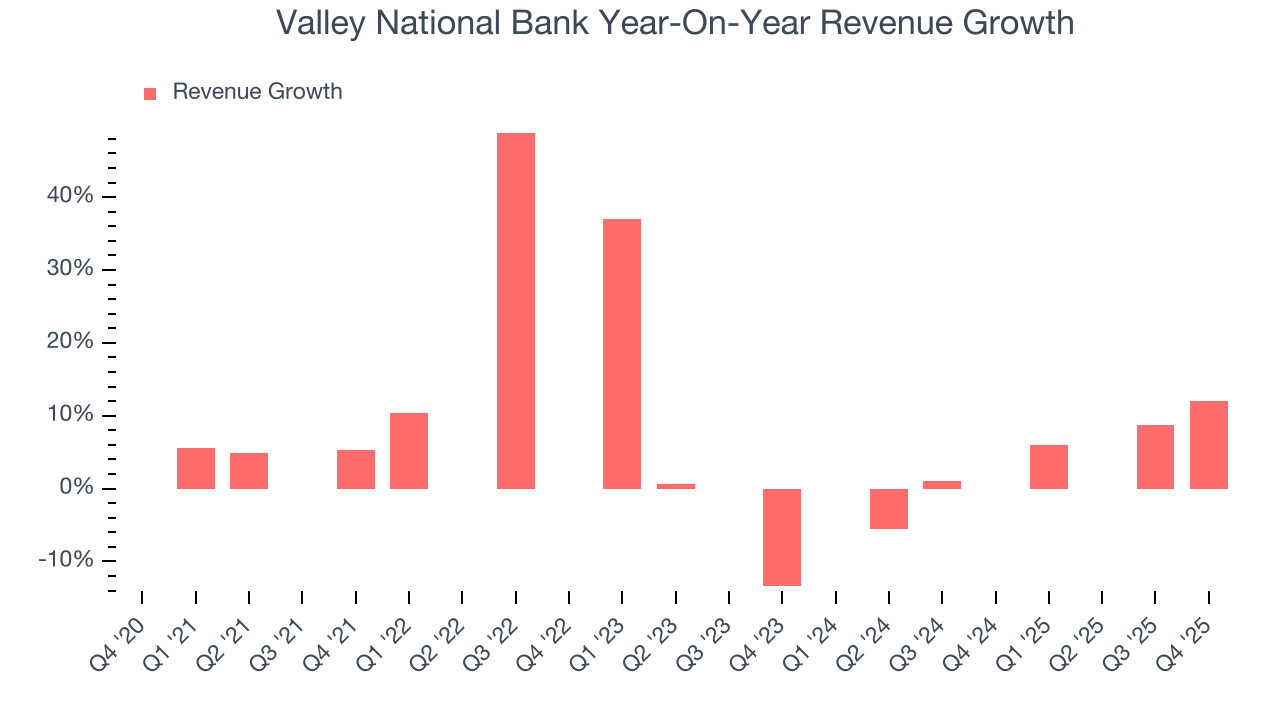 Note: Quarters not shown were determined to be outliers, impacted by outsized investment gains/losses that are not indicative of the recurring fundamentals of the business.
This quarter, Valley National Bank reported year-on-year revenue growth of 12%, and its $541.2 million of revenue exceeded Wall Street’s estimates by 2.9%.
Net interest income made up 87.9% of the company’s total revenue during the last five years, meaning Valley National Bank barely relies on non-interest income to drive its overall growth.
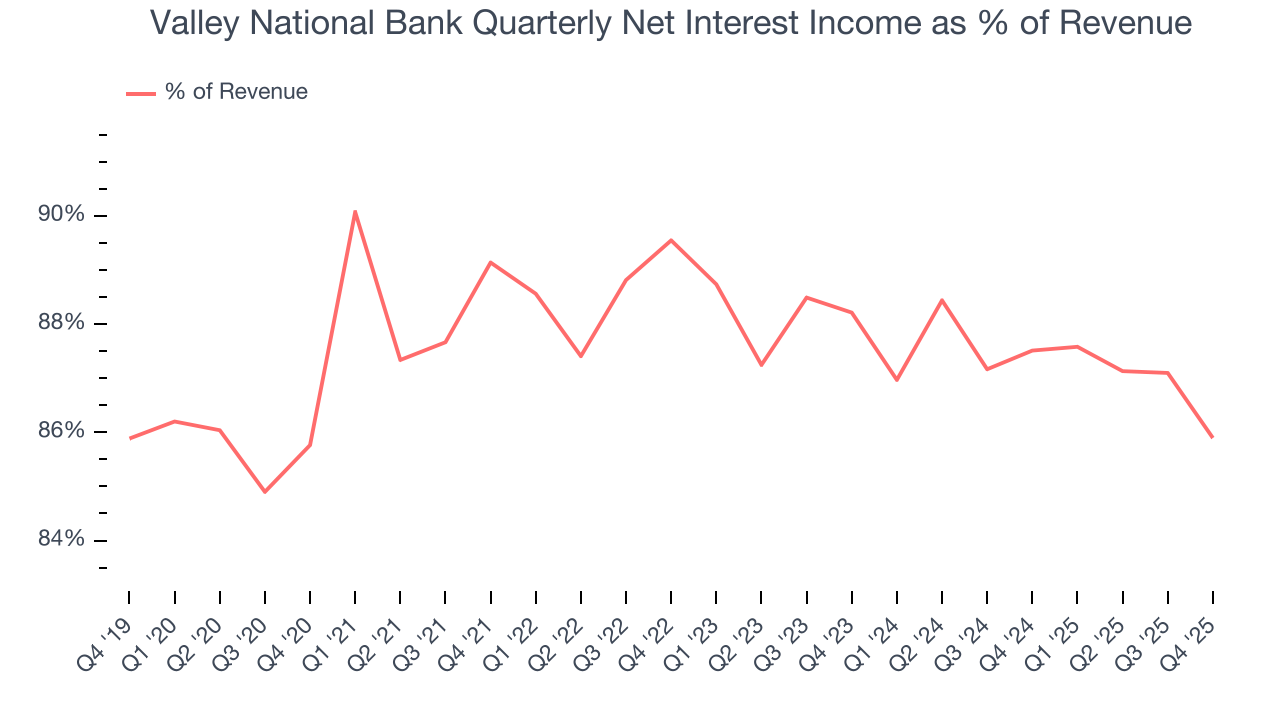
Net interest income commands greater market attention due to its reliability and consistency, whereas non-interest income is often seen as lower-quality revenue that lacks the same dependable characteristics.
6. Efficiency Ratio
The underlying profitability of top-line growth determines the actual bottom-line impact. Banking institutions measure this dynamic using the efficiency ratio, which is calculated by dividing non-interest expenses like personnel, facilities, technology, and marketing by total revenue.
Markets understand that a bank’s expense base depends on its revenue mix and what mostly drives share price performance is the change in this ratio, rather than its absolute value. It’s somewhat counterintuitive, but a lower efficiency ratio is better.
Over the last five years, Valley National Bank’s efficiency ratio has increased by 6.9 percentage points, going from 48.1% to 54.5%. Said differently, the company’s expenses have increased at a faster rate than revenue, which usually raises questions unless the company is in high-growth mode and reinvesting its profits into attractive ventures.
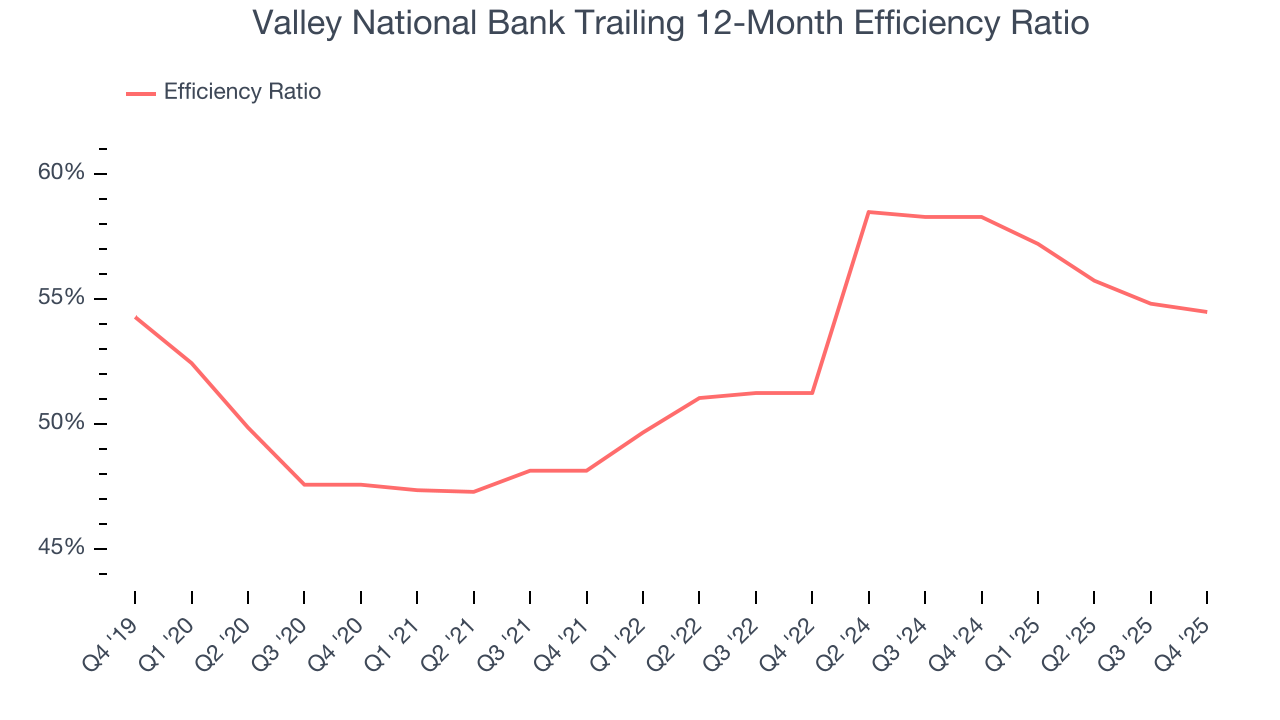
In Q4, Valley National Bank’s efficiency ratio was 53.5%, falling short of analysts’ expectations by 31.6 basis points (100 basis points = 1 percentage point).
For the next 12 months, Wall Street expects Valley National Bank to rein in some of its expenses as it anticipates an efficiency ratio of 51.7%.
7. Earnings Per Share
We track the long-term change in earnings per share (EPS) for the same reason as long-term revenue growth. Compared to revenue, however, EPS highlights whether a company’s growth is profitable.
Valley National Bank’s flat EPS over the last five years was below its 9.2% annualized revenue growth. However, its efficiency ratio actually improved during this time, telling us that non-fundamental factors such as taxes affected its ultimate earnings.
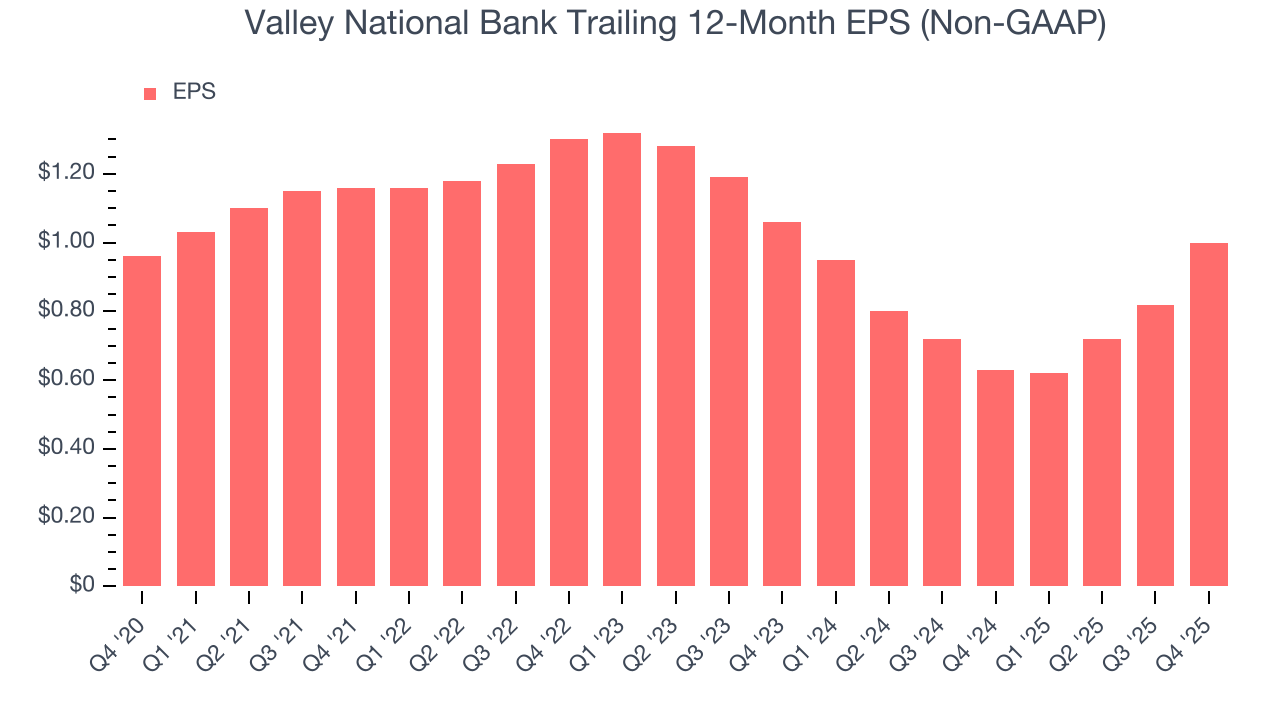
Like with revenue, we analyze EPS over a more recent period because it can provide insight into an emerging theme or development for the business.
For Valley National Bank, its two-year annual EPS declines of 2.9% show its recent history was to blame for its underperformance over the last five years. These results were bad no matter how you slice the data.
In Q4, Valley National Bank reported adjusted EPS of $0.31, up from $0.13 in the same quarter last year. This print beat analysts’ estimates by 7.1%. Over the next 12 months, Wall Street expects Valley National Bank’s full-year EPS of $1 to grow 24.1%.
8. Tangible Book Value Per Share (TBVPS)
Banks profit by intermediating between depositors and borrowers, making them fundamentally balance sheet-driven enterprises. Market participants emphasize balance sheet quality and sustained book value growth when evaluating these institutions.
This explains why tangible book value per share (TBVPS) stands as the premier banking metric. TBVPS strips away questionable intangible assets, revealing concrete per-share net worth that investors can trust. Traditional metrics like EPS are helpful but face distortion from M&A activity and loan loss accounting rules.
Valley National Bank’s TBVPS grew at a solid 6.2% annual clip over the last five years. The last two years show a similar trajectory as TBVPS grew by 5.6% annually from $8.83 to $9.85 per share.
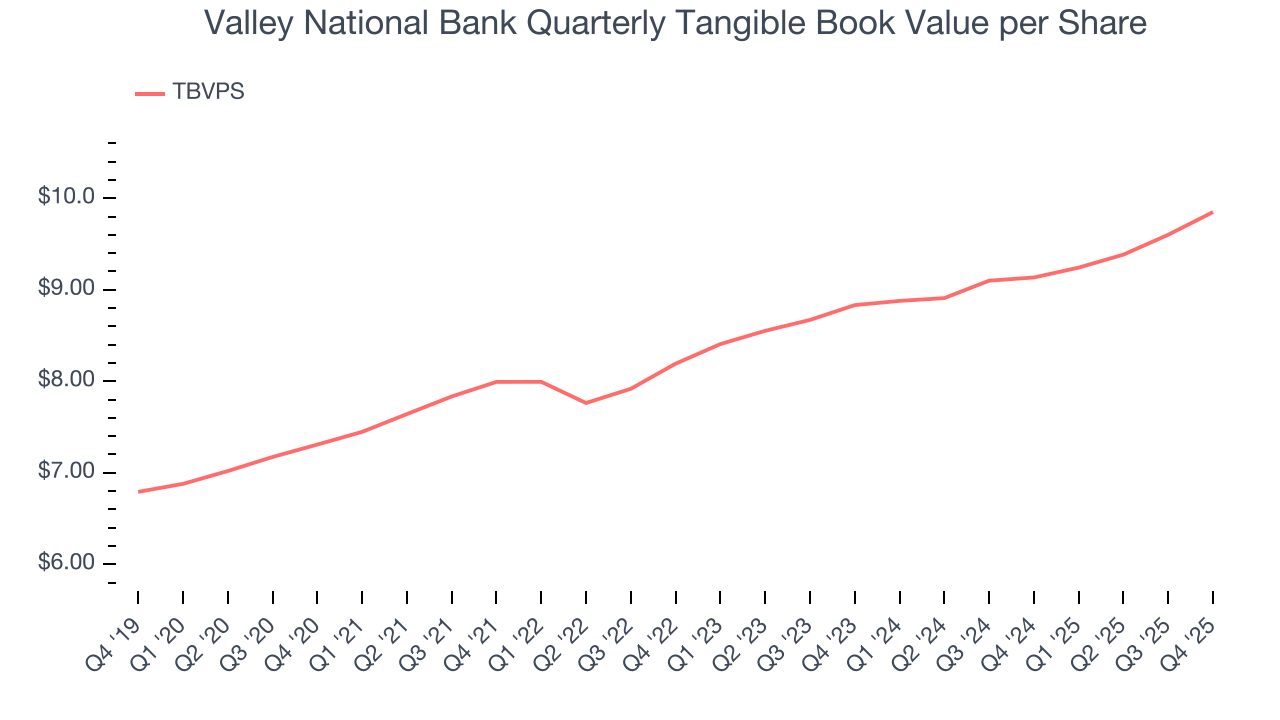
Over the next 12 months, Consensus estimates call for Valley National Bank’s TBVPS to grow by 7.6% to $10.60, paltry growth rate.
9. Balance Sheet Assessment
Leverage is core to a financial firm’s business model (loans funded by deposits). To ensure economic stability and avoid a repeat of the 2008 GFC, regulators require certain levels of capital and liquidity, focusing on the Tier 1 capital ratio.
Tier 1 capital is the highest-quality capital that a firm holds, consisting primarily of common stock and retained earnings, but also physical gold. It serves as the primary cushion against losses and is the first line of defense in times of financial distress.
This capital is divided by risk-weighted assets to derive the Tier 1 capital ratio. Risk-weighted means that cash and US treasury securities are assigned little risk while unsecured consumer loans and equity investments get much higher risk weights, for example.
New regulation after the 2008 financial crisis requires that all firms must maintain a Tier 1 capital ratio greater than 4.5%. On top of this, there are additional buffers based on scale, risk profile, and other regulatory classifications, so that at the end of the day, firms generally must maintain a 7-10% ratio at minimum.
Over the last two years, Valley National Bank has averaged a Tier 1 capital ratio of 10.4%, which is considered safe and well capitalized in the event that macro or market conditions suddenly deteriorate.
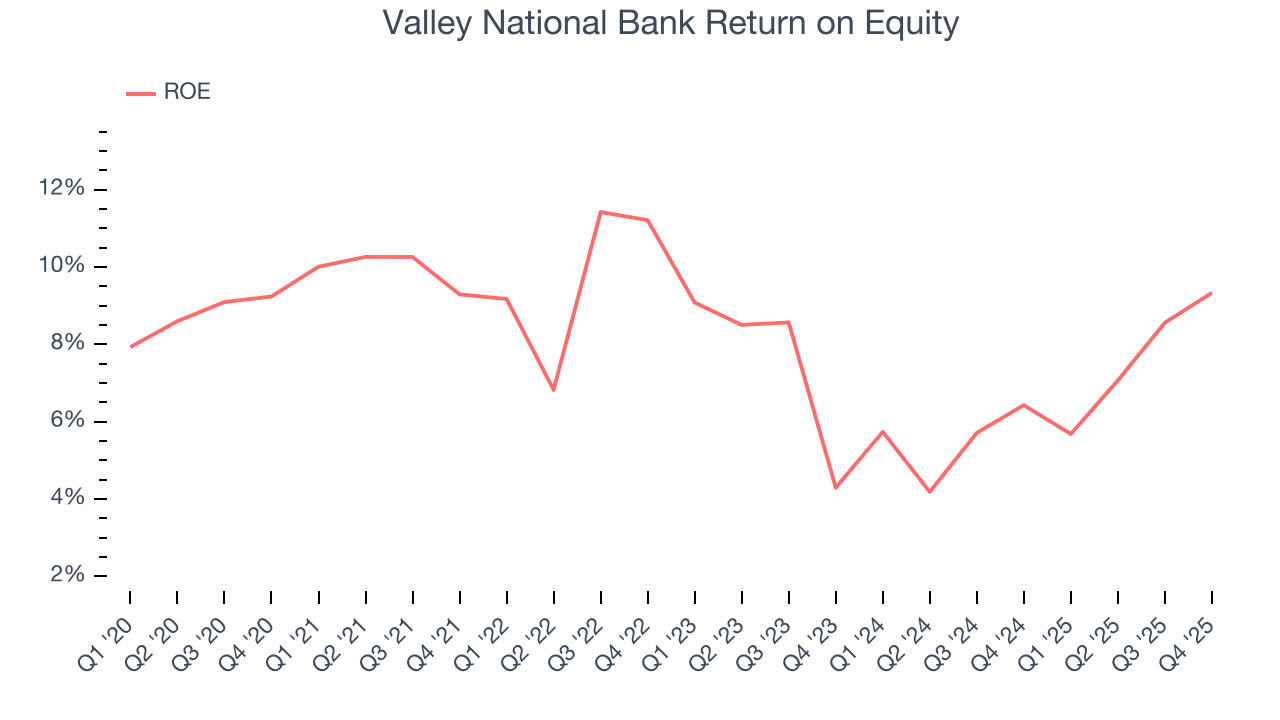
10. Return on Equity
Return on equity, or ROE, quantifies bank profitability relative to shareholder equity - an essential capital source for these institutions. Over extended periods, superior ROE performance drives faster shareholder wealth compounding through reinvestment, share repurchases, and dividend growth.
Over the last five years, Valley National Bank has averaged an ROE of 8.1%, uninspiring for a company operating in a sector where the average shakes out around 7.5%.
11. Key Takeaways from Valley National Bank’s Q4 Results
We enjoyed seeing Valley National Bank beat analysts’ revenue expectations this quarter. We were also happy its tangible book value per share narrowly outperformed Wall Street’s estimates. Overall, this print had some key positives. The stock remained flat at $12.35 immediately after reporting.
12. Is Now The Time To Buy Valley National Bank?
Updated: March 24, 2026 at 12:46 AM EDT
A common mistake we notice when investors are deciding whether to buy a stock or not is that they simply look at the latest earnings results. Business quality and valuation matter more, so we urge you to understand these dynamics as well.
We see the value of companies driving economic growth, but in the case of Valley National Bank, we’re out. For starters, its revenue growth was mediocre over the last five years. While its projected EPS for the next year implies the company’s fundamentals will improve, the downside is its weak EPS growth over the last five years shows it’s failed to produce meaningful profits for shareholders. On top of that, its estimated net interest income for the next 12 months are weak.
Valley National Bank’s P/B ratio based on the next 12 months is 0.8x. This valuation multiple is fair, but we don’t have much confidence in the company. There are more exciting stocks to buy at the moment.
Wall Street analysts have a consensus one-year price target of $14.96 on the company (compared to the current share price of $12.00).
Although the price target is bullish, readers should exercise caution because analysts tend to be overly optimistic. The firms they work for, often big banks, have relationships with companies that extend into fundraising, M&A advisory, and other rewarding business lines. As a result, they typically hesitate to say bad things for fear they will lose out. We at StockStory do not suffer from such conflicts of interest, so we’ll always tell it like it is.