Workday (WDAY)
We’re skeptical of Workday. Its sluggish sales growth shows demand is soft, a worrisome sign for investors in high-quality stocks.― StockStory Analyst Team
1. News


2. Summary
Why Workday Is Not Exciting
Born from the vision of PeopleSoft founders after Oracle's hostile takeover of their previous company, Workday (NASDAQ:WDAY) provides cloud-based software for financial management, human resources, planning, and analytics to help organizations manage their business operations.
- Operating margin improvement of 2.6 percentage points over the last year demonstrates its ability to scale efficiently
- Estimated sales growth of 11.5% for the next 12 months implies demand will slow from its two-year trend
- A consolation is that its robust free cash flow profile gives it the flexibility to invest in growth initiatives or return capital to shareholders


Workday doesn’t satisfy our quality benchmarks. We see more attractive opportunities in the market.
Why There Are Better Opportunities Than Workday


Workday’s stock price of $131.63 implies a valuation ratio of 3.3x forward price-to-sales. Workday’s valuation may seem like a great deal, but we think there are valid reasons why it’s so cheap.
Cheap stocks can look like a great deal at first glance, but they can be value traps. They often have less earnings power, meaning there is more reliance on a re-rating to generate good returns - an unlikely scenario for low-quality companies.
3. Workday (WDAY) Research Report: Q4 CY2025 Update
Enterprise software company Workday (NASDAQ:WDAY) met Wall Street’s revenue expectations in Q4 CY2025, with sales up 14.5% year on year to $2.53 billion. Its non-GAAP profit of $2.47 per share was 6.4% above analysts’ consensus estimates.
Workday (WDAY) Q4 CY2025 Highlights:
- Revenue: $2.53 billion vs analyst estimates of $2.52 billion (14.5% year-on-year growth, in line)
- Adjusted EPS: $2.47 vs analyst estimates of $2.32 (6.4% beat)
- Adjusted Operating Income: $774 million vs analyst estimates of $720.5 million (30.6% margin, 7.4% beat)
- Subscription revenue guidance: Q1 growth of 13% year-on-year, full-year growth of 12-13% (both misses)
- Operating Margin: 6.9%, up from 3.4% in the same quarter last year
- Free Cash Flow Margin: 48.1%, up from 22.6% in the previous quarter
- Billings: $3.66 billion at quarter end, up 12.7% year on year
- Market Capitalization: $33.98 billion
Company Overview
Born from the vision of PeopleSoft founders after Oracle's hostile takeover of their previous company, Workday (NASDAQ:WDAY) provides cloud-based software for financial management, human resources, planning, and analytics to help organizations manage their business operations.
Workday's platform integrates critical business functions into a unified system, allowing organizations to maintain a single source of truth for their financial and workforce data. The company's software suite encompasses four main areas: financial management for accounting and financial processes; human capital management for the entire employee lifecycle from recruiting to retirement; planning tools for budgeting and forecasting; and analytics capabilities that transform data into actionable insights.
For example, a healthcare system might use Workday to manage its financial operations, track employee certifications, schedule staff, and analyze operational performance across multiple facilities—all within one integrated platform. A university could leverage the system to manage faculty, track grants, process student workers' payroll, and plan departmental budgets.
Workday generates revenue primarily through subscription-based licensing of its software, with additional income from professional services to help customers implement and optimize their systems. The company employs a direct sales model targeting medium and large enterprises across various industries, including professional services, healthcare, education, financial services, retail, and government.
The company has positioned itself as a cloud-native alternative to legacy enterprise software systems, emphasizing continuous innovation through its twice-yearly feature releases and weekly updates. Workday's platform is designed to be flexible and extensible, allowing customers and partners to build custom applications and integrations through tools like Workday Extend and the Workday Cloud Platform.
4. Finance and Accounting Software
Finance and accounting software benefits from dual trends around costs savings and ease of use. First is the SaaS-ification of businesses, large and small, who much prefer the flexibility of cloud-based, web-browser delivered software paid for on a subscription basis than the hassle and expense of purchasing and managing on-premise enterprise software. Second is the consumerization of business software, whereby multiple standalone processes like supply chain and tax management are aggregated into a single, easy to use platforms.
Workday competes primarily with established enterprise software vendors like Oracle Corporation (NYSE:ORCL) and SAP SE (NYSE:SAP), as well as specialized providers in specific application areas including Microsoft (NASDAQ:MSFT), ADP (NASDAQ:ADP), UKG (private), Coupa Software (private), and Dayforce (NYSE:DAY).
5. Revenue Growth
A company’s long-term performance is an indicator of its overall quality. Any business can experience short-term success, but top-performing ones enjoy sustained growth for years. Over the last five years, Workday grew its sales at a 17.2% compounded annual growth rate. Though this growth is acceptable on an absolute basis, we need to see more than just topline growth for the software sector, which can display significant earnings volatility. This means our bar for the sector is particularly high, reflecting the non-essential and hit-driven nature of the products and services offered. Additionally, five-year CAGR starts around Covid, when revenue was depressed then rebounded.
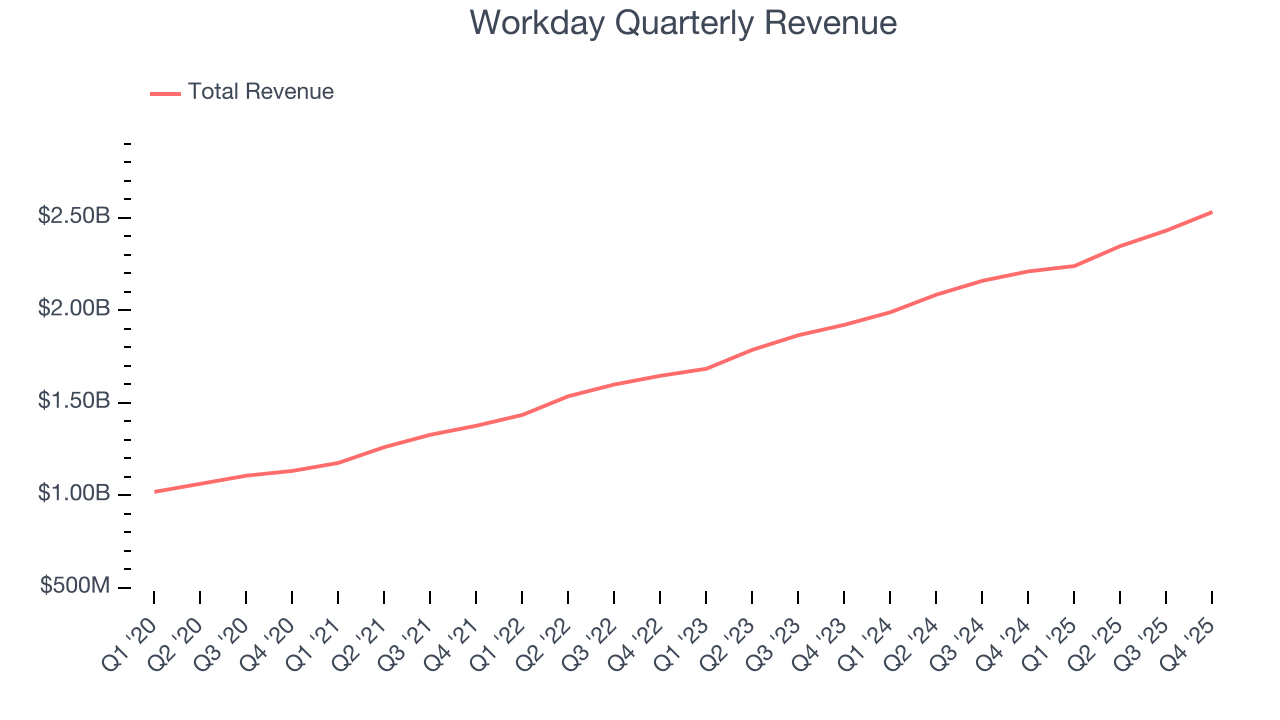
Long-term growth is the most important, but within software, a half-decade historical view may miss new innovations or demand cycles. Workday’s recent performance shows its demand has slowed as its annualized revenue growth of 14.7% over the last two years was below its five-year trend. We’re wary when companies in the sector see decelerations in revenue growth, as it could signal changing consumer tastes aided by low switching costs. 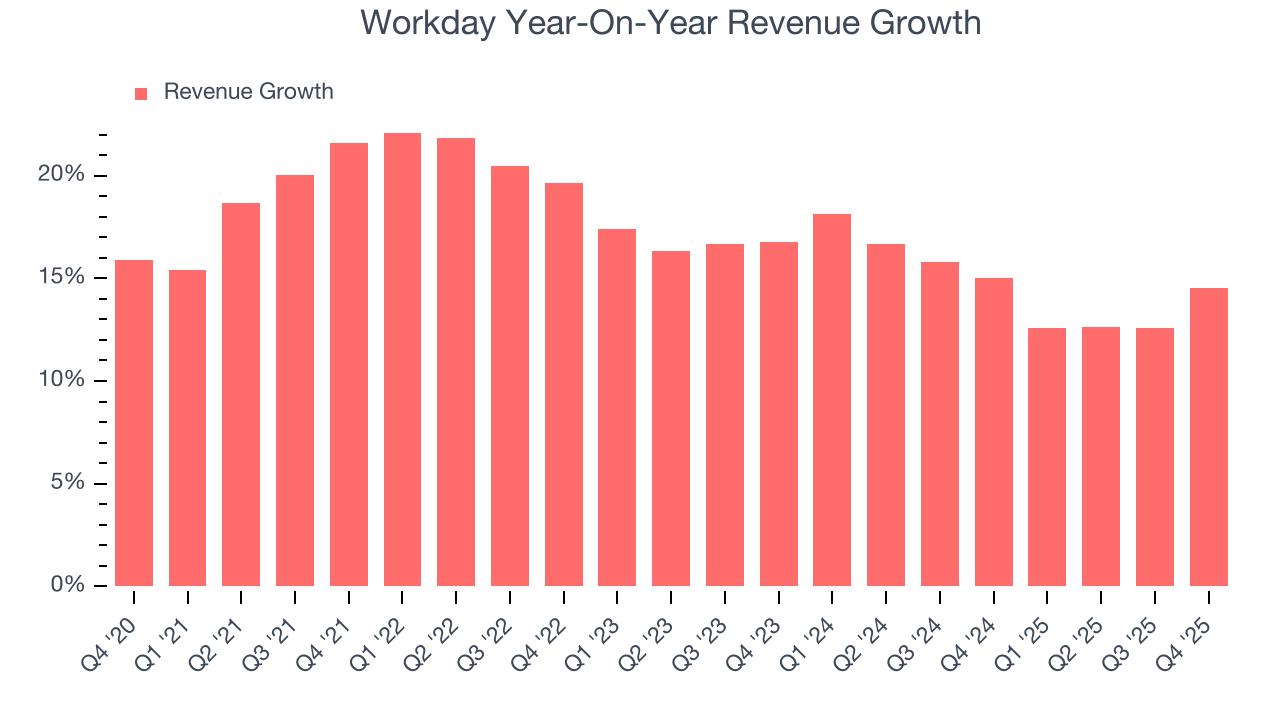
This quarter, Workday’s year-on-year revenue growth was 14.5%, and its $2.53 billion of revenue was in line with Wall Street’s estimates.
Looking ahead, sell-side analysts expect revenue to grow 12.1% over the next 12 months, a slight deceleration versus the last two years. This projection doesn't excite us and indicates its products and services will face some demand challenges.
6. Billings
Billings is a non-GAAP metric that is often called “cash revenue” because it shows how much money the company has collected from customers in a certain period. This is different from revenue, which must be recognized in pieces over the length of a contract.
Workday’s billings came in at $3.66 billion in Q4, and over the last four quarters, its growth slightly lagged the sector as it averaged 13.2% year-on-year increases. This performance mirrored its total sales and suggests that increasing competition is causing challenges in acquiring/retaining customers. 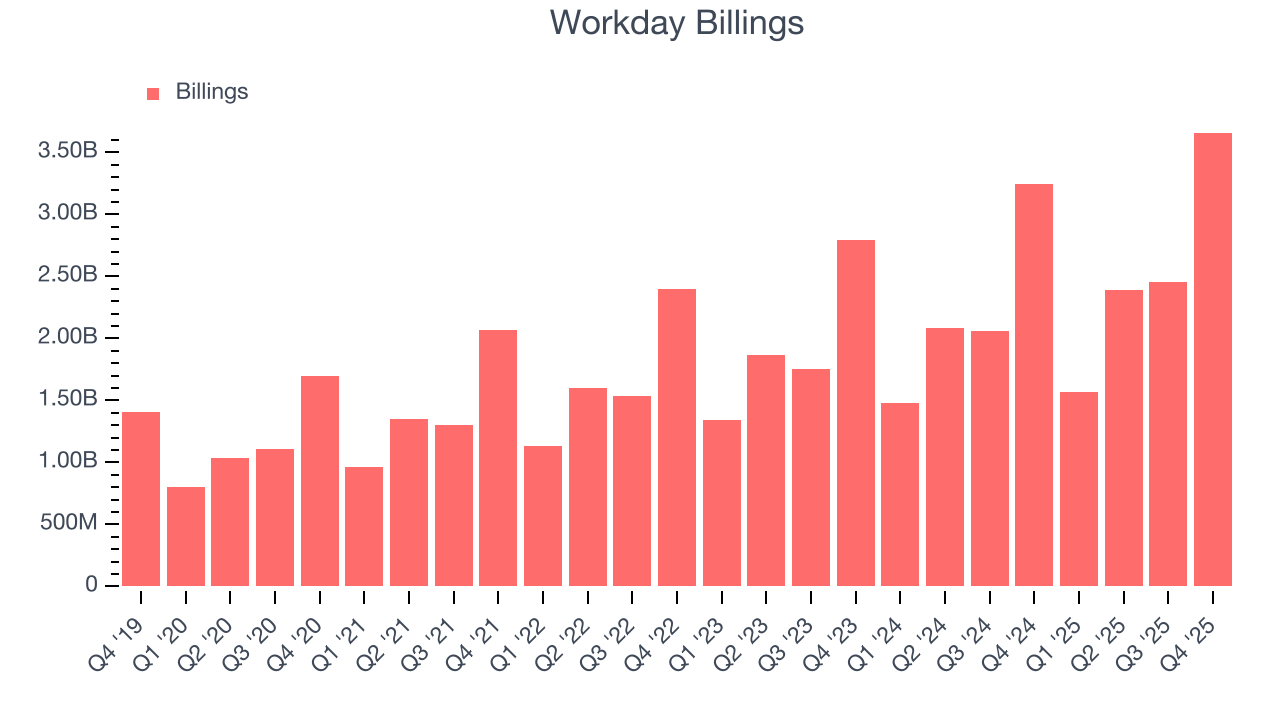
7. Customer Acquisition Efficiency
The customer acquisition cost (CAC) payback period represents the months required to recover the cost of acquiring a new customer. Essentially, it’s the break-even point for sales and marketing investments. A shorter CAC payback period is ideal, as it implies better returns on investment and business scalability.
Workday is efficient at acquiring new customers, and its CAC payback period checked in at 41.4 months this quarter. The company’s relatively fast recovery of its customer acquisition costs means it can attempt to spur growth by increasing its sales and marketing investments. 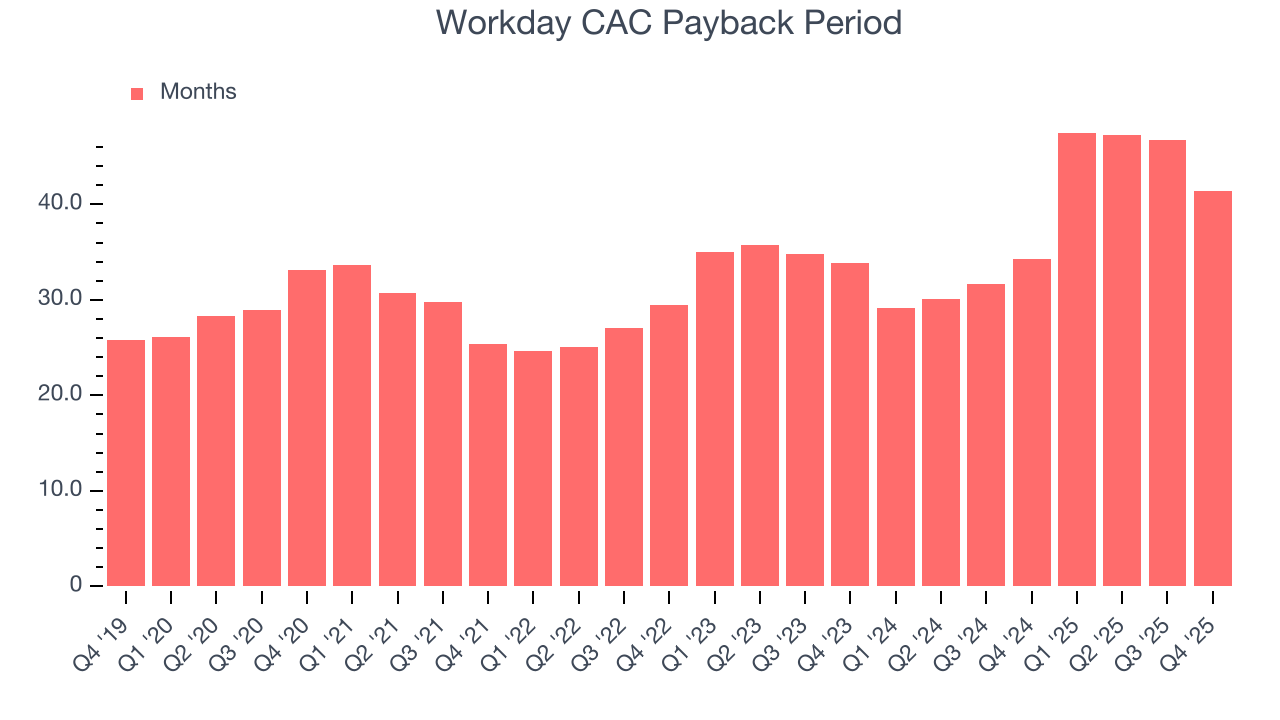
8. Gross Margin & Pricing Power
For software companies like Workday, gross profit tells us how much money remains after paying for the base cost of products and services (typically servers, licenses, and certain personnel). These costs are usually low as a percentage of revenue, explaining why software is more lucrative than other sectors.
Workday’s gross margin is good for a software business and points to its solid unit economics, competitive products and services, and lack of meaningful pricing pressure. As you can see below, it averaged an impressive 75.7% gross margin over the last year. Said differently, Workday paid its providers $24.30 for every $100 in revenue.
The market not only cares about gross margin levels but also how they change over time because expansion creates firepower for profitability and free cash generation. Workday has seen gross margins improve by 0.1 percentage points over the last 2 year, which is slightly better than average for software.
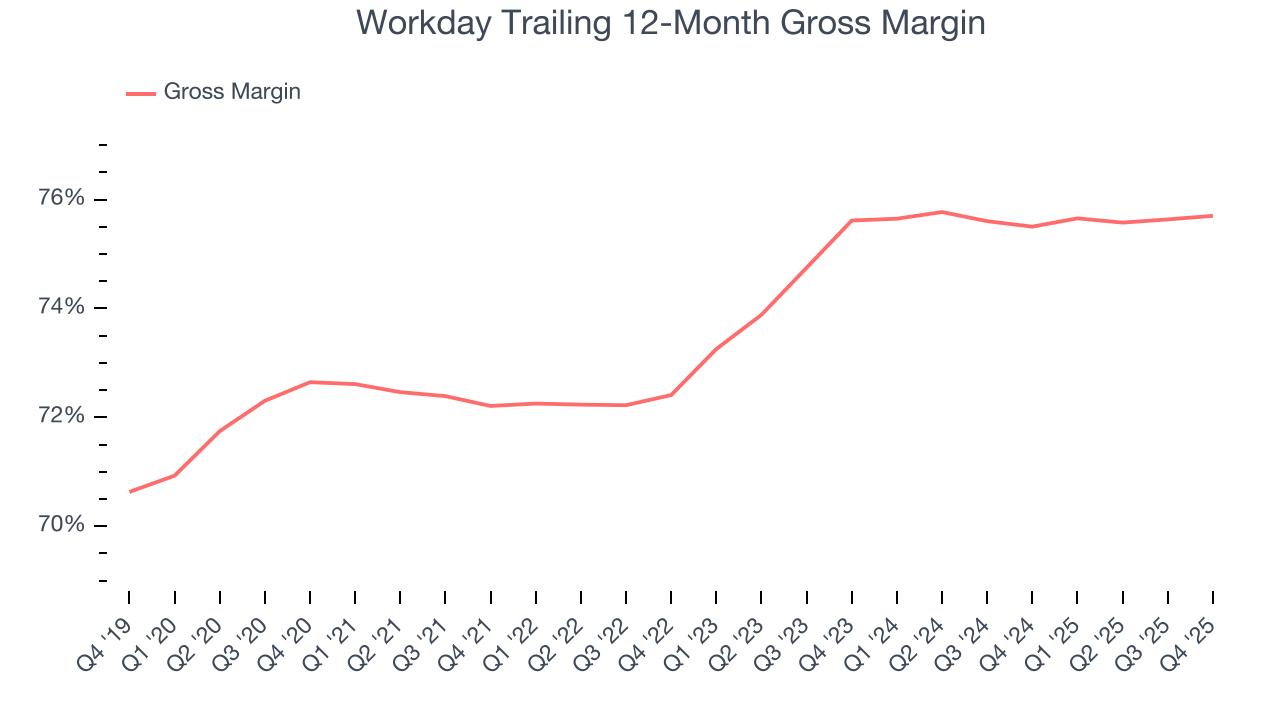
Workday’s gross profit margin came in at 75.9% this quarter, in line with the same quarter last year. Zooming out, the company’s full-year margin has remained steady over the past 12 months, suggesting its input costs have been stable and it isn’t under pressure to lower prices.
9. Operating Margin
Workday has managed its cost base well over the last year. It demonstrated solid profitability for a software business, producing an average operating margin of 7.5%. This result isn’t too surprising as its gross margin gives it a favorable starting point.
Analyzing the trend in its profitability, Workday’s operating margin rose by 2.6 percentage points over the last two years, as its sales growth gave it operating leverage.
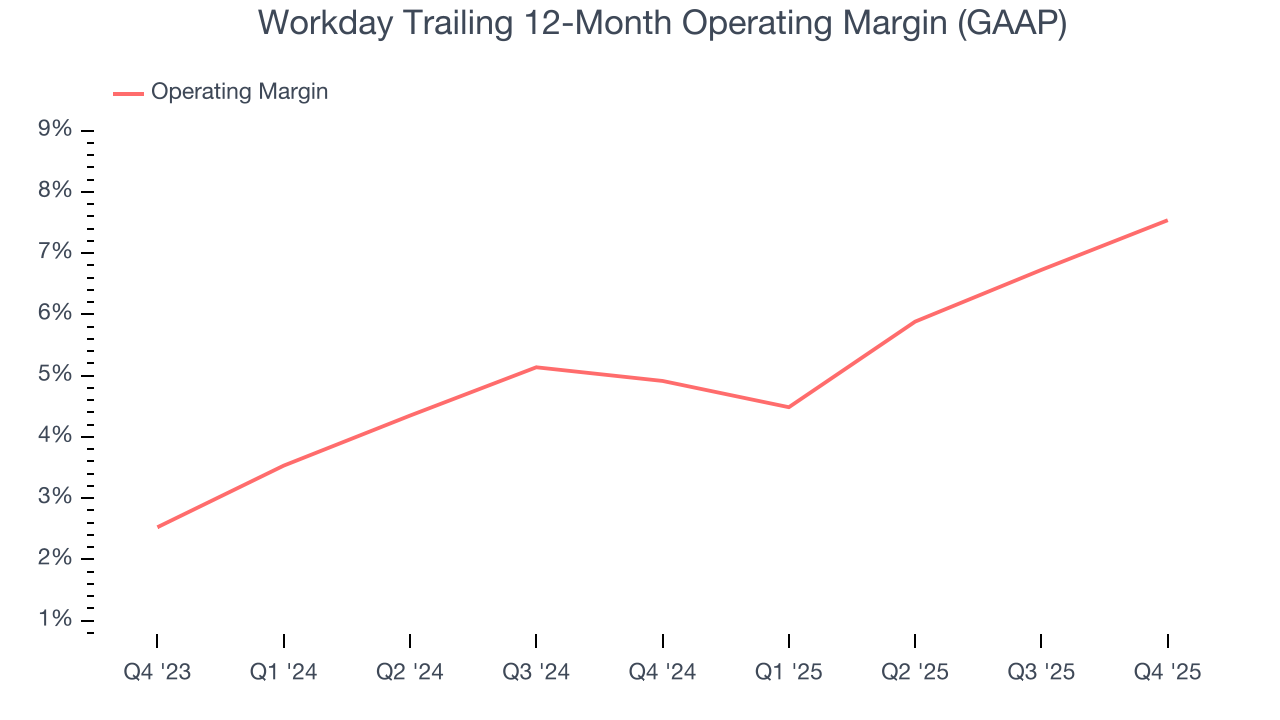
In Q4, Workday generated an operating margin profit margin of 6.9%, up 3.5 percentage points year on year. The increase was encouraging, and because its operating margin rose more than its gross margin, we can infer it was more efficient with expenses such as marketing, R&D, and administrative overhead.
10. Cash Is King
If you’ve followed StockStory for a while, you know we emphasize free cash flow. Why, you ask? We believe that in the end, cash is king, and you can’t use accounting profits to pay the bills.
Workday has shown robust cash profitability, driven by its attractive business model and cost-effective customer acquisition strategy that enable it to invest in new products and services rather than sales and marketing. The company’s free cash flow margin averaged 29.1% over the last year, quite impressive for a software business.
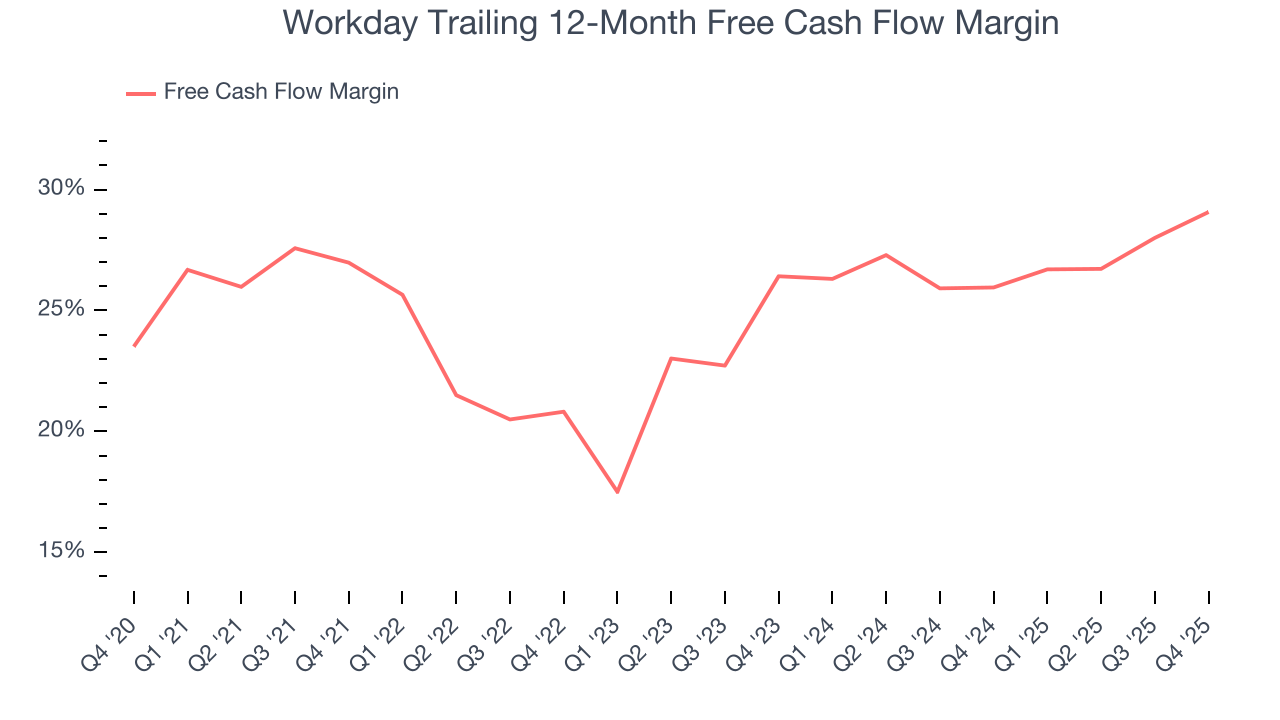
Workday’s free cash flow clocked in at $1.22 billion in Q4, equivalent to a 48.1% margin. This result was good as its margin was 1.7 percentage points higher than in the same quarter last year, but we wouldn’t read too much into the short term because investment needs can be seasonal, causing temporary swings. Long-term trends carry greater meaning.
Over the next year, analysts predict Workday’s cash conversion will slightly improve. Their consensus estimates imply its free cash flow margin of 29.1% for the last 12 months will increase to 30.7%, giving it more flexibility for investments, share buybacks, and dividends.
11. Balance Sheet Assessment
Companies with more cash than debt have lower bankruptcy risk.
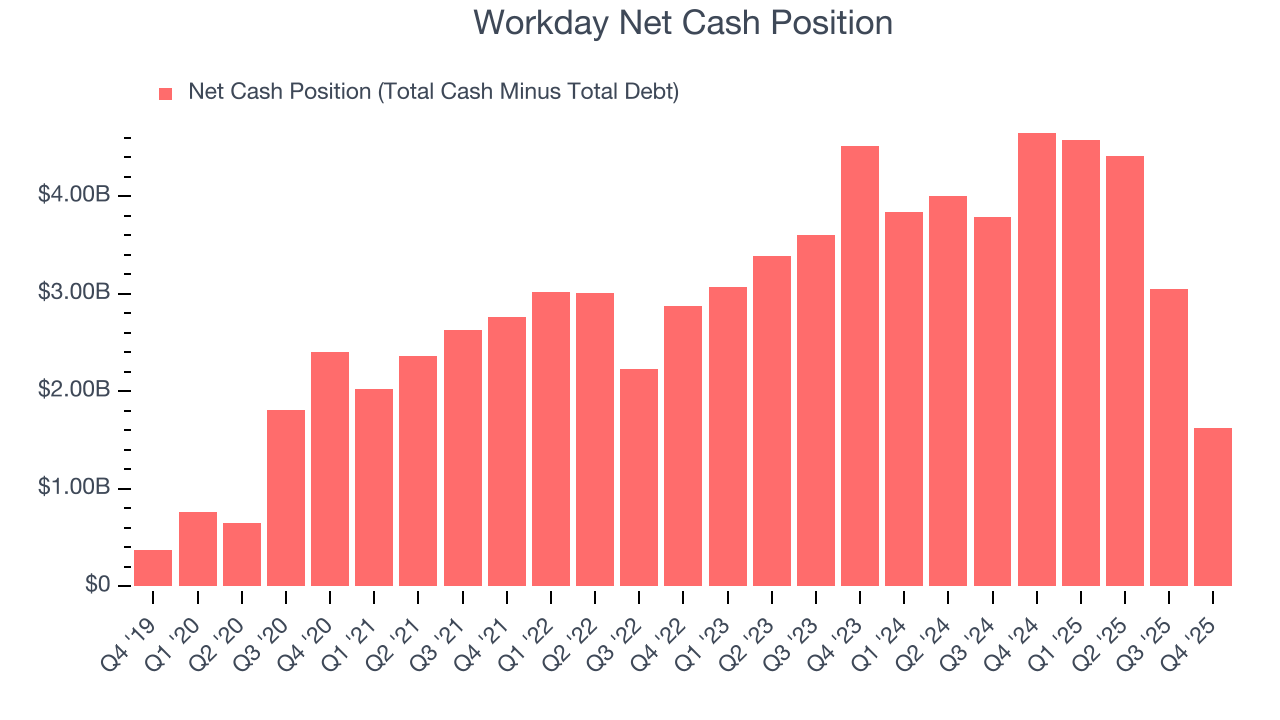
Workday is a profitable, well-capitalized company with $5.44 billion of cash and $3.82 billion of debt on its balance sheet. This $1.62 billion net cash position is 4.6% of its market cap and gives it the freedom to borrow money, return capital to shareholders, or invest in growth initiatives. Leverage is not an issue here.
12. Key Takeaways from Workday’s Q4 Results
It was good to see Workday narrowly top analysts’ billings expectations this quarter. On the other hand, both Q1 and full-year subscription revenue growth guidance fell short of expectations. This is weighing on shares, especially because the market is skittish regarding software stocks. Shares traded down 7.8% to $120.21 immediately following the results.
13. Is Now The Time To Buy Workday?
Updated: March 19, 2026 at 10:10 PM EDT
We think that the latest earnings result is only one piece of the bigger puzzle. If you’re deciding whether to own Workday, you should also grasp the company’s longer-term business quality and valuation.
Workday’s business quality ultimately falls short of our standards. To begin with, its revenue growth was mediocre over the last five years, and analysts expect its demand to deteriorate over the next 12 months. While its bountiful generation of free cash flow empowers it to invest in growth initiatives, the downside is its expanding operating margin shows it’s becoming more efficient at building and selling its software. On top of that, its ARR has disappointed and shows the company is having difficulty retaining customers and their spending.
Workday’s price-to-sales ratio based on the next 12 months is 3.3x. While this valuation is fair, the upside isn’t great compared to the potential downside. We're pretty confident there are superior stocks to buy right now.
Wall Street analysts have a consensus one-year price target of $181.31 on the company (compared to the current share price of $133.71).
Although the price target is bullish, readers should exercise caution because analysts tend to be overly optimistic. The firms they work for, often big banks, have relationships with companies that extend into fundraising, M&A advisory, and other rewarding business lines. As a result, they typically hesitate to say bad things for fear they will lose out. We at StockStory do not suffer from such conflicts of interest, so we’ll always tell it like it is.