
WSFS Financial (WSFS)
WSFS Financial doesn’t impress us. It’s recently struggled to grow its revenue, a worrying sign for investors seeking high-quality stocks.― StockStory Analyst Team
1. News


2. Summary
Why WSFS Financial Is Not Exciting
Founded in 1832 as Wilmington Savings Fund Society and one of the oldest banks in America still operating under its original name, WSFS Financial (NASDAQ:WSFS) operates a community banking and wealth management franchise primarily serving customers in the Mid-Atlantic region through its main subsidiary, WSFS Bank.
- Net interest income is projected to tank by 6.9% over the next 12 months as demand evaporates
- Estimated tangible book value per share growth of 11.4% for the next 12 months implies profitability will slow from its two-year trend
- A consolation is that its incremental sales over the last five years have been highly profitable as its earnings per share increased by 22.1% annually, topping its revenue gains


WSFS Financial is skating on thin ice. We’re on the lookout for more interesting opportunities.
Why There Are Better Opportunities Than WSFS Financial


At $62.91 per share, WSFS Financial trades at 1.1x forward P/B. We acknowledge that the current valuation is justified, but we’re passing on this stock for the time being.
There are stocks out there featuring similar valuation multiples with better fundamentals. We prefer to invest in those.
3. WSFS Financial (WSFS) Research Report: Q4 CY2025 Update
Regional banking company WSFS Financial (NASDAQ:WSFS) reported Q4 CY2025 results beating Wall Street’s revenue expectations, with sales up 3.8% year on year to $271.9 million. Its GAAP profit of $1.34 per share was 9.1% above analysts’ consensus estimates.
WSFS Financial (WSFS) Q4 CY2025 Highlights:
- Net Interest Income: $187.4 million vs analyst estimates of $180.6 million (5.1% year-on-year growth, 3.8% beat)
- Net Interest Margin: 3.8% vs analyst estimates of 3.8% (2.2 basis point beat)
- Revenue: $271.9 million vs analyst estimates of $267 million (3.8% year-on-year growth, 1.8% beat)
- Efficiency Ratio: 59.5% vs analyst estimates of 61.6% (218.8 basis point beat)
- EPS (GAAP): $1.34 vs analyst estimates of $1.23 (9.1% beat)
- Tangible Book Value per Share: $33.11 vs analyst estimates of $32.90 (20.9% year-on-year growth, 0.6% beat)
- Market Capitalization: $3.16 billion
Company Overview
Founded in 1832 as Wilmington Savings Fund Society and one of the oldest banks in America still operating under its original name, WSFS Financial (NASDAQ:WSFS) operates a community banking and wealth management franchise primarily serving customers in the Mid-Atlantic region through its main subsidiary, WSFS Bank.
WSFS Financial conducts business through three main segments: traditional banking, cash management services, and wealth management. The banking segment forms the core of its operations, offering commercial, residential, and consumer loans alongside various deposit products through both physical branches and digital platforms. Its commercial lending focuses on businesses in Delaware and Pennsylvania, while its consumer lending includes home equity products, personal loans, and student loans—some originated through partnerships with fintech companies like Upstart and LendKey.
The Cash Connect segment provides specialized services for ATMs and smart safes nationwide. This includes supplying cash for non-bank ATMs, cash logistics, and management services for businesses that use smart safes to securely store and process cash. This division leverages WSFS's expertise in cash handling to serve clients beyond its traditional banking footprint.
In wealth management, WSFS operates primarily under the Bryn Mawr Trust brand, offering investment management, trust services, and financial planning to affluent individuals and institutions. For example, a high-net-worth family might use WSFS's Powdermill subsidiary for comprehensive family office services, including investment management, estate planning, and trust administration. The company also provides specialized services like Delaware advantage trusts through its non-depository trust company subsidiary.
WSFS generates revenue through interest on loans, fees from wealth management services, and service charges on deposit accounts and cash management services. The company has expanded its geographic presence through acquisitions, most notably its purchase of Beneficial Bancorp in 2019 and Bryn Mawr Bank Corporation in 2022.
4. Regional Banks
Regional banks, financial institutions operating within specific geographic areas, serve as intermediaries between local depositors and borrowers. They benefit from rising interest rates that improve net interest margins (the difference between loan yields and deposit costs), digital transformation reducing operational expenses, and local economic growth driving loan demand. However, these banks face headwinds from fintech competition, deposit outflows to higher-yielding alternatives, credit deterioration (increasing loan defaults) during economic slowdowns, and regulatory compliance costs. Recent concerns about regional bank stability following high-profile failures and significant commercial real estate exposure present additional challenges.
WSFS Financial competes with other regional banks in the Mid-Atlantic region including M&T Bank (NYSE:MTB), Citizens Financial Group (NYSE:CFG), and Fulton Financial (NASDAQ:FULT), as well as larger national banks like JPMorgan Chase (NYSE:JPM) and Bank of America (NYSE:BAC) that operate in its markets.
5. Sales Growth
Two primary revenue streams drive bank earnings. While net interest income, which is earned by charging higher rates on loans than paid on deposits, forms the foundation, fee-based services across banking, credit, wealth management, and trading operations provide additional income. Over the last five years, WSFS Financial grew its revenue at a decent 11% compounded annual growth rate. Its growth was slightly above the average banking company and shows its offerings resonate with customers.
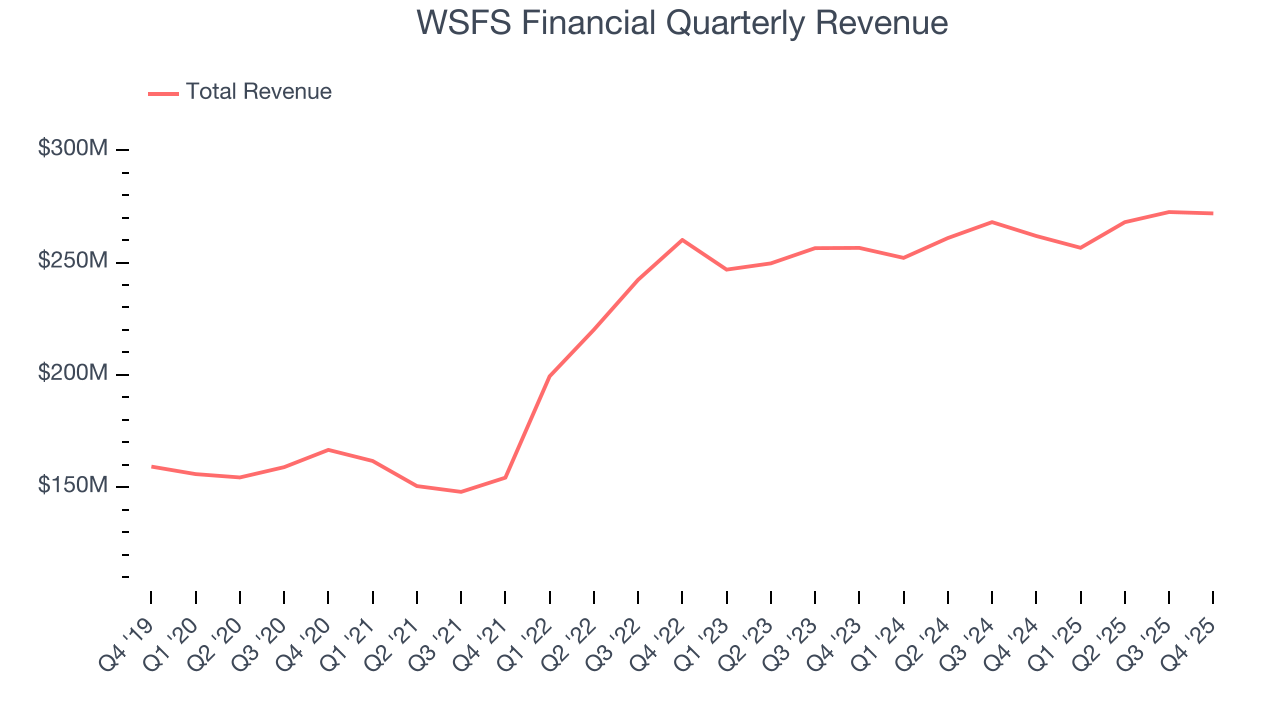
We at StockStory place the most emphasis on long-term growth, but within financials, a half-decade historical view may miss recent interest rate changes, market returns, and industry trends. WSFS Financial’s recent performance shows its demand has slowed as its annualized revenue growth of 2.9% over the last two years was below its five-year trend. 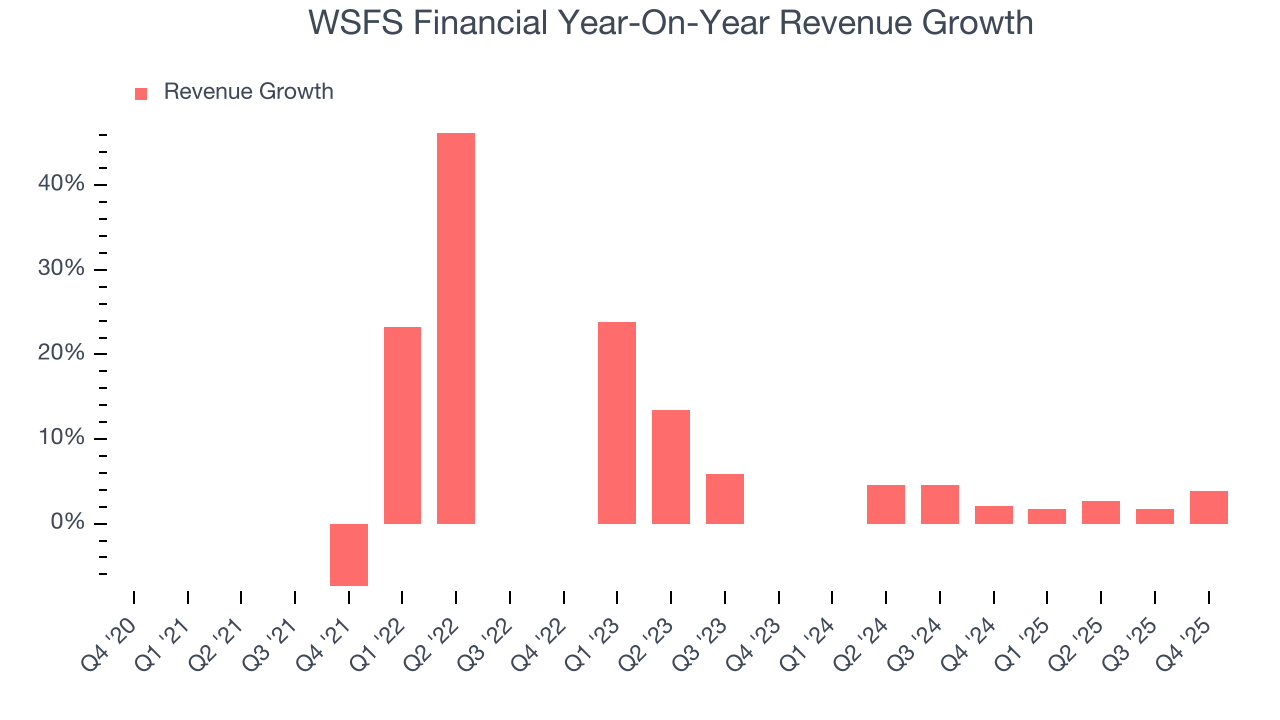 Note: Quarters not shown were determined to be outliers, impacted by outsized investment gains/losses that are not indicative of the recurring fundamentals of the business.
This quarter, WSFS Financial reported modest year-on-year revenue growth of 3.8% but beat Wall Street’s estimates by 1.8%.
Net interest income made up 70% of the company’s total revenue during the last five years, meaning lending operations are WSFS Financial’s largest source of revenue.
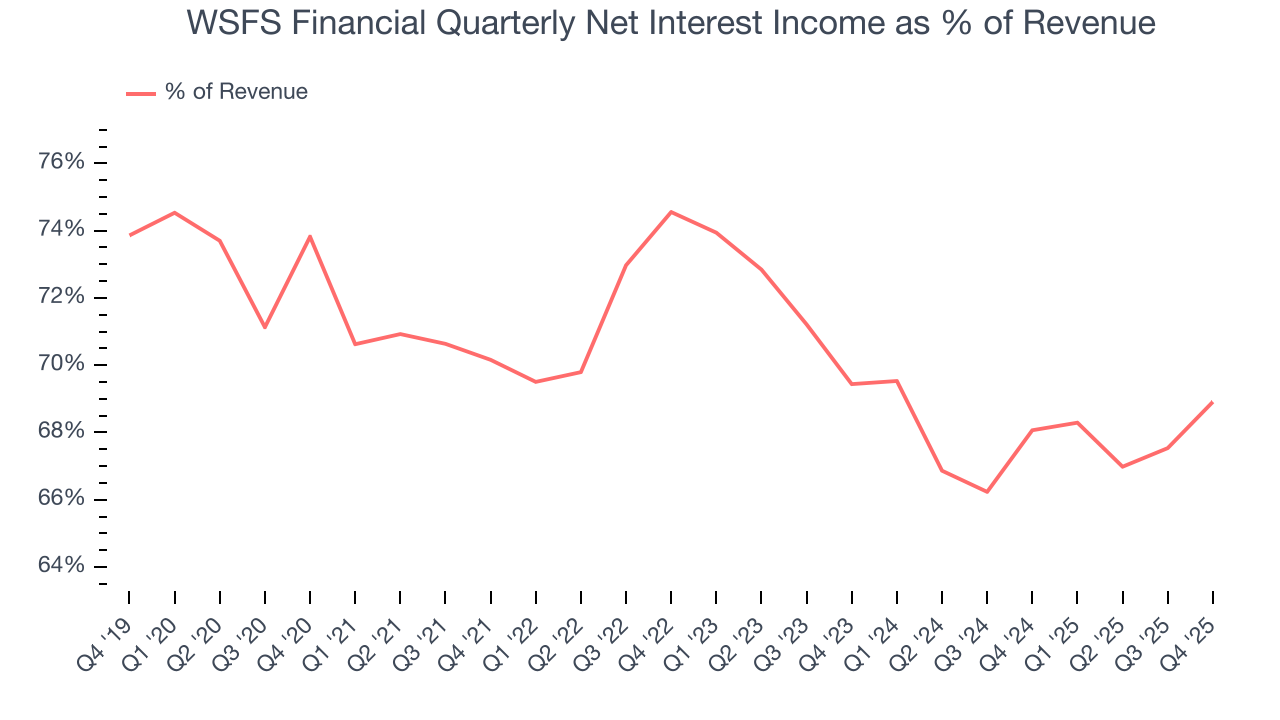
Markets consistently prioritize net interest income growth over fee-based revenue, recognizing its superior quality and recurring nature compared to the more unpredictable non-interest income streams.
6. Earnings Per Share
Revenue trends explain a company’s historical growth, but the long-term change in earnings per share (EPS) points to the profitability of that growth – for example, a company could inflate its sales through excessive spending on advertising and promotions.
WSFS Financial’s EPS grew at a spectacular 17.4% compounded annual growth rate over the last five years, higher than its 11% annualized revenue growth. This tells us the company became more profitable on a per-share basis as it expanded.
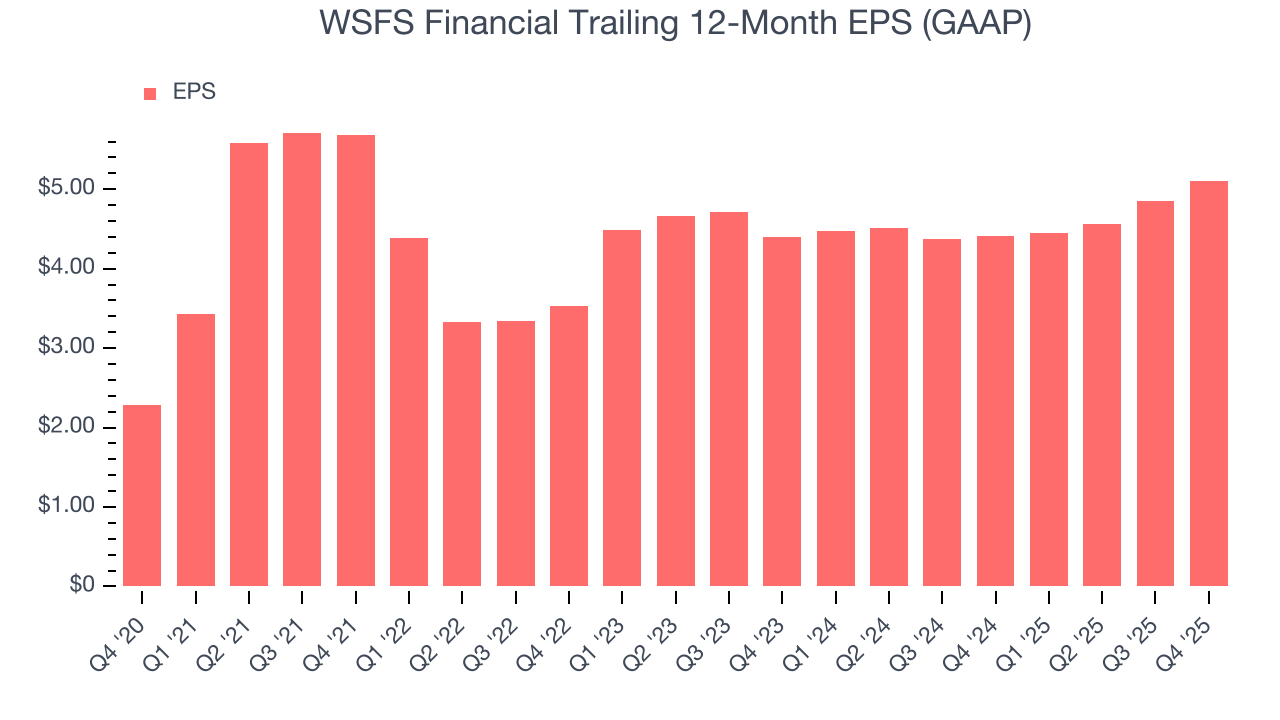
Like with revenue, we analyze EPS over a shorter period to see if we are missing a change in the business.
For WSFS Financial, its two-year annual EPS growth of 7.7% was lower than its five-year trend. We hope its growth can accelerate in the future.
In Q4, WSFS Financial reported EPS of $1.34, up from $1.09 in the same quarter last year. This print beat analysts’ estimates by 9.1%. Over the next 12 months, Wall Street expects WSFS Financial’s full-year EPS of $5.10 to stay about the same.
7. Tangible Book Value Per Share (TBVPS)
Banks operate as balance sheet businesses, with profits generated through borrowing and lending activities. Valuations reflect this reality, emphasizing balance sheet strength and long-term book value compounding ability.
When analyzing banks, tangible book value per share (TBVPS) takes precedence over many other metrics. This measure isolates genuine per-share value by removing intangible assets of debatable liquidation worth. Traditional metrics like EPS are helpful but face distortion from M&A activity and loan loss accounting rules.
WSFS Financial’s TBVPS grew at a decent 5% annual clip over the last five years. TBVPS growth has accelerated recently, growing by 16.4% annually over the last two years from $24.43 to $33.11 per share.
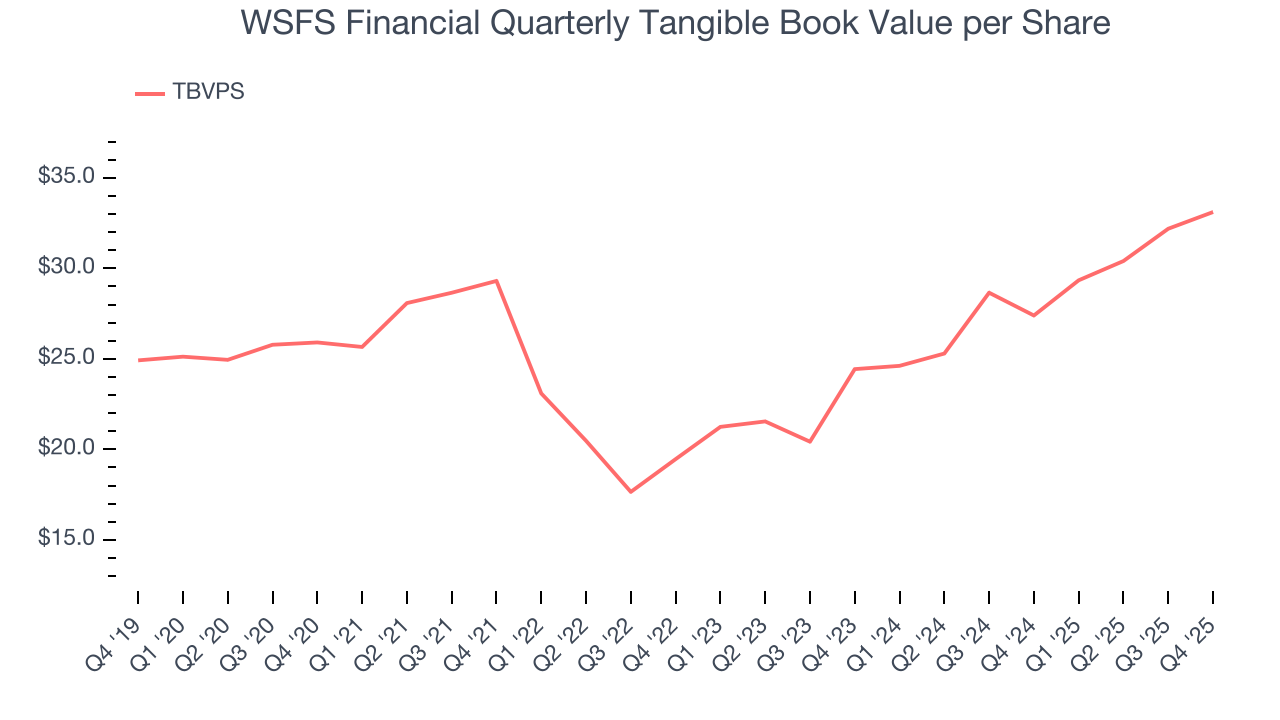
Over the next 12 months, Consensus estimates call for WSFS Financial’s TBVPS to grow by 10.2% to $36.49, mediocre growth rate.
8. Balance Sheet Assessment
Leverage is core to a financial firm’s business model (loans funded by deposits). To ensure economic stability and avoid a repeat of the 2008 GFC, regulators require certain levels of capital and liquidity, focusing on the Tier 1 capital ratio.
Tier 1 capital is the highest-quality capital that a firm holds, consisting primarily of common stock and retained earnings, but also physical gold. It serves as the primary cushion against losses and is the first line of defense in times of financial distress.
This capital is divided by risk-weighted assets to derive the Tier 1 capital ratio. Risk-weighted means that cash and US treasury securities are assigned little risk while unsecured consumer loans and equity investments get much higher risk weights, for example.
New regulation after the 2008 financial crisis requires that all firms must maintain a Tier 1 capital ratio greater than 4.5%. On top of this, there are additional buffers based on scale, risk profile, and other regulatory classifications, so that at the end of the day, firms generally must maintain a 7-10% ratio at minimum.
Over the last two years, WSFS Financial has averaged a Tier 1 capital ratio of 13.8%, which is considered safe and well capitalized in the event that macro or market conditions suddenly deteriorate.
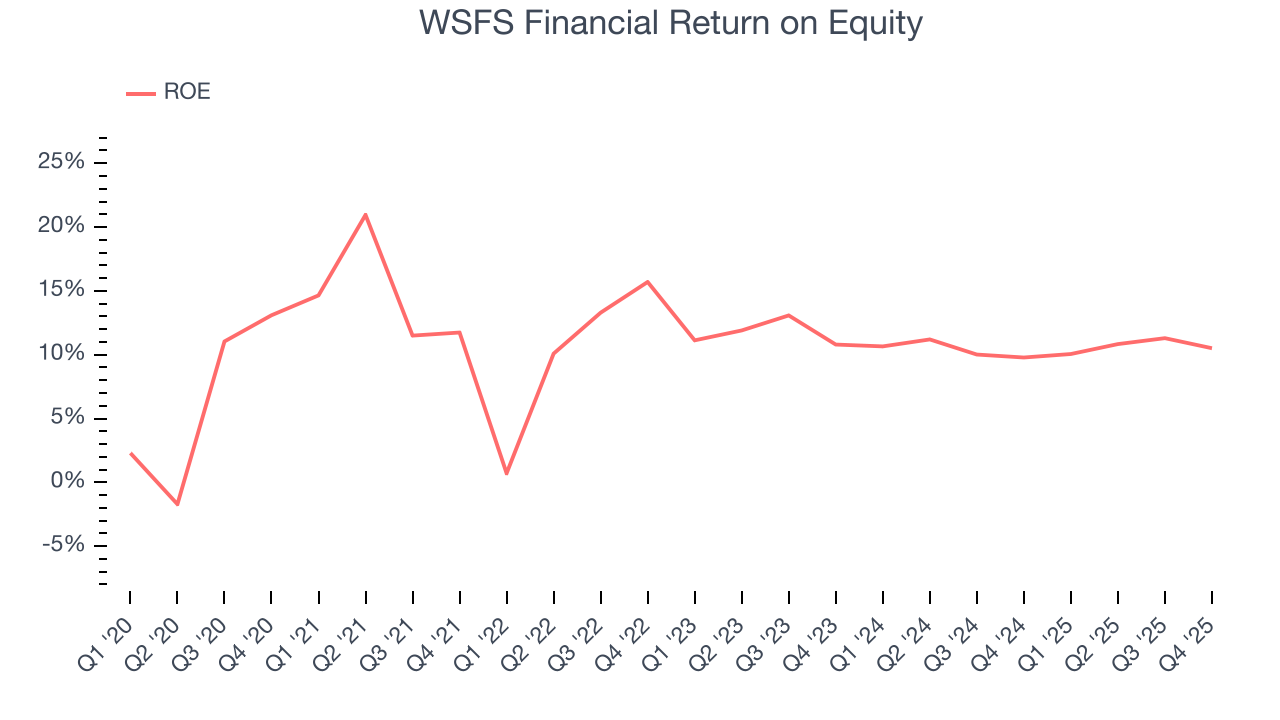
9. Return on Equity
Return on equity (ROE) measures how effectively banks generate profit from each dollar of shareholder equity - a critical funding source. High-ROE institutions typically compound shareholder wealth faster over time through retained earnings, share repurchases, and dividend payments.
Over the last five years, WSFS Financial has averaged an ROE of 11.5%, respectable for a company operating in a sector where the average shakes out around 7.5% and those putting up 15%+ are greatly admired.
10. Key Takeaways from WSFS Financial’s Q4 Results
We enjoyed seeing WSFS Financial beat analysts’ net interest income expectations this quarter. We were also happy its revenue outperformed Wall Street’s estimates. Overall, we think this was a solid quarter with some key areas of upside. The stock remained flat at $58.20 immediately after reporting.
11. Is Now The Time To Buy WSFS Financial?
Updated: March 13, 2026 at 12:51 AM EDT
Before making an investment decision, investors should account for WSFS Financial’s business fundamentals and valuation in addition to what happened in the latest quarter.
When it comes to WSFS Financial’s business quality, there are some positives, but it ultimately falls short. First off, its revenue growth was good over the last five years. And while WSFS Financial’s estimated net interest income for the next 12 months are weak, its astounding EPS growth over the last five years shows its profits are trickling down to shareholders.
WSFS Financial’s P/B ratio based on the next 12 months is 1.1x. This valuation is reasonable, but the company’s shakier fundamentals present too much downside risk. We're fairly confident there are better stocks to buy right now.
Wall Street analysts have a consensus one-year price target of $72.92 on the company (compared to the current share price of $62.91).