
Woodward (WWD)
Woodward is an exciting business. Its eye-popping 17.4% annualized EPS growth over the last five years has significantly outpaced its peers.― StockStory Analyst Team
1. News


2. Summary
Why We Like Woodward
Initially designing controls for water wheels in the early 1900s, Woodward (NASDAQ:WWD) designs, services, and manufactures energy control products and optimization solutions.
- Earnings per share have massively outperformed its peers over the last two years, increasing by 29.4% annually
- Annual revenue growth of 10.9% over the past two years was outstanding, reflecting market share gains this cycle
- Forecasted revenue growth of 10.5% for the next 12 months indicates its momentum over the last two years is sustainable


We’re optimistic about Woodward. This is one of our favorite industrials stocks.
Is Now The Time To Buy Woodward?


Woodward’s stock price of $353.60 implies a valuation ratio of 41.7x forward P/E. The lofty multiple means expectations are high for this company over the next six to twelve months.
If you like the company and believe the bull case, we suggest making it a smaller position as our analysis shows high-quality companies outperform the market over a multi-year period regardless of valuation.
3. Woodward (WWD) Research Report: Q4 CY2025 Update
Aerospace and defense company Woodward (NASDAQ:WWD) reported revenue ahead of Wall Streets expectations in Q4 CY2025, with sales up 29% year on year to $996.5 million. Its GAAP profit of $2.17 per share was 29.4% above analysts’ consensus estimates.
Woodward (WWD) Q4 CY2025 Highlights:
- Revenue: $996.5 million vs analyst estimates of $890.1 million (29% year-on-year growth, 11.9% beat)
- EPS (GAAP): $2.17 vs analyst estimates of $1.68 (29.4% beat)
- Adjusted EBITDA: $207.8 million vs analyst estimates of $167.8 million (20.9% margin, 23.9% beat)
- EPS (GAAP) guidance for the full year is $8.40 at the midpoint, beating analyst estimates by 3.5%
- Operating Margin: 17.9%, up from 11.6% in the same quarter last year
- Free Cash Flow Margin: 7.1%, up from 0.1% in the same quarter last year
- Market Capitalization: $19.63 billion
Company Overview
Initially designing controls for water wheels in the early 1900s, Woodward (NASDAQ:WWD) designs, services, and manufactures energy control products and optimization solutions.
Woodward was founded in 1870 to develop and manufacture the first successful water wheel governor. The company evolved to specialize in energy control and optimization solutions, becoming a key player in aerospace and industrial sectors. Over the decades, Woodward expanded its product line to include advanced control systems for turbines, aircraft engines, and industrial engines, leveraging innovations in fluid, motion, and combustion control. In the 20th century, Woodward's growth was propelled by significant contributions to military aviation during World War II, leading to a longstanding relationship with the aerospace industry.
Woodward's product offerings can logically be broken down into two categories: aerospace and industrial. For the aerospace sector, Woodward’s products range from propulsion and combustion control systems for aircraft to fluid and motion control solutions for critical aerospace and defense applications. For example, Woodward designs and manufactures fuel pumps and metering units that optimize the performance of aircraft engines by precisely managing fuel flow. These systems are integral to platforms like the Airbus A320neo and Boeing 737 MAX, as well as military applications including the F-35 fighter jets.
For the industrial sector, Woodward offers a wide range of control systems and equipment for large industrial machines. Its products include advanced control devices and powerful fuel and ignition systems, designed for machines that use both traditional and renewable energy sources. For example, Woodward's actuators are used in big industrial gas turbines to improve how efficiently they run by managing the flow of gas. These actuators are essential in power plants that use different types of gas turbines, helping to ensure these plants operate smoothly and effectively.
Woodward generates revenue primarily by selling to original equipment manufacturers (OEMs) in both its Aerospace and Industrial segments. In the Aerospace segment, revenue comes from supplying systems and components to OEMs, tier-one suppliers, and prime contractors, with additional revenue from aftermarket sales such as spare parts and replacements. Woodward also offers maintenance, repair, and overhaul services, catering to commercial airlines, military depots, and repair shops, enhancing the lifecycle and performance of aerospace systems. The company’s industrial sales are also complemented by aftermarket products and services provided to OEM customers, utilizing an independent network of distributors to reach a broader market and, occasionally, selling directly to end users.
4. Aerospace
Aerospace companies often possess technical expertise and have made significant capital investments to produce complex products. It is an industry where innovation is important, and lately, emissions and automation are in focus, so companies that boast advances in these areas can take market share. On the other hand, demand for aerospace products can ebb and flow with economic cycles and geopolitical tensions, which can be particularly painful for companies with high fixed costs.
Woodward’s peers and competitors include Moog (NYSE:MOG.A) and Collins Aerospace (NYSE:COL).
5. Revenue Growth
Examining a company’s long-term performance can provide clues about its quality. Any business can put up a good quarter or two, but the best consistently grow over the long haul. Over the last five years, Woodward grew its sales at a solid 10.4% compounded annual growth rate. Its growth beat the average industrials company and shows its offerings resonate with customers, a helpful starting point for our analysis.
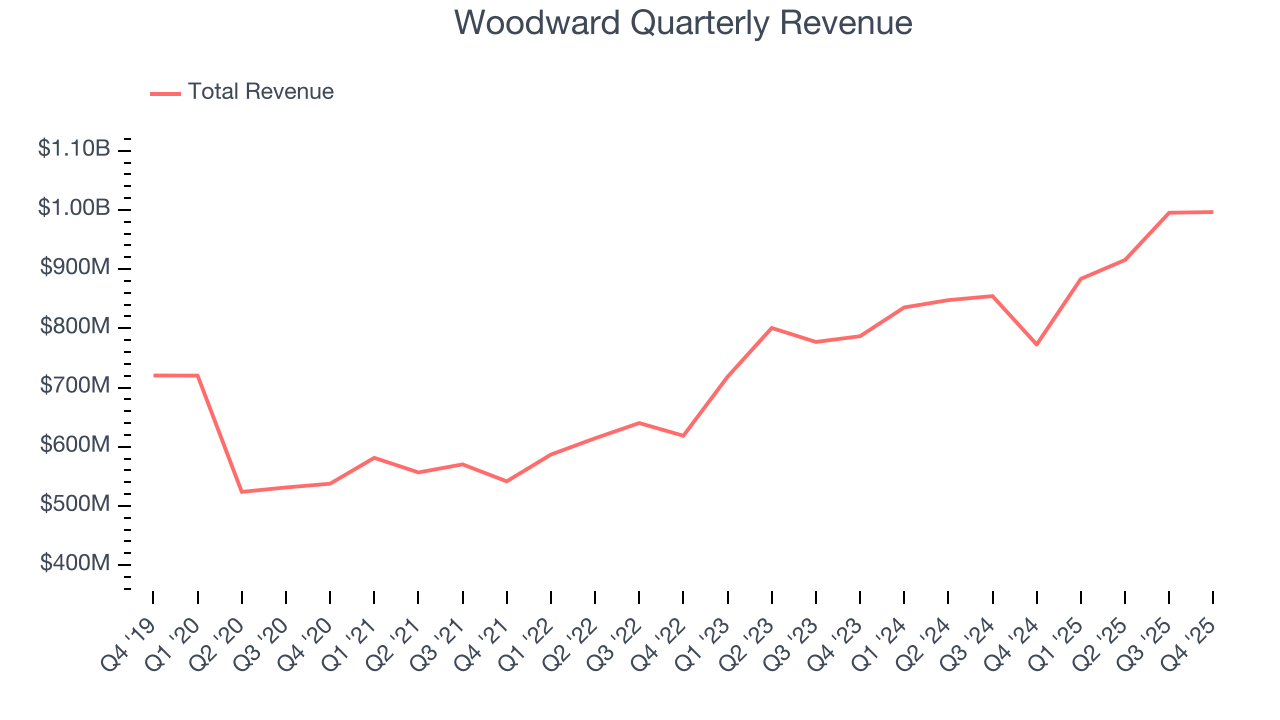
Long-term growth is the most important, but within industrials, a half-decade historical view may miss new industry trends or demand cycles. Woodward’s annualized revenue growth of 10.9% over the last two years aligns with its five-year trend, suggesting its demand was predictably strong. 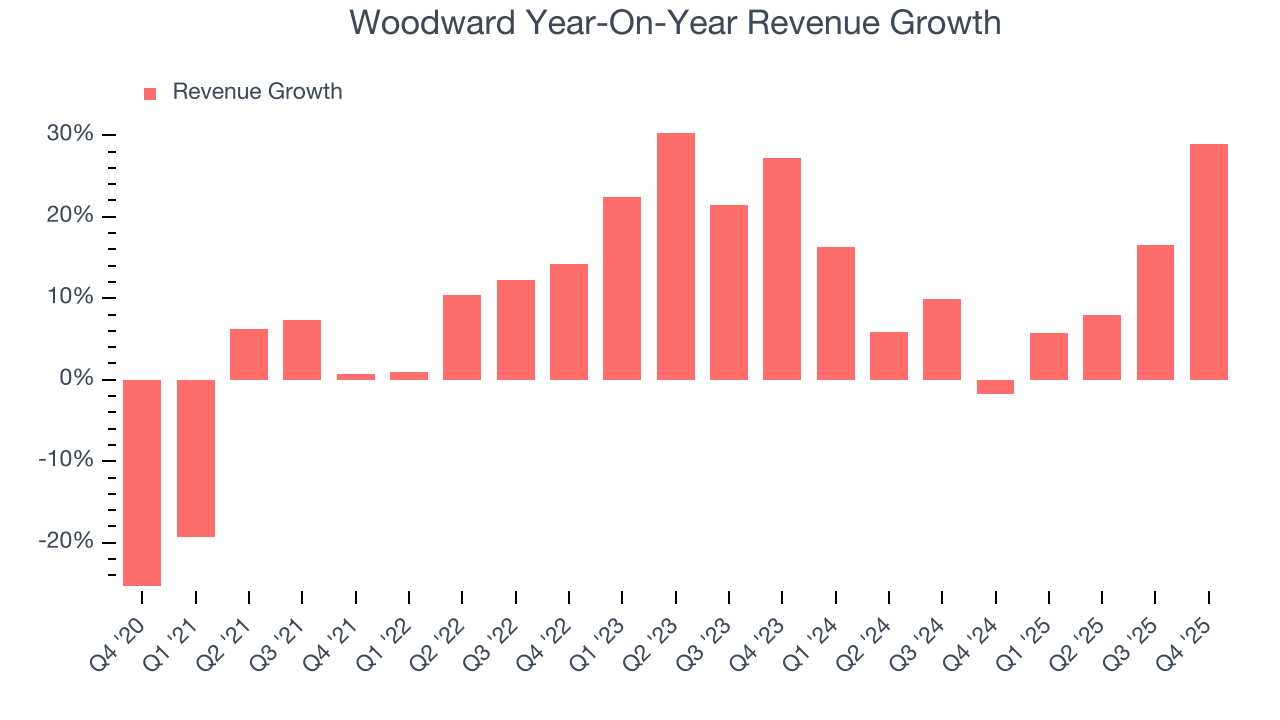
This quarter, Woodward reported robust year-on-year revenue growth of 29%, and its $996.5 million of revenue topped Wall Street estimates by 11.9%.
Looking ahead, sell-side analysts expect revenue to grow 6.4% over the next 12 months, a deceleration versus the last two years. This projection is underwhelming and indicates its products and services will see some demand headwinds. At least the company is tracking well in other measures of financial health.
6. Operating Margin
Woodward has managed its cost base well over the last five years. It demonstrated solid profitability for an industrials business, producing an average operating margin of 11.8%.
Looking at the trend in its profitability, Woodward’s operating margin rose by 4.8 percentage points over the last five years, as its sales growth gave it operating leverage.
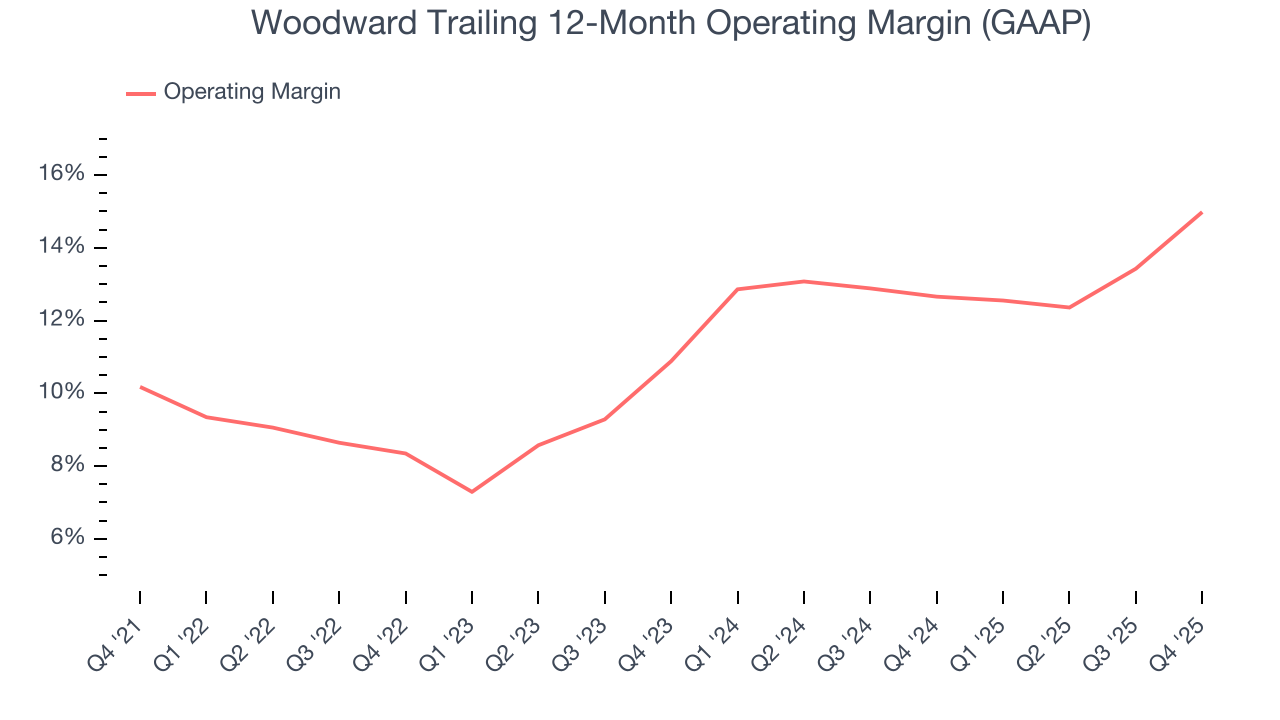
This quarter, Woodward generated an operating margin profit margin of 17.9%, up 6.3 percentage points year on year. This increase was a welcome development and shows it was more efficient.
7. Earnings Per Share
We track the long-term change in earnings per share (EPS) for the same reason as long-term revenue growth. Compared to revenue, however, EPS highlights whether a company’s growth is profitable.
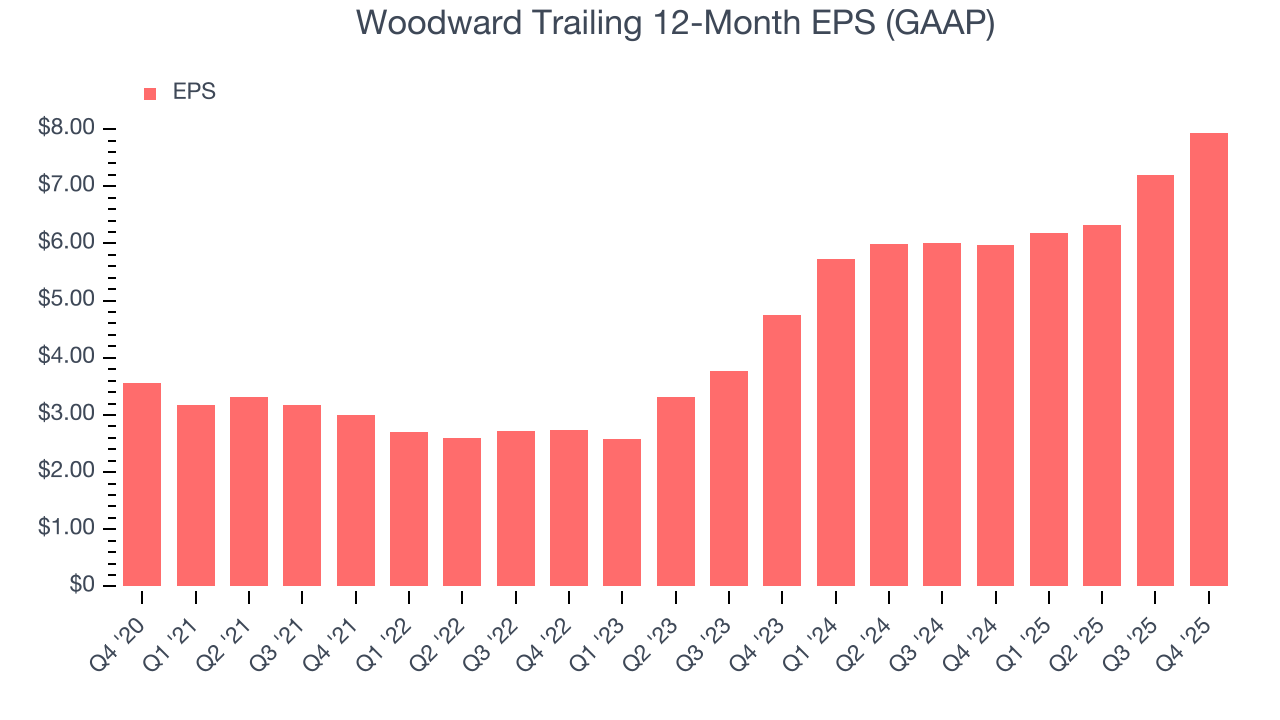
Woodward’s EPS grew at a spectacular 17.4% compounded annual growth rate over the last five years, higher than its 10.4% annualized revenue growth. This tells us the company became more profitable on a per-share basis as it expanded.
We can take a deeper look into Woodward’s earnings quality to better understand the drivers of its performance. As we mentioned earlier, Woodward’s operating margin expanded by 4.8 percentage points over the last five years. On top of that, its share count shrank by 5.1%. These are positive signs for shareholders because improving profitability and share buybacks turbocharge EPS growth relative to revenue growth. 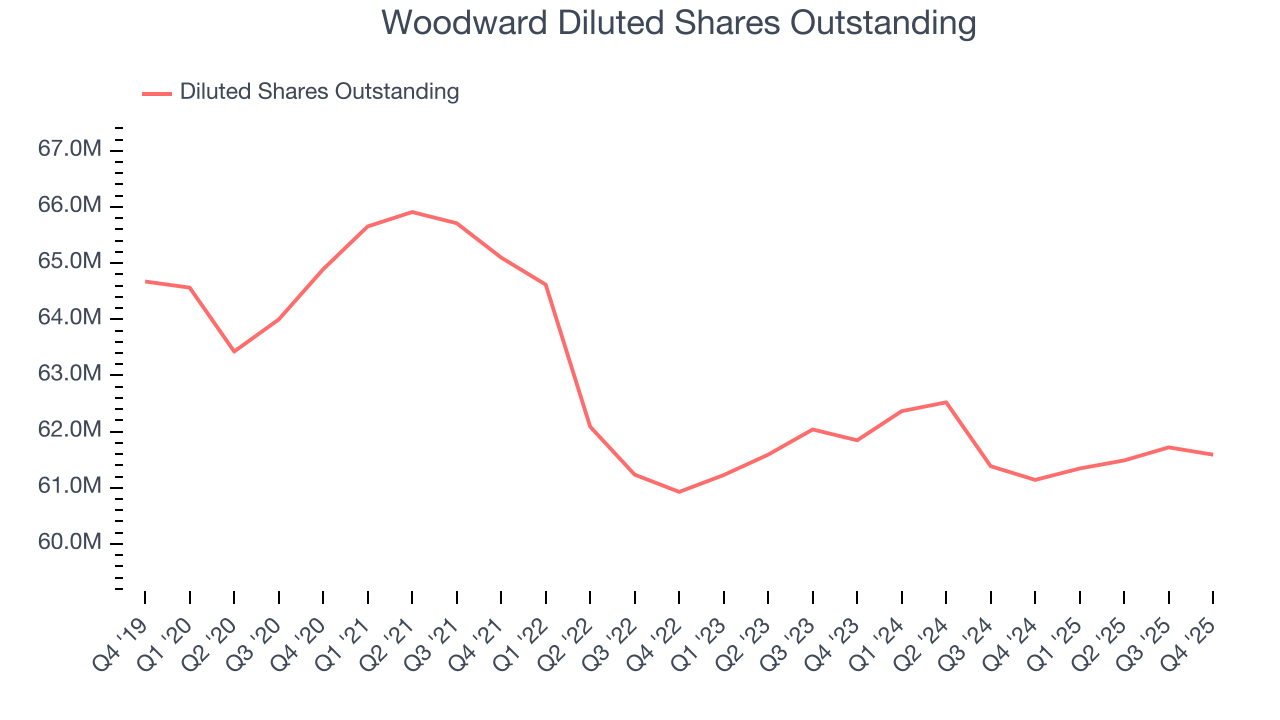
Like with revenue, we analyze EPS over a more recent period because it can provide insight into an emerging theme or development for the business.
For Woodward, its two-year annual EPS growth of 29.4% was higher than its five-year trend. We love it when earnings growth accelerates, especially when it accelerates off an already high base.
In Q4, Woodward reported EPS of $2.17, up from $1.42 in the same quarter last year. This print easily cleared analysts’ estimates, and shareholders should be content with the results. Over the next 12 months, Wall Street expects Woodward’s full-year EPS of $7.94 to grow 5.8%.
8. Cash Is King
Free cash flow isn't a prominently featured metric in company financials and earnings releases, but we think it's telling because it accounts for all operating and capital expenses, making it tough to manipulate. Cash is king.
Woodward has shown impressive cash profitability, enabling it to ride out cyclical downturns more easily while maintaining its investments in new and existing offerings. The company’s free cash flow margin averaged 9.5% over the last five years, better than the broader industrials sector.
Taking a step back, we can see that Woodward’s margin dropped by 3.1 percentage points during that time. If its declines continue, it could signal increasing investment needs and capital intensity.
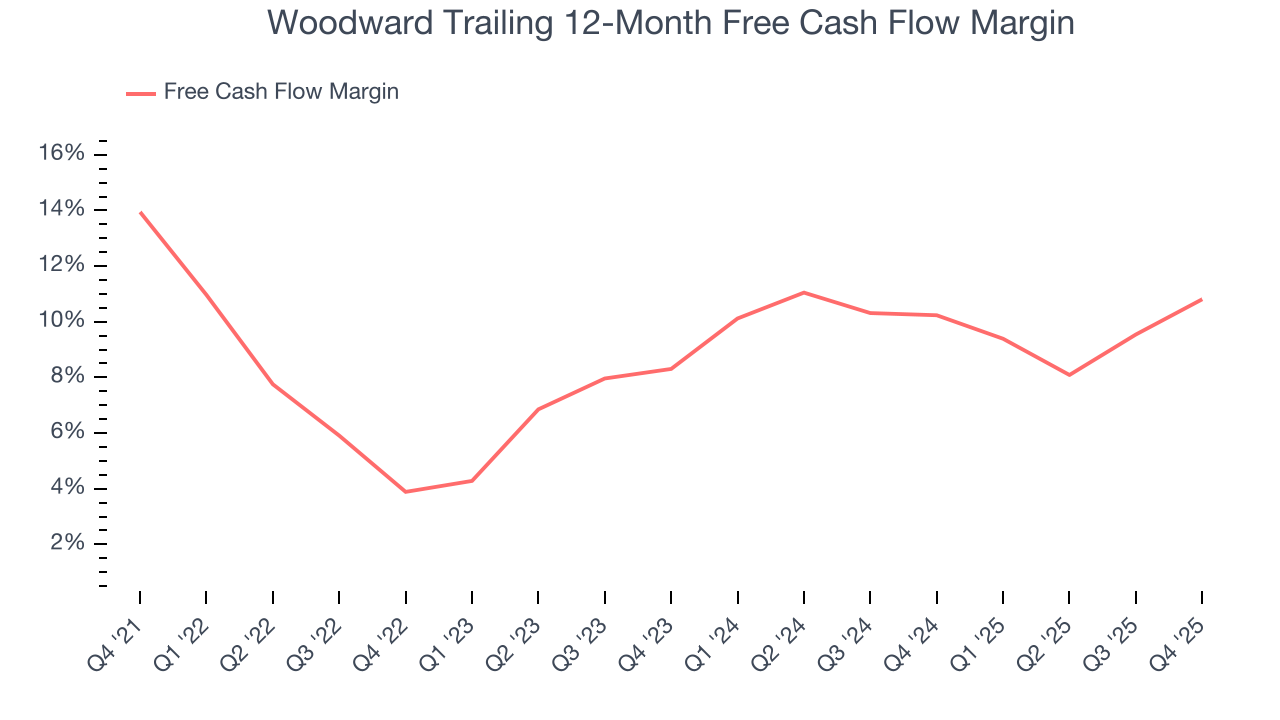
Woodward’s free cash flow clocked in at $70.31 million in Q4, equivalent to a 7.1% margin. This result was good as its margin was 6.9 percentage points higher than in the same quarter last year, but we note it was lower than its five-year cash profitability. Nevertheless, we wouldn’t read too much into a single quarter because investment needs can be seasonal, leading to short-term swings. Long-term trends trump temporary fluctuations.
9. Return on Invested Capital (ROIC)
EPS and free cash flow tell us whether a company was profitable while growing its revenue. But was it capital-efficient? Enter ROIC, a metric showing how much operating profit a company generates relative to the money it has raised (debt and equity).
Woodward’s management team makes decent investment decisions and generates value for shareholders. Its five-year average ROIC was 10.5%, slightly better than typical industrials business.
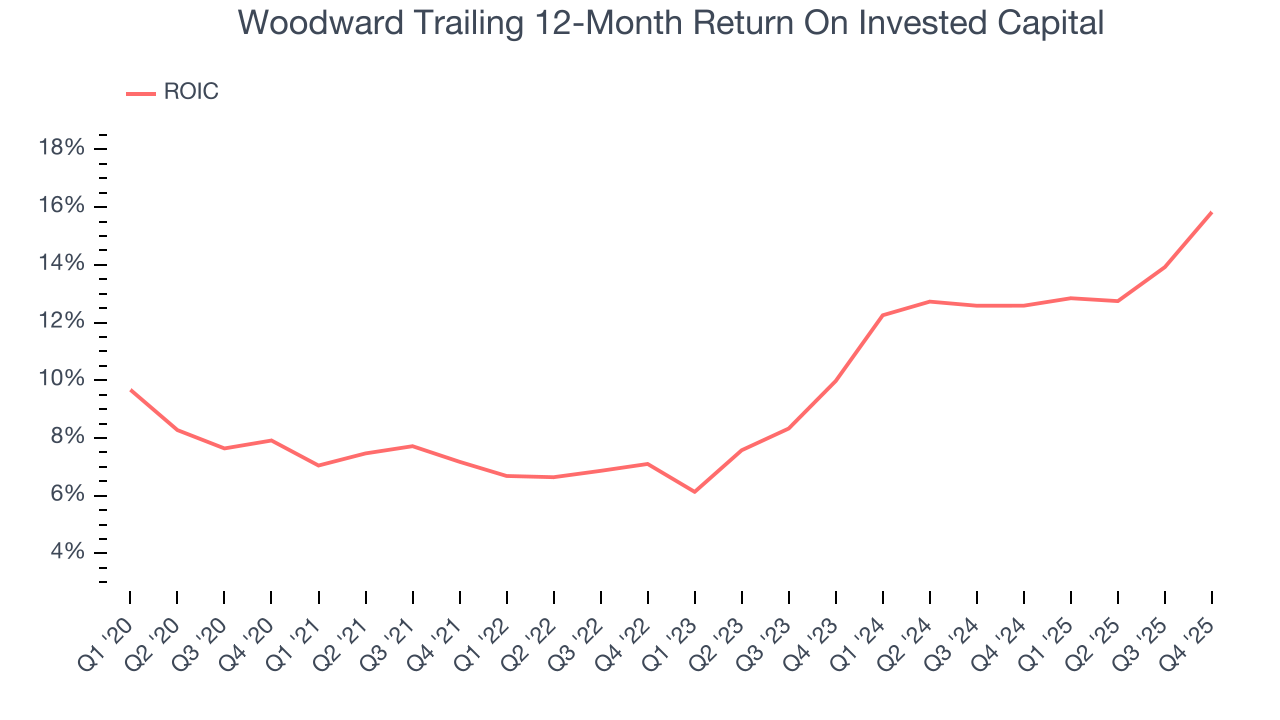
We like to invest in businesses with high returns, but the trend in a company’s ROIC is what often surprises the market and moves the stock price. Fortunately, Woodward’s has increased over the last few years. This is a great sign when paired with its already strong returns. It could suggest its competitive advantage or profitable growth opportunities are expanding.
10. Balance Sheet Assessment
Woodward reported $454.2 million of cash and $888 million of debt on its balance sheet in the most recent quarter. As investors in high-quality companies, we primarily focus on two things: 1) that a company’s debt level isn’t too high and 2) that its interest payments are not excessively burdening the business.
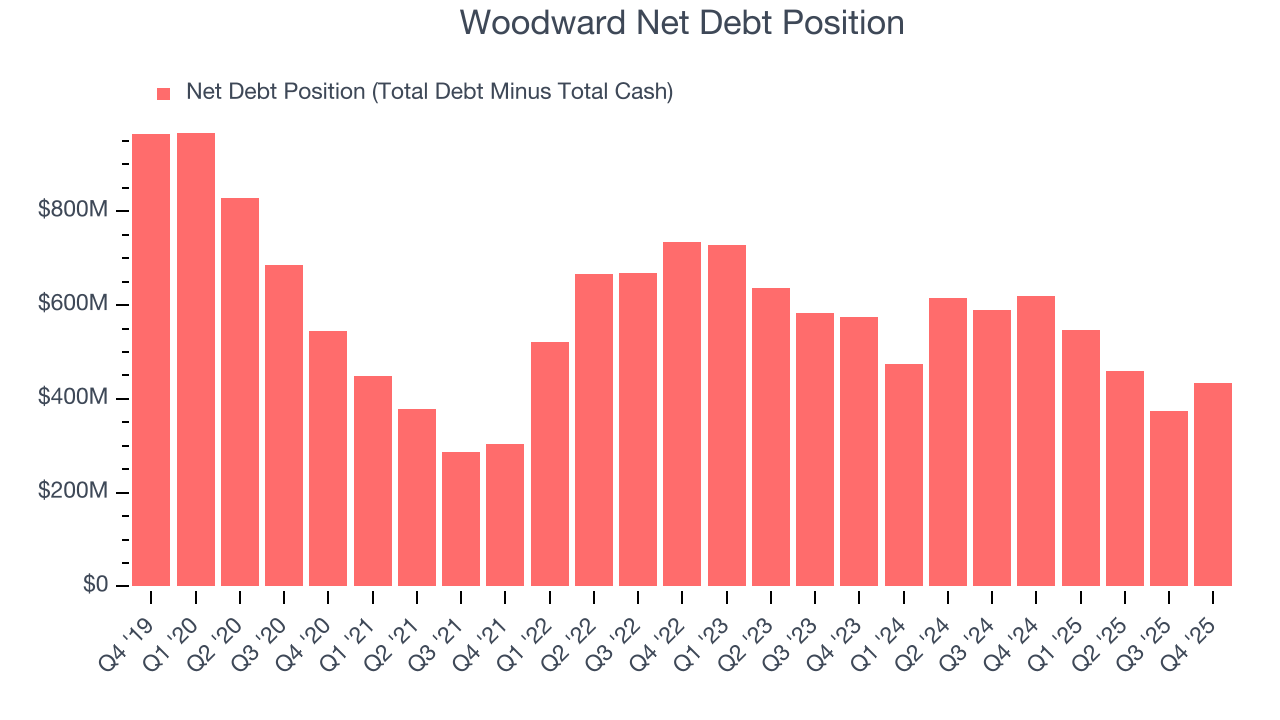
With $742.5 million of EBITDA over the last 12 months, we view Woodward’s 0.6× net-debt-to-EBITDA ratio as safe. We also see its $12.94 million of annual interest expenses as appropriate. The company’s profits give it plenty of breathing room, allowing it to continue investing in growth initiatives.
11. Key Takeaways from Woodward’s Q4 Results
It was good to see Woodward beat analysts’ EPS expectations this quarter. We were also excited its EBITDA outperformed Wall Street’s estimates by a wide margin. Zooming out, we think this was a solid print. The stock traded up 8.6% to $356.54 immediately after reporting.
12. Is Now The Time To Buy Woodward?
Updated: March 20, 2026 at 11:44 PM EDT
Before making an investment decision, investors should account for Woodward’s business fundamentals and valuation in addition to what happened in the latest quarter.
Woodward is a rock-solid business worth owning. First, the company’s revenue growth was solid over the last five years, and analysts believe this will continue. And while its cash profitability fell over the last five years, its spectacular EPS growth over the last five years shows its profits are trickling down to shareholders. Additionally, Woodward’s expanding operating margin shows the business has become more efficient.
Woodward’s P/E ratio based on the next 12 months is 41.7x. A lot of good news is certainly baked in given its premium multiple, but we’ll happily own Woodward as its fundamentals really stand out. Investments like this should be held patiently for at least three to five years as they benefit from the power of long-term compounding, which more than makes up for any short-term price volatility that comes with high valuations.
Wall Street analysts have a consensus one-year price target of $417.75 on the company (compared to the current share price of $353.60).