
Agilent (A)
We’re wary of Agilent. Its poor sales growth and falling returns on capital suggest its growth opportunities are shrinking.― StockStory Analyst Team
1. News

2. Summary
Why Agilent Is Not Exciting
Originally spun off from Hewlett-Packard in 1999 as its measurement and analytical division, Agilent Technologies (NYSE:A) provides analytical instruments, software, services, and consumables for laboratory workflows in life sciences, diagnostics, and applied chemical markets.
- Annual revenue growth of 5.4% over the last five years was below our standards for the healthcare sector
- Core business is underperforming as its organic revenue has disappointed over the past two years, suggesting it might need acquisitions to stimulate growth
- On the plus side, its successful business model is illustrated by its impressive adjusted operating margin


Agilent doesn’t meet our quality standards. We’d search for superior opportunities elsewhere.
Why There Are Better Opportunities Than Agilent


Agilent’s stock price of $124.20 implies a valuation ratio of 20.7x forward P/E. This multiple is quite expensive for the quality you get.
It’s better to pay up for high-quality businesses with strong long-term earnings potential rather than to buy lower-quality companies with open questions and big downside risks.
3. Agilent (A) Research Report: Q3 CY2025 Update
Life sciences tools company Agilent Technologies (NYSE:A) reported revenue ahead of Wall Streets expectations in Q3 CY2025, with sales up 9.4% year on year to $1.86 billion. Its non-GAAP profit of $1.59 per share was in line with analysts’ consensus estimates.
Agilent (A) Q3 CY2025 Highlights:
- Revenue: $1.86 billion vs analyst estimates of $1.83 billion (9.4% year-on-year growth, 1.5% beat)
- Adjusted EPS: $1.59 vs analyst estimates of $1.58 (in line)
- Adjusted EBITDA: $576 million vs analyst estimates of $553.6 million (31% margin, 4% beat)
- Operating Margin: 23.8%, in line with the same quarter last year
- Free Cash Flow Margin: 24.3%, up from 22.8% in the same quarter last year
- Organic Revenue rose 7.2% year on year vs analyst estimates of 5.3% growth (193.7 basis point beat)
- Market Capitalization: $44.5 billion
Company Overview
Originally spun off from Hewlett-Packard in 1999 as its measurement and analytical division, Agilent Technologies (NYSE:A) provides analytical instruments, software, services, and consumables for laboratory workflows in life sciences, diagnostics, and applied chemical markets.
Agilent operates through three business segments that serve customers across pharmaceutical, academic, government, chemical, environmental, food, and clinical diagnostic sectors. The Life Sciences and Applied Markets segment offers sophisticated instruments like liquid and gas chromatography systems, mass spectrometers, and spectroscopy equipment that scientists use to identify, quantify, and analyze the properties of substances. These instruments are essential for applications ranging from drug development to food safety testing.
The Diagnostics and Genomics segment provides tools for analyzing samples at cellular and molecular levels. This includes pathology solutions for cancer diagnostics, cell analysis instruments, genomic technologies like microarrays and next-generation sequencing solutions, and contract manufacturing services for pharmaceutical companies developing oligonucleotide-based therapeutics. A notable part of this segment is the companion diagnostics business, which partners with pharmaceutical companies to develop tests that identify patients most likely to benefit from specific targeted therapies.
The Agilent CrossLab segment delivers services and consumables that support the entire laboratory workflow regardless of instrument manufacturer. This includes maintenance, repair, compliance services, software, consulting, and laboratory management services. The CrossLab business helps customers optimize laboratory operations, improve productivity, and maintain regulatory compliance.
Agilent's products and services are used throughout the scientific discovery and production process. For example, pharmaceutical researchers might use Agilent's mass spectrometers to identify potential drug compounds, its genomic tools to understand disease mechanisms, its pathology solutions to evaluate tissue samples in clinical trials, and its CrossLab services to maintain laboratory equipment and ensure data quality.
The company maintains manufacturing facilities across the United States, Canada, Europe, and Asia, with research and development centers in key locations globally. Agilent sells its products through direct sales teams, distributors, resellers, and e-commerce channels, providing technical support through both on-site assistance and remote service options.
4. Research Tools & Consumables
The life sciences subsector specializing in research tools and consumables enables scientific discoveries across academia, biotechnology, and pharmaceuticals. These firms supply a wide range of essential laboratory products, ensuring a recurring revenue stream through repeat purchases and replenishment. Their business models benefit from strong customer loyalty, a diversified product portfolio, and exposure to both the research and clinical markets. However, challenges include high R&D investment to maintain technological leadership, pricing pressures from budget-conscious institutions, and vulnerability to fluctuations in research funding cycles. Looking ahead, this subsector stands to benefit from tailwinds such as growing demand for tools supporting emerging fields like synthetic biology and personalized medicine. There is also a rise in automation and AI-driven solutions in laboratories that could create new opportunities to sell tools and consumables. Nevertheless, headwinds exist. These companies tend to be at the mercy of supply chain disruptions and sensitivity to macroeconomic conditions that impact funding for research initiatives.
Agilent's competitors vary across its business segments. In the life sciences and applied markets area, it competes with Thermo Fisher Scientific, Waters Corporation, Shimadzu Corporation, PerkinElmer, and Danaher Corporation. In diagnostics and genomics, competitors include Illumina, Roche, Abbott Laboratories, Sartorius, and Twist Bioscience.
5. Economies of Scale
Larger companies benefit from economies of scale, where fixed costs like infrastructure, technology, and administration are spread over a higher volume of goods or services, reducing the cost per unit. Scale can also lead to bargaining power with suppliers, greater brand recognition, and more investment firepower. A virtuous cycle can ensue if a scaled company plays its cards right.
With $6.95 billion in revenue over the past 12 months, Agilent has decent scale. This is important as it gives the company more leverage in a heavily regulated, competitive environment that is complex and resource-intensive.
6. Revenue Growth
A company’s long-term sales performance is one signal of its overall quality. Any business can put up a good quarter or two, but the best consistently grow over the long haul. Unfortunately, Agilent’s 5.4% annualized revenue growth over the last five years was mediocre. This was below our standard for the healthcare sector and is a rough starting point for our analysis.
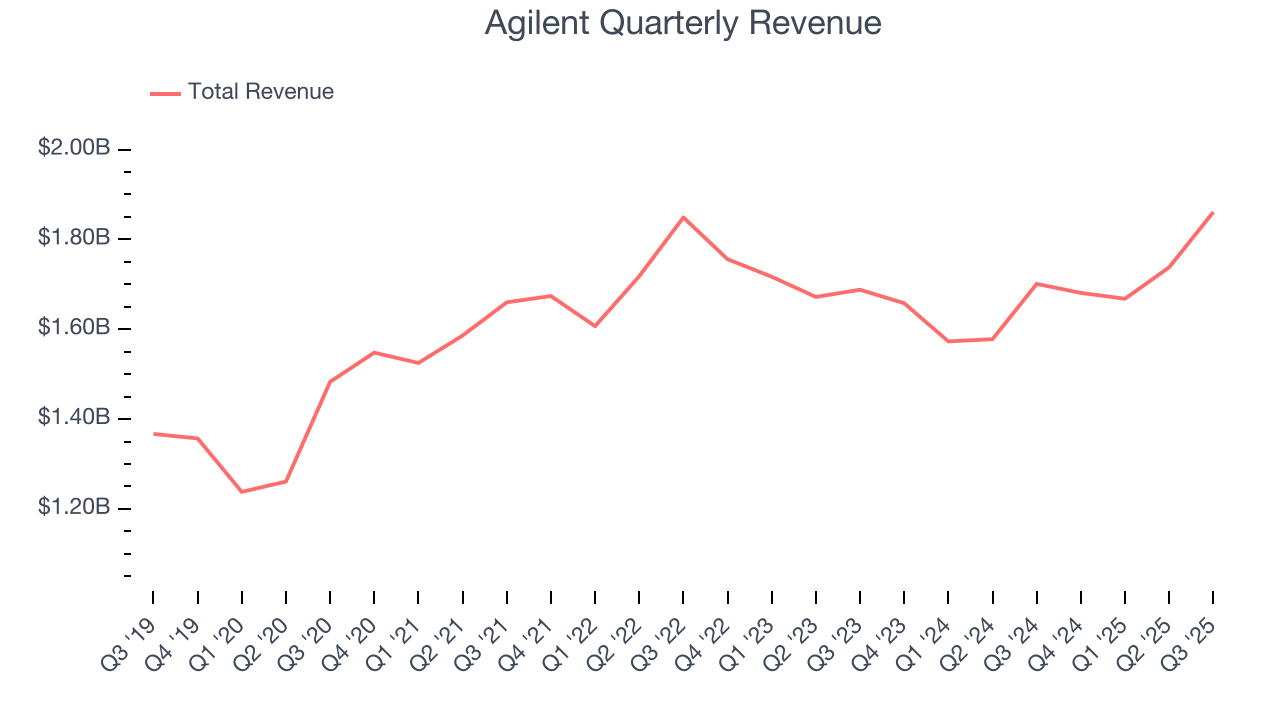
Long-term growth is the most important, but within healthcare, a half-decade historical view may miss new innovations or demand cycles. Agilent’s recent performance shows its demand has slowed as its revenue was flat over the last two years. 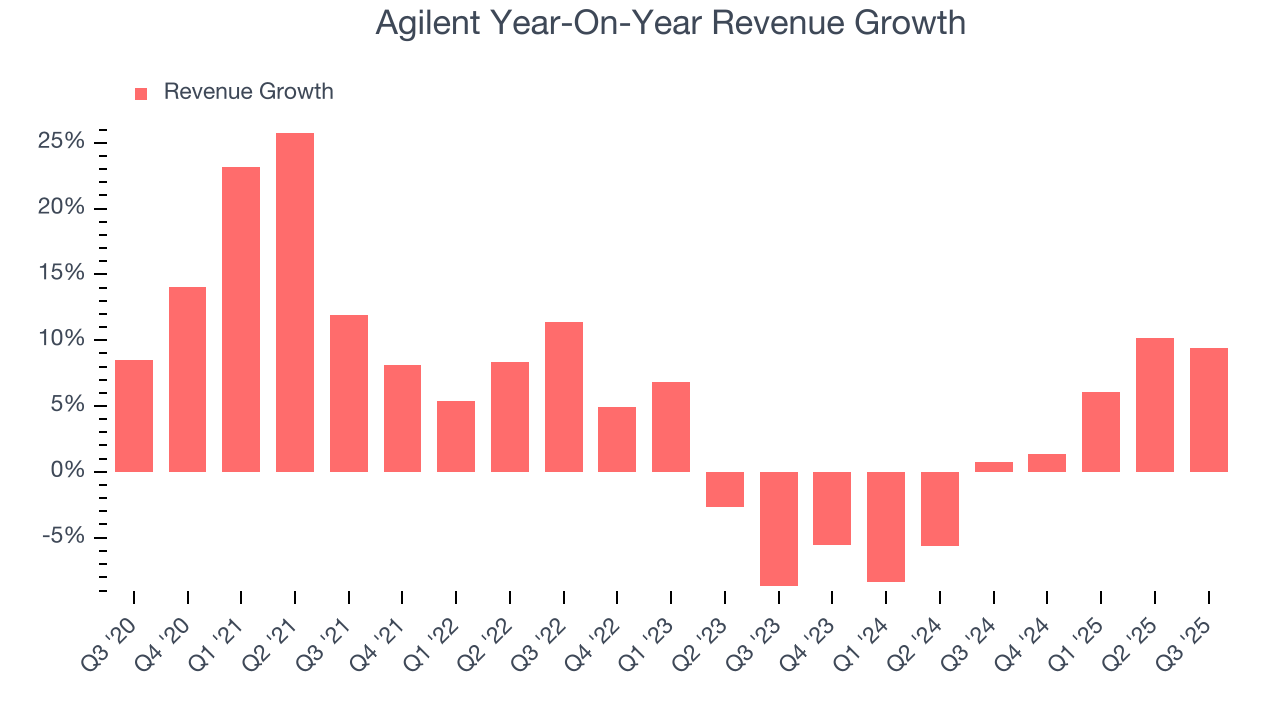
Agilent also reports organic revenue, which strips out one-time events like acquisitions and currency fluctuations that don’t accurately reflect its fundamentals. Over the last two years, Agilent’s organic revenue was flat. Because this number aligns with its two-year revenue growth, we can see the company’s core operations (not acquisitions and divestitures) drove most of its results. 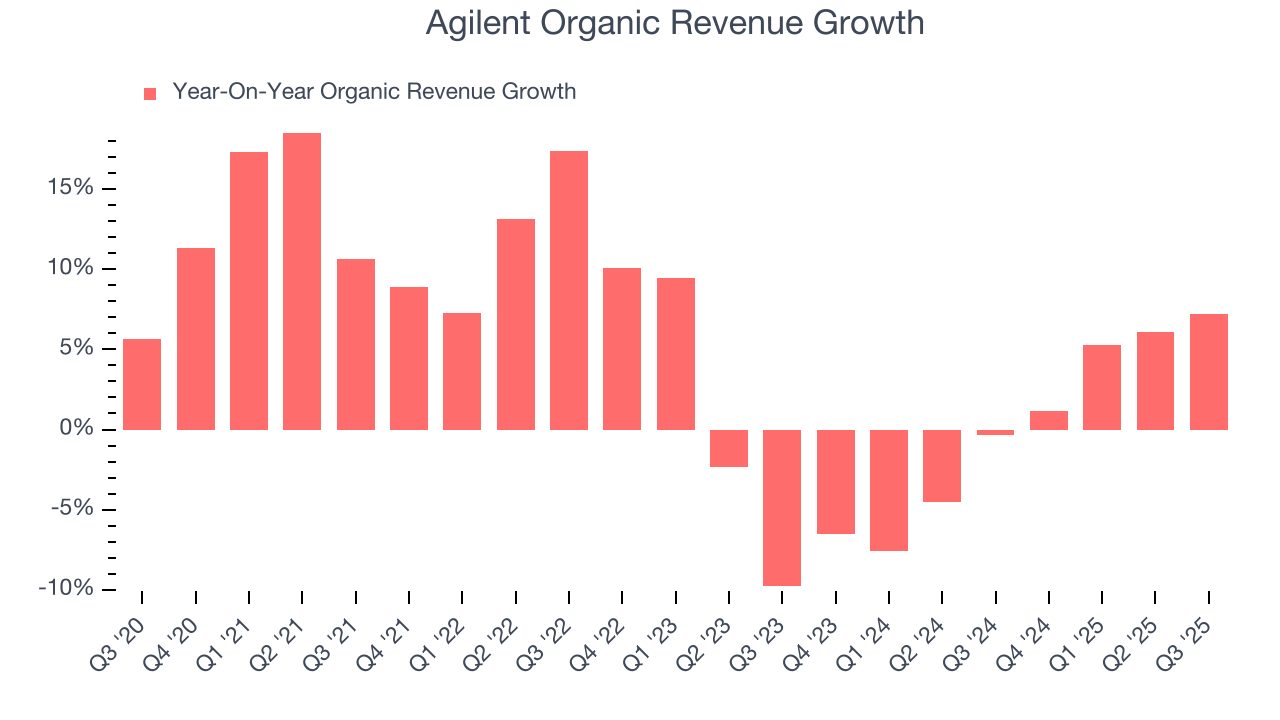
This quarter, Agilent reported year-on-year revenue growth of 9.4%, and its $1.86 billion of revenue exceeded Wall Street’s estimates by 1.5%.
Looking ahead, sell-side analysts expect revenue to grow 5.8% over the next 12 months, an improvement versus the last two years. This projection is above average for the sector and suggests its newer products and services will spur better top-line performance.
7. Adjusted Operating Margin
Agilent’s adjusted operating margin might fluctuated slightly over the last 12 months but has generally stayed the same, averaging 26.4% over the last five years. This profitability was top-notch for a healthcare business, showing it’s an well-run company with an efficient cost structure.
Looking at the trend in its profitability, Agilent’s adjusted operating margin of 25.7% for the trailing 12 months may be around the same as five years ago, but it has decreased by 1.8 percentage points over the last two years. This dynamic unfolded because it struggled to adjust its fixed costs while its demand plateaued.
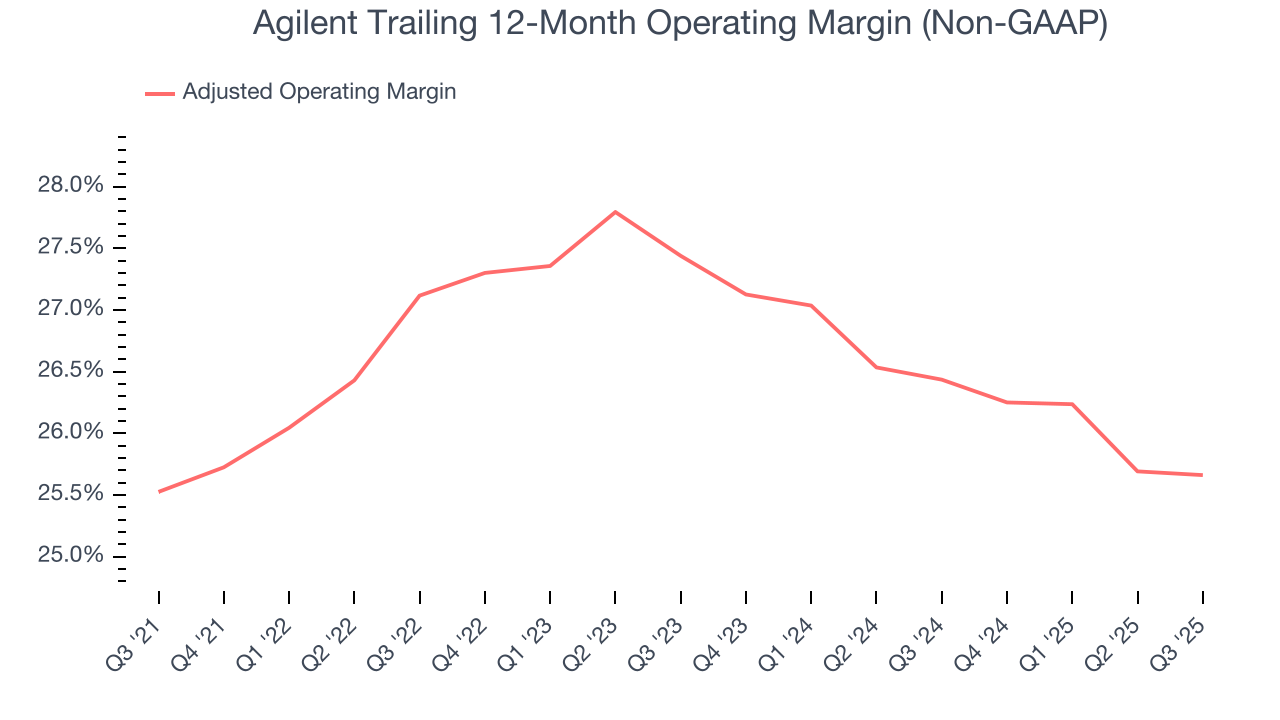
This quarter, Agilent generated an adjusted operating margin profit margin of 27.1%, in line with the same quarter last year. This indicates the company’s overall cost structure has been relatively stable.
8. Earnings Per Share
Revenue trends explain a company’s historical growth, but the long-term change in earnings per share (EPS) points to the profitability of that growth – for example, a company could inflate its sales through excessive spending on advertising and promotions.
Agilent’s EPS grew at a remarkable 11.2% compounded annual growth rate over the last five years, higher than its 5.4% annualized revenue growth. This tells us the company became more profitable on a per-share basis as it expanded.
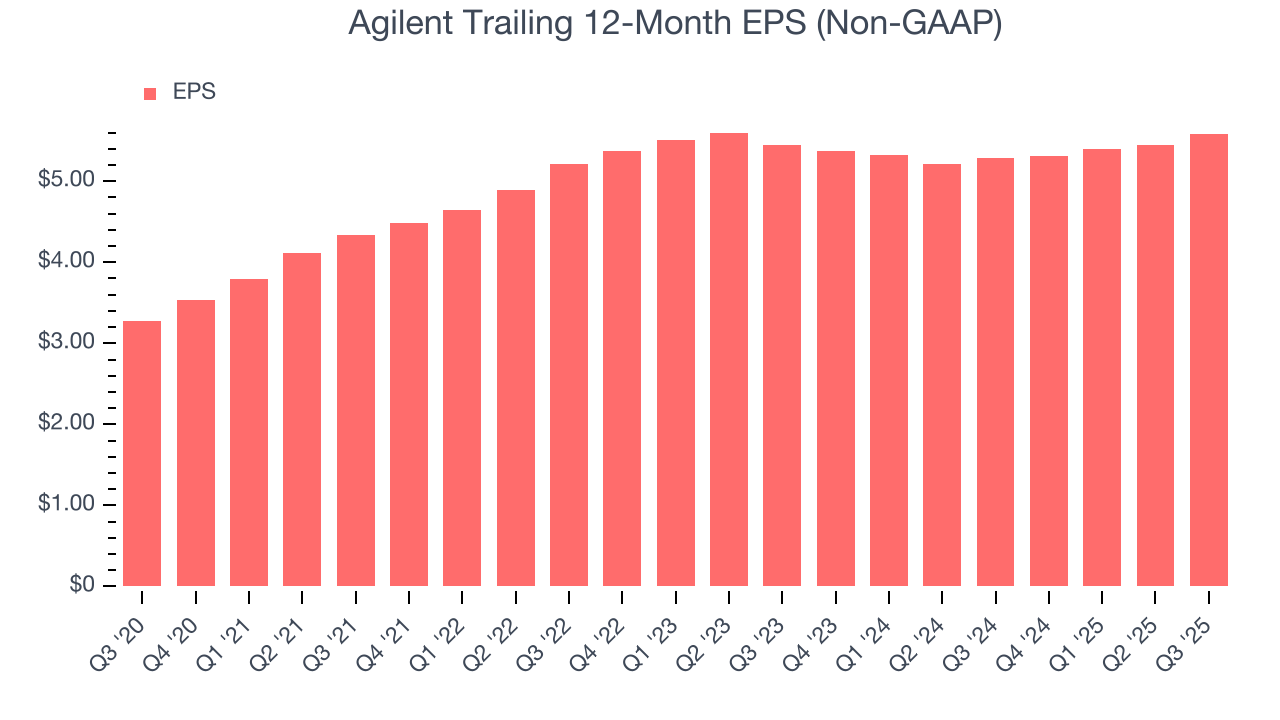
We can take a deeper look into Agilent’s earnings to better understand the drivers of its performance. A five-year view shows that Agilent has repurchased its stock, shrinking its share count by 8.7%. This tells us its EPS outperformed its revenue not because of increased operational efficiency but financial engineering, as buybacks boost per share earnings. 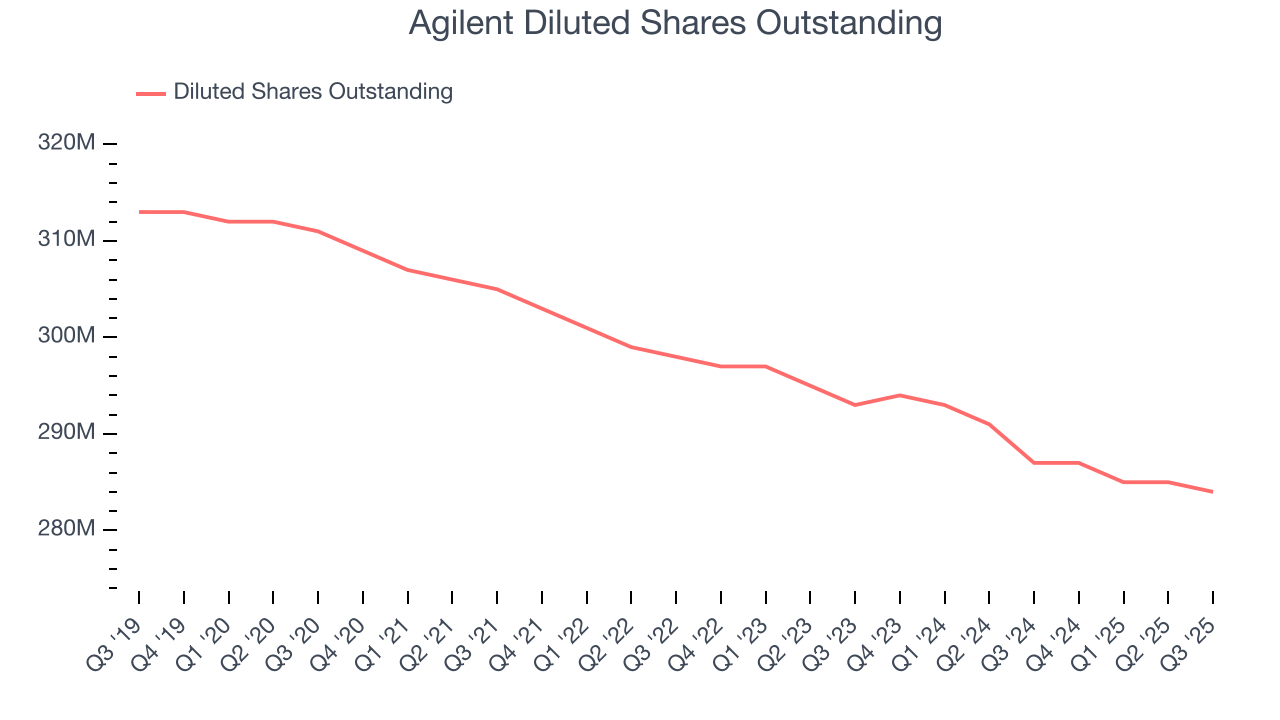
In Q3, Agilent reported adjusted EPS of $1.59, up from $1.46 in the same quarter last year. This print was close to analysts’ estimates. Over the next 12 months, Wall Street expects Agilent’s full-year EPS of $5.58 to grow 7.7%.
9. Cash Is King
If you’ve followed StockStory for a while, you know we emphasize free cash flow. Why, you ask? We believe that in the end, cash is king, and you can’t use accounting profits to pay the bills.
Agilent has shown robust cash profitability, giving it an edge over its competitors and the ability to reinvest or return capital to investors. The company’s free cash flow margin averaged 18.9% over the last five years, quite impressive for a healthcare business.
Taking a step back, we can see that Agilent’s margin dropped by 3.9 percentage points during that time. If its declines continue, it could signal increasing investment needs and capital intensity.
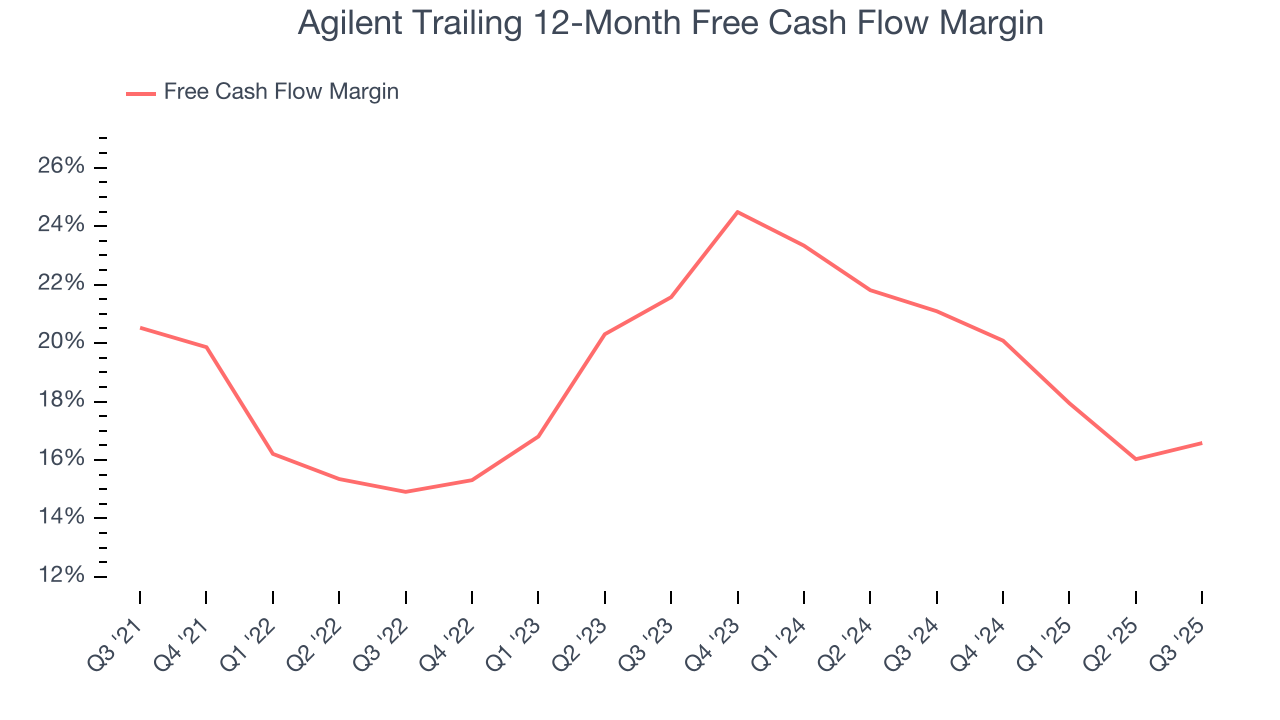
Agilent’s free cash flow clocked in at $452 million in Q3, equivalent to a 24.3% margin. This result was good as its margin was 1.5 percentage points higher than in the same quarter last year, but we wouldn’t read too much into the short term because investment needs can be seasonal, causing temporary swings. Long-term trends carry greater meaning.
10. Return on Invested Capital (ROIC)
EPS and free cash flow tell us whether a company was profitable while growing its revenue. But was it capital-efficient? A company’s ROIC explains this by showing how much operating profit it makes compared to the money it has raised (debt and equity).
Although Agilent hasn’t been the highest-quality company lately, it historically found a few growth initiatives that worked out well. Its five-year average ROIC was 17.1%, impressive for a healthcare business.
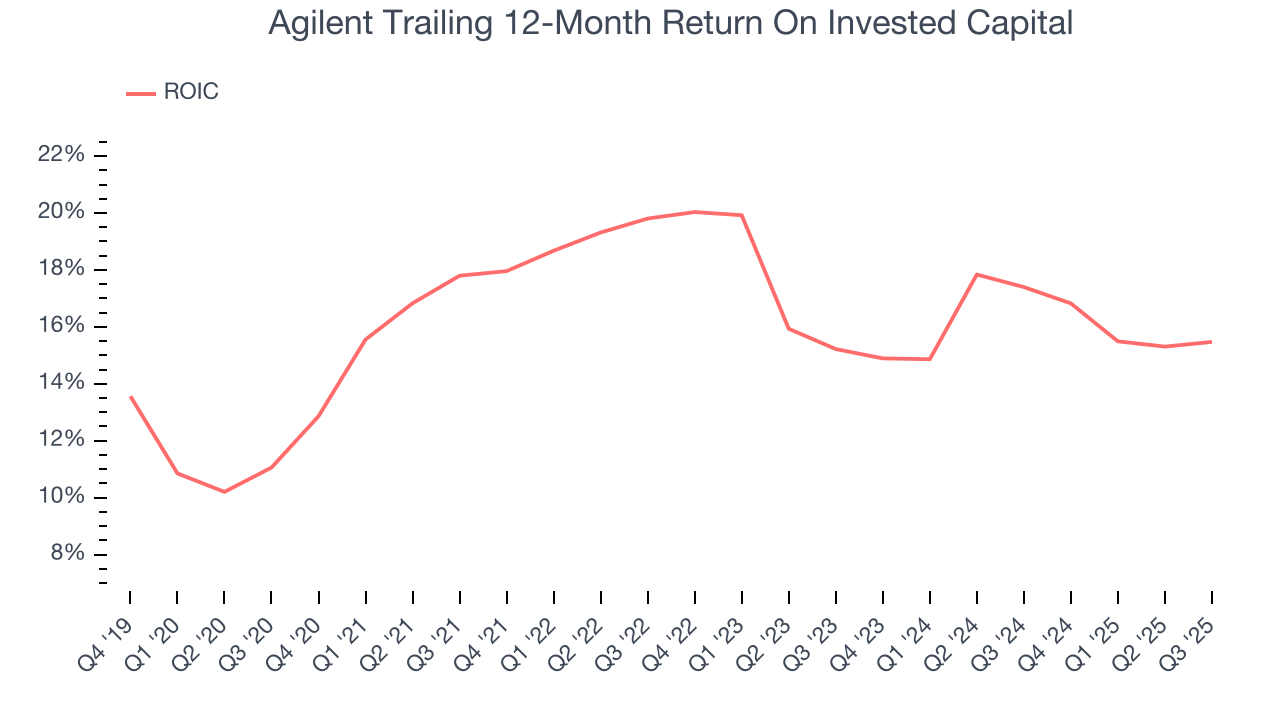
We like to invest in businesses with high returns, but the trend in a company’s ROIC is what often surprises the market and moves the stock price. On average, Agilent’s ROIC decreased by 2.4 percentage points annually over the last few years. We like what management has done in the past, but its declining returns are perhaps a symptom of fewer profitable growth opportunities.
11. Balance Sheet Assessment
Agilent reported $1.79 billion of cash and $3.35 billion of debt on its balance sheet in the most recent quarter. As investors in high-quality companies, we primarily focus on two things: 1) that a company’s debt level isn’t too high and 2) that its interest payments are not excessively burdening the business.
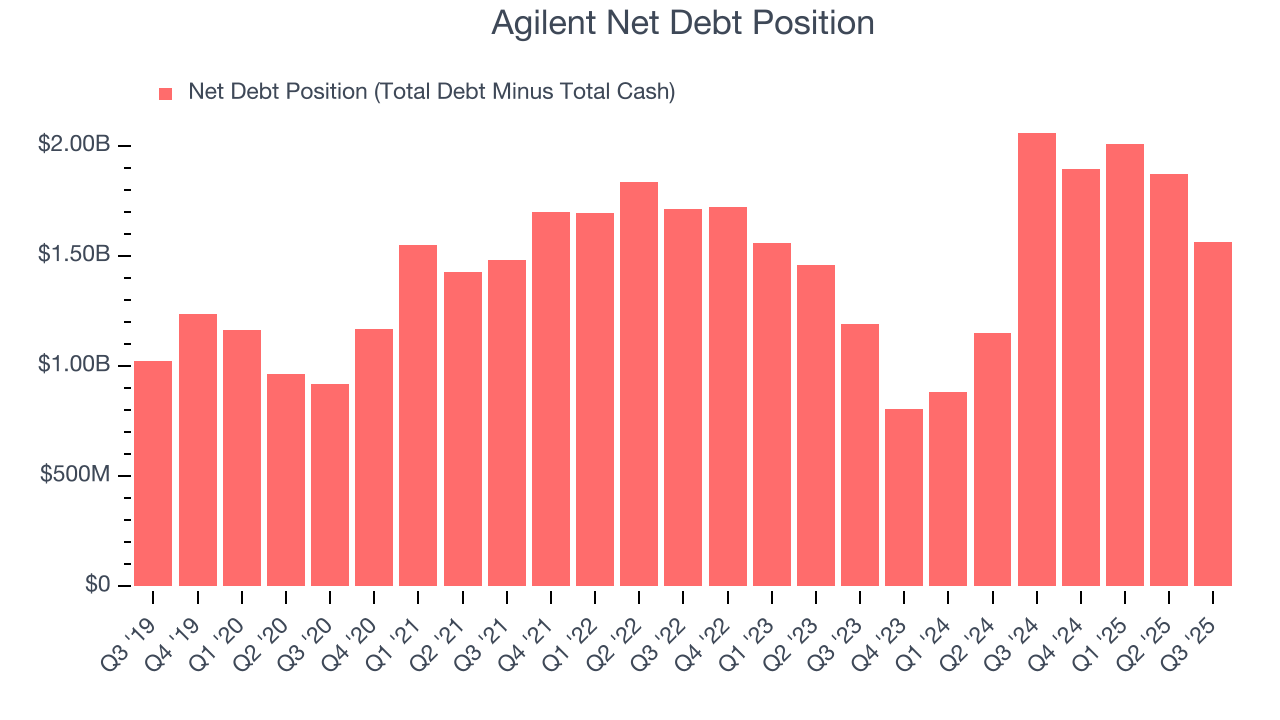
With $2.07 billion of EBITDA over the last 12 months, we view Agilent’s 0.8× net-debt-to-EBITDA ratio as safe. We also see its $50 million of annual interest expenses as appropriate. The company’s profits give it plenty of breathing room, allowing it to continue investing in growth initiatives.
12. Key Takeaways from Agilent’s Q3 Results
We enjoyed seeing Agilent beat analysts’ organic revenue expectations this quarter. We were also happy its revenue narrowly outperformed Wall Street’s estimates. Overall, we think this was a solid quarter with some key areas of upside. The stock remained flat at $157.46 immediately following the results.
13. Is Now The Time To Buy Agilent?
Updated: February 23, 2026 at 11:28 PM EST
We think that the latest earnings result is only one piece of the bigger puzzle. If you’re deciding whether to own Agilent, you should also grasp the company’s longer-term business quality and valuation.
Agilent isn’t a terrible business, but it doesn’t pass our bar. To kick things off, its revenue growth was mediocre over the last five years, and analysts don’t see anything changing over the next 12 months. While its strong operating margins show it’s a well-run business, the downside is its cash profitability fell over the last five years. On top of that, its diminishing returns show management's prior bets haven't worked out.
Agilent’s P/E ratio based on the next 12 months is 20.7x. Beauty is in the eye of the beholder, but we don’t really see a big opportunity at the moment. We're fairly confident there are better stocks to buy right now.
Wall Street analysts have a consensus one-year price target of $169.67 on the company (compared to the current share price of $124.20).
Although the price target is bullish, readers should exercise caution because analysts tend to be overly optimistic. The firms they work for, often big banks, have relationships with companies that extend into fundraising, M&A advisory, and other rewarding business lines. As a result, they typically hesitate to say bad things for fear they will lose out. We at StockStory do not suffer from such conflicts of interest, so we’ll always tell it like it is.