
Arthur J. Gallagher (AJG)
We like Arthur J. Gallagher. Its combination of fast growth, robust profitability, and superb prospects makes it a coveted asset.― StockStory Analyst Team
1. News


2. Summary
Why We Like Arthur J. Gallagher
Founded in 1927 and operating in approximately 130 countries through direct operations and correspondent networks, Arthur J. Gallagher (NYSE:AJG) provides insurance brokerage, reinsurance, consulting, and third-party claims settlement services to businesses and individuals worldwide.
- Impressive 16.5% annual revenue growth over the last five years indicates it’s winning market share this cycle
- Earnings per share grew by 17.7% annually over the last five years and trumped its peers
- Massive revenue base of $13.92 billion makes it a well-known name that influences purchasing decisions


Arthur J. Gallagher is a standout company. The price seems reasonable based on its quality, so this could be an opportune time to invest in some shares.
Why Is Now The Time To Buy Arthur J. Gallagher?


At $211.53 per share, Arthur J. Gallagher trades at 16.5x forward P/E. Most business services companies are more expensive, so we think Arthur J. Gallagher is a good deal when considering its quality characteristics.
Our analysis and backtests show high-quality businesses routinely outperform the market over a multi-year period, especially when priced like this.
3. Arthur J. Gallagher (AJG) Research Report: Q4 CY2025 Update
Insurance brokerage firm Arthur J. Gallagher (NYSE:AJG) reported Q4 CY2025 results beating Wall Street’s revenue expectations, with sales up 35.6% year on year to $3.63 billion. Its non-GAAP profit of $2.38 per share was 1.4% above analysts’ consensus estimates.
Arthur J. Gallagher (AJG) Q4 CY2025 Highlights:
- Revenue: $3.63 billion vs analyst estimates of $3.6 billion (35.6% year-on-year growth, 0.7% beat)
- Adjusted EPS: $2.38 vs analyst estimates of $2.35 (1.4% beat)
- Adjusted EBITDA: $1.05 billion vs analyst estimates of $1.04 billion (28.9% margin, 0.6% beat)
- Market Capitalization: $62.24 billion
Company Overview
Founded in 1927 and operating in approximately 130 countries through direct operations and correspondent networks, Arthur J. Gallagher (NYSE:AJG) provides insurance brokerage, reinsurance, consulting, and third-party claims settlement services to businesses and individuals worldwide.
The company operates through three main segments: Brokerage, Risk Management, and Corporate. The Brokerage segment, which generates the majority of revenue, places nearly all lines of commercial property/casualty and health insurance through a network of offices across the United States and internationally. This segment is organized into specialized niche groups targeting specific industries like healthcare, construction, energy, and education, allowing for focused expertise and customized solutions.
Gallagher's retail brokers help clients assess risks and secure appropriate coverage, while its wholesale brokers assist with specialized and hard-to-place insurance. The company's reinsurance division, Gallagher Re, helps insurance companies manage their own risk by securing protection from other insurers. For example, a regional property insurer might work with Gallagher Re to obtain catastrophe reinsurance that protects against major hurricane losses.
The Risk Management segment provides third-party claims administration, loss control services, and risk management consulting primarily to large corporations, nonprofit organizations, and public entities that choose to self-insure their risks rather than purchase traditional insurance. This might include a large retailer that pays Gallagher to handle workers' compensation claims instead of purchasing a policy from an insurance carrier.
Gallagher generates revenue primarily through commissions on insurance placements and fees for consulting and claims management services. The company has expanded significantly through acquisitions, adding specialized expertise and geographic reach to its global operations.
4. Insurance Brokers
The insurance brokerage industry, while influenced by insurance pricing cycles, benefits from durable secular tailwinds as rising risk complexity (climate, data privacy), regulatory scrutiny, and insurance pricing inflation. These increase demand for professional risk-management advice. Brokers operate models that rely on commissions and fees tied to premium volumes and growing contributions from recurring advisory, benefits, and compliance services. Scale is a key advantage, enabling better carrier access, stronger data and benchmarking, and efficient deployment of technology and compliance investments, which in turn supports ongoing industry consolidation. The headwinds are labor intensity and wage inflation for producers, regulatory complexity (this cuts both ways, as you can see), and execution risk when integrating new digital tools into legacy workflows.
Arthur J. Gallagher competes with other major insurance brokers including Marsh McLennan (NYSE:MMC), Aon (NYSE:AON), and Willis Towers Watson (NASDAQ:WTW), as well as with numerous regional and specialty brokers in the fragmented insurance intermediary market.
5. Revenue Growth
A company’s long-term sales performance can indicate its overall quality. Any business can put up a good quarter or two, but the best consistently grow over the long haul.
With $13.94 billion in revenue over the past 12 months, Arthur J. Gallagher is a behemoth in the business services sector and benefits from economies of scale, giving it an edge in distribution. This also enables it to gain more leverage on its fixed costs than smaller competitors and the flexibility to offer lower prices.
As you can see below, Arthur J. Gallagher grew its sales at an incredible 16.5% compounded annual growth rate over the last five years. This is a great starting point for our analysis because it shows Arthur J. Gallagher’s demand was higher than many business services companies.
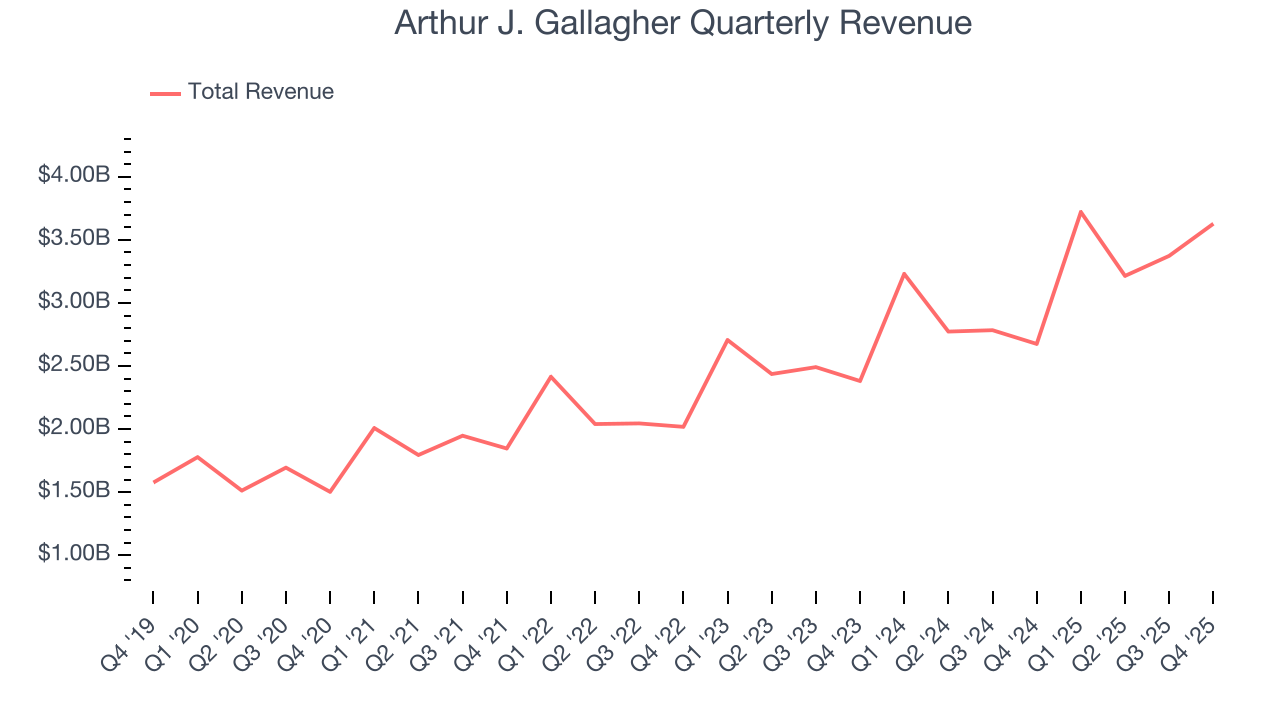
Long-term growth is the most important, but within business services, a half-decade historical view may miss new innovations or demand cycles. Arthur J. Gallagher’s annualized revenue growth of 18% over the last two years is above its five-year trend, suggesting its demand was strong and recently accelerated. 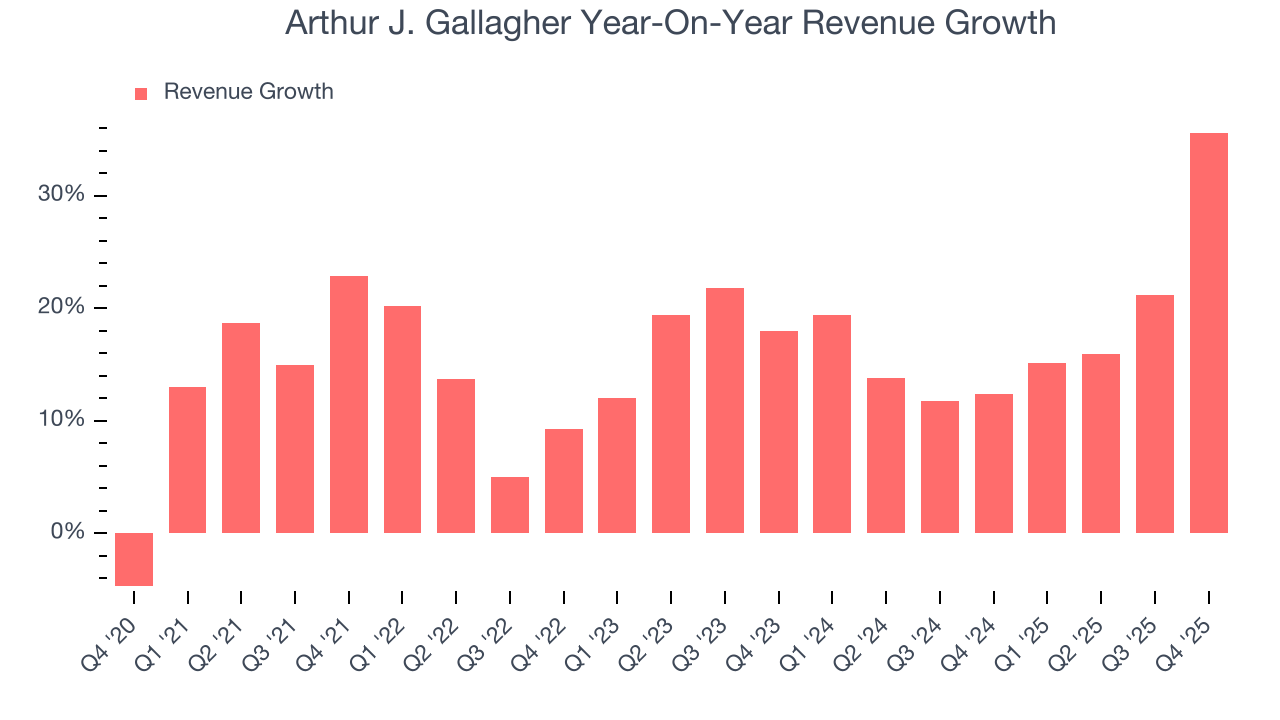
This quarter, Arthur J. Gallagher reported wonderful year-on-year revenue growth of 35.6%, and its $3.63 billion of revenue exceeded Wall Street’s estimates by 0.7%.
Looking ahead, sell-side analysts expect revenue to grow 22.6% over the next 12 months, an improvement versus the last two years. This projection is eye-popping for a company of its scale and suggests its newer products and services will spur better top-line performance.
6. Operating Margin
Operating margin is one of the best measures of profitability because it tells us how much money a company takes home after subtracting all core expenses, like marketing and R&D.
Arthur J. Gallagher has been an efficient company over the last five years. It was one of the more profitable businesses in the business services sector, boasting an average operating margin of 14.7%.
Looking at the trend in its profitability, Arthur J. Gallagher’s operating margin rose by 1.4 percentage points over the last five years, as its sales growth gave it operating leverage.
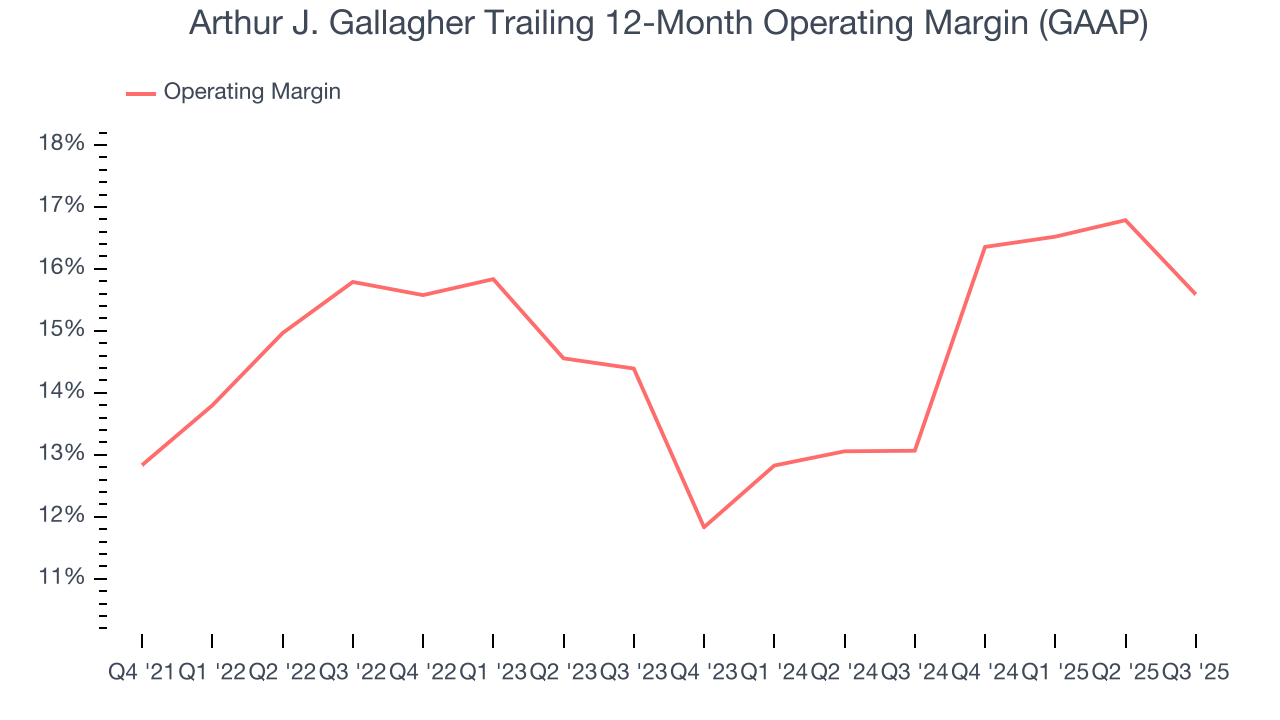
in line with the same quarter last year. This indicates the company’s overall cost structure has been relatively stable.
7. Earnings Per Share
Revenue trends explain a company’s historical growth, but the long-term change in earnings per share (EPS) points to the profitability of that growth – for example, a company could inflate its sales through excessive spending on advertising and promotions.
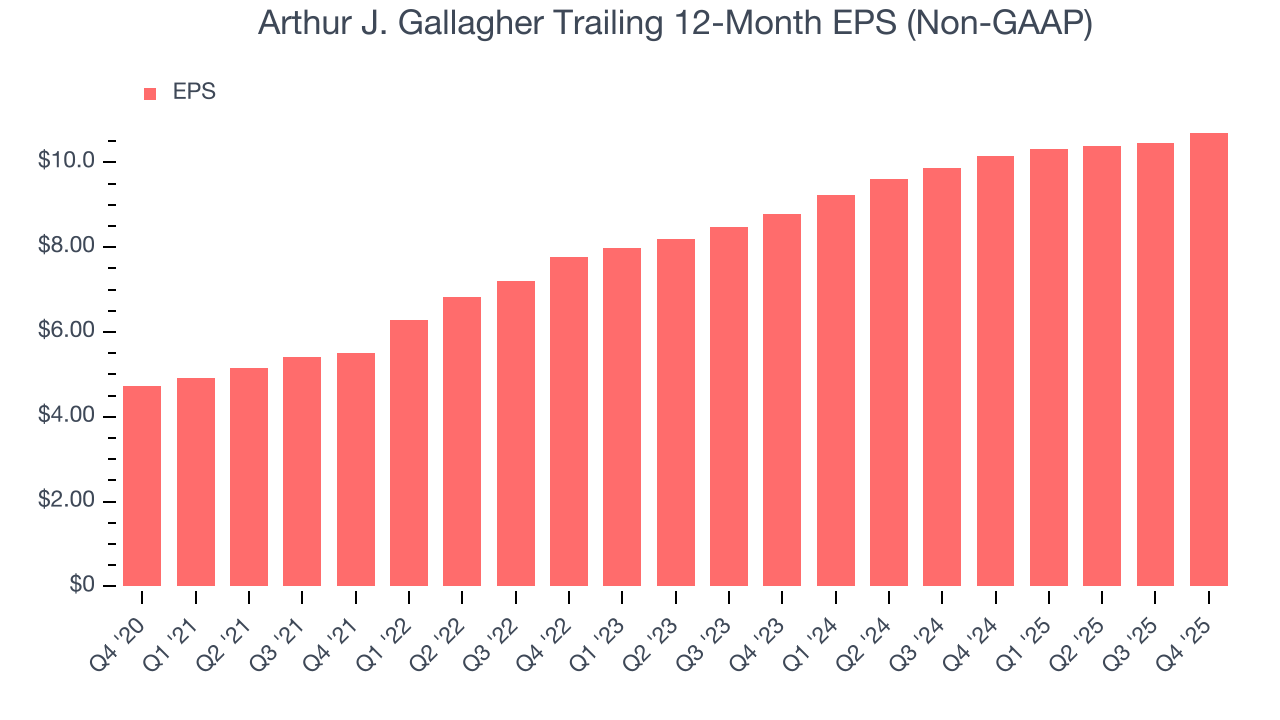
Arthur J. Gallagher’s astounding 17.7% annual EPS growth over the last five years aligns with its revenue performance. This tells us its incremental sales were profitable.
Like with revenue, we analyze EPS over a shorter period to see if we are missing a change in the business.
Although it performed well, Arthur J. Gallagher’s two-year annual EPS growth of 10.4% lower than its 18% two-year revenue growth.
Diving into Arthur J. Gallagher’s quality of earnings can give us a better understanding of its performance. A two-year view shows Arthur J. Gallagher has diluted its shareholders, growing its share count by 20.4%. This has led to lower per share earnings. Taxes and interest expenses can also affect EPS but don’t tell us as much about a company’s fundamentals. 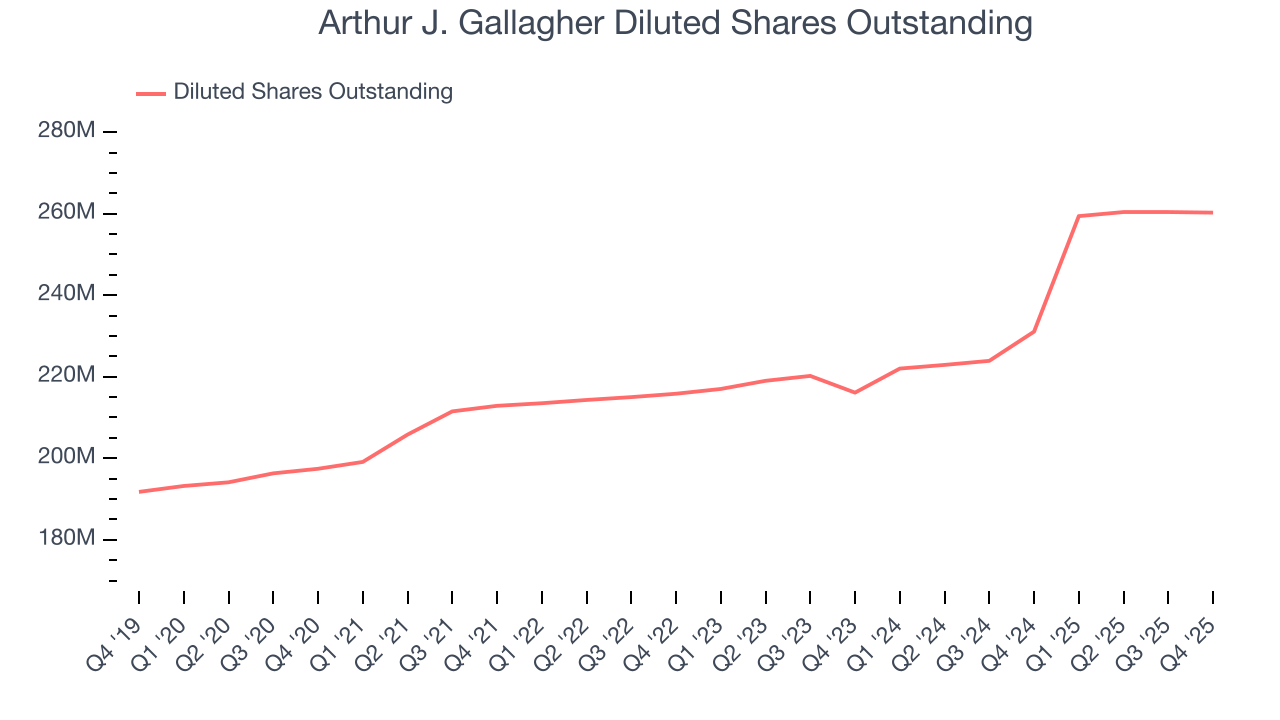
In Q4, Arthur J. Gallagher reported adjusted EPS of $2.38, up from $2.13 in the same quarter last year. This print beat analysts’ estimates by 1.4%. Over the next 12 months, Wall Street expects Arthur J. Gallagher’s full-year EPS of $10.70 to grow 23.9%.
8. Cash Is King
Although earnings are undoubtedly valuable for assessing company performance, we believe cash is king because you can’t use accounting profits to pay the bills.
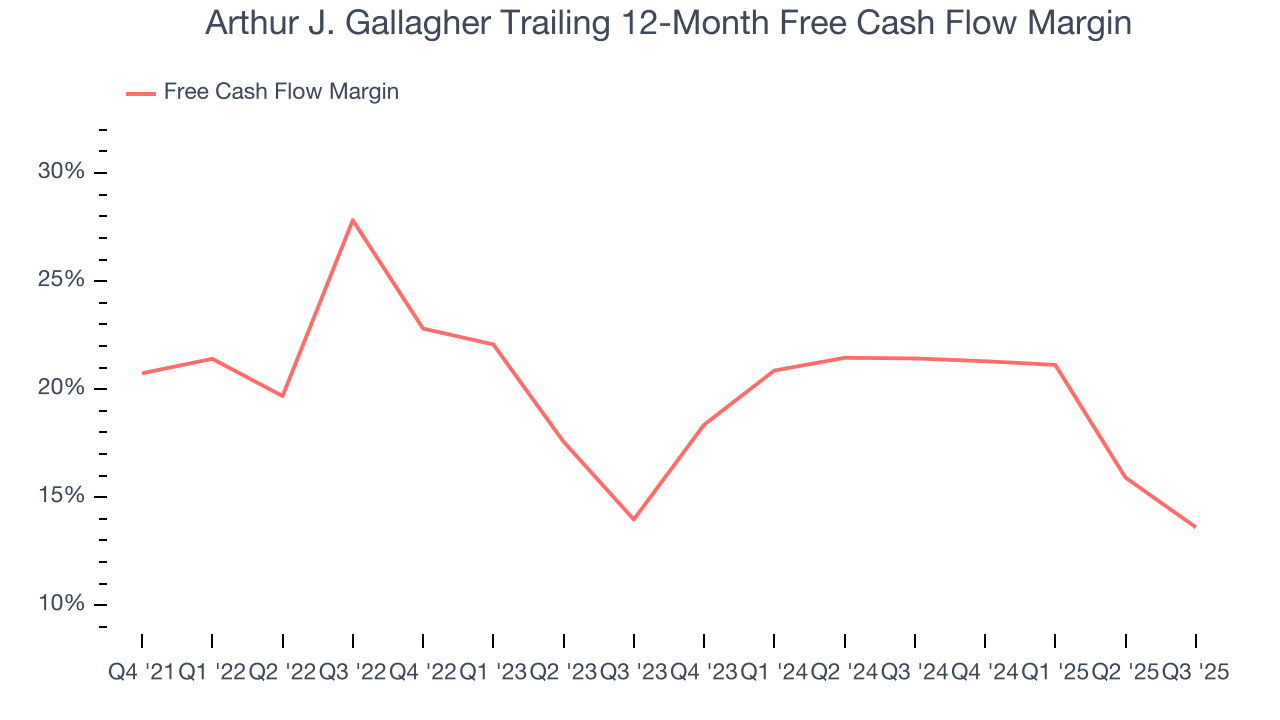
Arthur J. Gallagher has shown terrific cash profitability, enabling it to reinvest, return capital to investors, and stay ahead of the competition while maintaining an ample cushion. The company’s free cash flow margin was among the best in the business services sector, averaging 18.5% over the last five years.
Taking a step back, we can see that Arthur J. Gallagher’s margin dropped by 7.7 percentage points during that time. If its declines continue, it could signal increasing investment needs and capital intensity.
9. Return on Invested Capital (ROIC)
EPS and free cash flow tell us whether a company was profitable while growing its revenue. But was it capital-efficient? A company’s ROIC explains this by showing how much operating profit it makes compared to the money it has raised (debt and equity).
Although Arthur J. Gallagher has shown solid business quality lately, it historically did a mediocre job investing in profitable growth initiatives. Its five-year average ROIC was 6.1%, somewhat low compared to the best business services companies that consistently pump out 25%+.
We like to invest in businesses with high returns, but the trend in a company’s ROIC is what often surprises the market and moves the stock price. Over the last few years, Arthur J. Gallagher’s ROIC averaged 1.4 percentage point decreases each year. If its returns keep falling, it could suggest its profitable growth opportunities are drying up. We’ll keep a close eye.
10. Balance Sheet Assessment
Arthur J. Gallagher reported $1.4 billion of cash and $13.26 billion of debt on its balance sheet in the most recent quarter. As investors in high-quality companies, we primarily focus on two things: 1) that a company’s debt level isn’t too high and 2) that its interest payments are not excessively burdening the business.
With $4.49 billion of EBITDA over the last 12 months, we view Arthur J. Gallagher’s 2.6× net-debt-to-EBITDA ratio as safe. We also see its $330.4 million of annual interest expenses as appropriate. The company’s profits give it plenty of breathing room, allowing it to continue investing in growth initiatives.
11. Key Takeaways from Arthur J. Gallagher’s Q4 Results
It was good to see Arthur J. Gallagher narrowly top analysts’ revenue expectations this quarter, leading to an EPS beat. Overall, this print had some key positives. The stock traded up 1.7% to $249.91 immediately following the results.
12. Is Now The Time To Buy Arthur J. Gallagher?
Updated: February 11, 2026 at 11:22 PM EST
Before deciding whether to buy Arthur J. Gallagher or pass, we urge investors to consider business quality, valuation, and the latest quarterly results.
Arthur J. Gallagher is a rock-solid business worth owning. To begin with, its revenue growth was exceptional over the last five years, and its growth over the next 12 months is expected to accelerate. And while its cash profitability fell over the last five years, its scale makes it a trusted partner with negotiating leverage. On top of that, Arthur J. Gallagher’s powerful free cash flow generation enables it to stay ahead of the competition through consistent reinvestment of profits.
Arthur J. Gallagher’s P/E ratio based on the next 12 months is 16.1x. Analyzing the business services landscape today, Arthur J. Gallagher’s positive attributes shine bright. We like the stock at this price.
Wall Street analysts have a consensus one-year price target of $288.50 on the company (compared to the current share price of $205.71), implying they see 40.2% upside in buying Arthur J. Gallagher in the short term.