Armstrong World (AWI)
Armstrong World is a world-class company. Its fusion of high growth and profitability makes it an unstoppable force with big upside.― StockStory Analyst Team
1. News


2. Summary
Why We Like Armstrong World
Started as a two-man shop dating back to the 1860s, Armstrong (NYSE:AWI) provides ceiling and wall products to commercial and residential spaces.
- Additional sales over the last two years increased its profitability as the 18% annual growth in its earnings per share outpaced its revenue
- Excellent operating margin highlights the strength of its business model, and it turbocharged its profits by achieving some fixed cost leverage
- ROIC punches in at 22.4%, illustrating management’s expertise in identifying profitable investments, and its returns are climbing as it finds even more attractive growth opportunities


We’re optimistic about Armstrong World. The valuation seems reasonable when considering its quality, and we think now is a favorable time to buy the stock.
Why Is Now The Time To Buy Armstrong World?


Armstrong World’s stock price of $165.87 implies a valuation ratio of 19.7x forward P/E. This multiple is lower than most industrials companies, and we think the stock is a deal when considering its quality characteristics.
Our analysis and backtests consistently tell us that buying high-quality companies and holding them for many years leads to market outperformance. Entry price matters less, but if you can get a good one, all the better.
3. Armstrong World (AWI) Research Report: Q4 CY2025 Update
Ceiling and wall solutions company Armstrong World Industries (NYSE:AWI) missed Wall Street’s revenue expectations in Q4 CY2025, but sales rose 5.6% year on year to $388.3 million. On the other hand, the company’s full-year revenue guidance of $1.77 billion at the midpoint came in 1.1% above analysts’ estimates. Its non-GAAP profit of $1.61 per share was 4% below analysts’ consensus estimates.
Armstrong World (AWI) Q4 CY2025 Highlights:
- Revenue: $388.3 million vs analyst estimates of $400.5 million (5.6% year-on-year growth, 3% miss)
- Adjusted EPS: $1.61 vs analyst expectations of $1.68 (4% miss)
- Adjusted EBITDA: $124 million vs analyst estimates of $128.5 million (31.9% margin, 3.5% miss)
- Adjusted EPS guidance for the upcoming financial year 2026 is $8.20 at the midpoint, missing analyst estimates by 2.8%
- EBITDA guidance for the upcoming financial year 2026 is $610 million at the midpoint, below analyst estimates of $615.3 million
- Operating Margin: 23.7%, up from 22.3% in the same quarter last year
- Free Cash Flow Margin: 22.4%, up from 15.7% in the same quarter last year
- Market Capitalization: $8.32 billion
Company Overview
Started as a two-man shop dating back to the 1860s, Armstrong (NYSE:AWI) provides ceiling and wall products to commercial and residential spaces.
The company makes ceilings and walls that improve the aesthetic and acoustic environment of interiors for businesses and homeowners. Its products help its customers build spaces that are visually appealing and functionally superior, promoting comfort and productivity.
The company offers a diverse range of ceiling and wall solutions, including mineral fiber, fiberglass, and metal ceiling tiles, along with suspension systems and walls. These products cater to various settings, from commercial buildings to residential homes, providing options for sound absorption, durability, and design flexibility.
It earns revenue primarily through the sale of its ceiling and wall products to contractors, builders, and architects for both new construction and renovation projects. The large majority of its net sales are to distributors, with large home centers like the Home Depot coming in second. Sales directly to customers and retailers make up the remaining small portion of its revenue.
4. Building Materials
Traditionally, building materials companies have built competitive advantages with economies of scale, brand recognition, and strong relationships with builders and contractors. More recently, advances to address labor availability and job site productivity have spurred innovation. Additionally, companies in the space that can produce more energy-efficient materials have opportunities to take share. However, these companies are at the whim of construction volumes, which tend to be cyclical and can be impacted heavily by economic factors such as interest rates. Additionally, the costs of raw materials can be driven by a myriad of worldwide factors and greatly influence the profitability of building materials companies.
Competitors offering wall and ceiling solutions include Saint-Goabin (EPA:SGO.PA) and private companies Hunter Douglas and USG Corporation.
5. Revenue Growth
Reviewing a company’s long-term sales performance reveals insights into its quality. Any business can have short-term success, but a top-tier one grows for years. Thankfully, Armstrong World’s 11.6% annualized revenue growth over the last five years was impressive. Its growth surpassed the average industrials company and shows its offerings resonate with customers, a great starting point for our analysis.
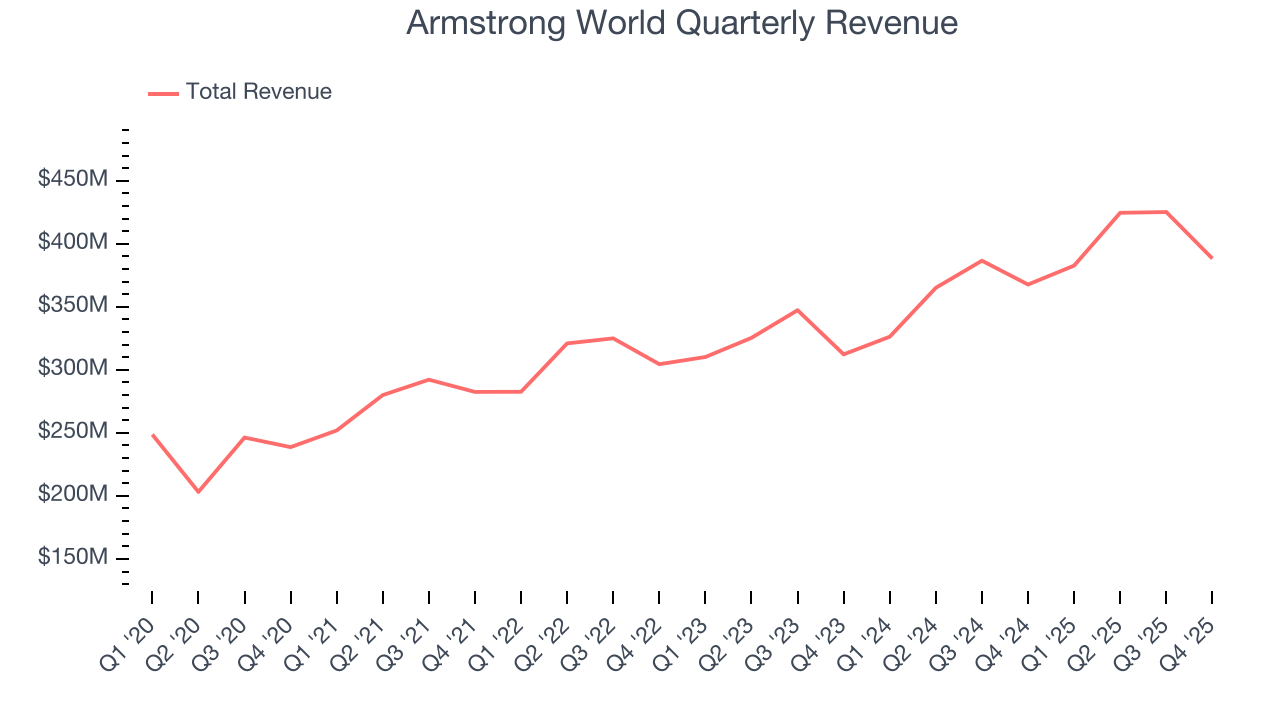
Long-term growth is the most important, but within industrials, a half-decade historical view may miss new industry trends or demand cycles. Armstrong World’s annualized revenue growth of 11.9% over the last two years aligns with its five-year trend, suggesting its demand was predictably strong. 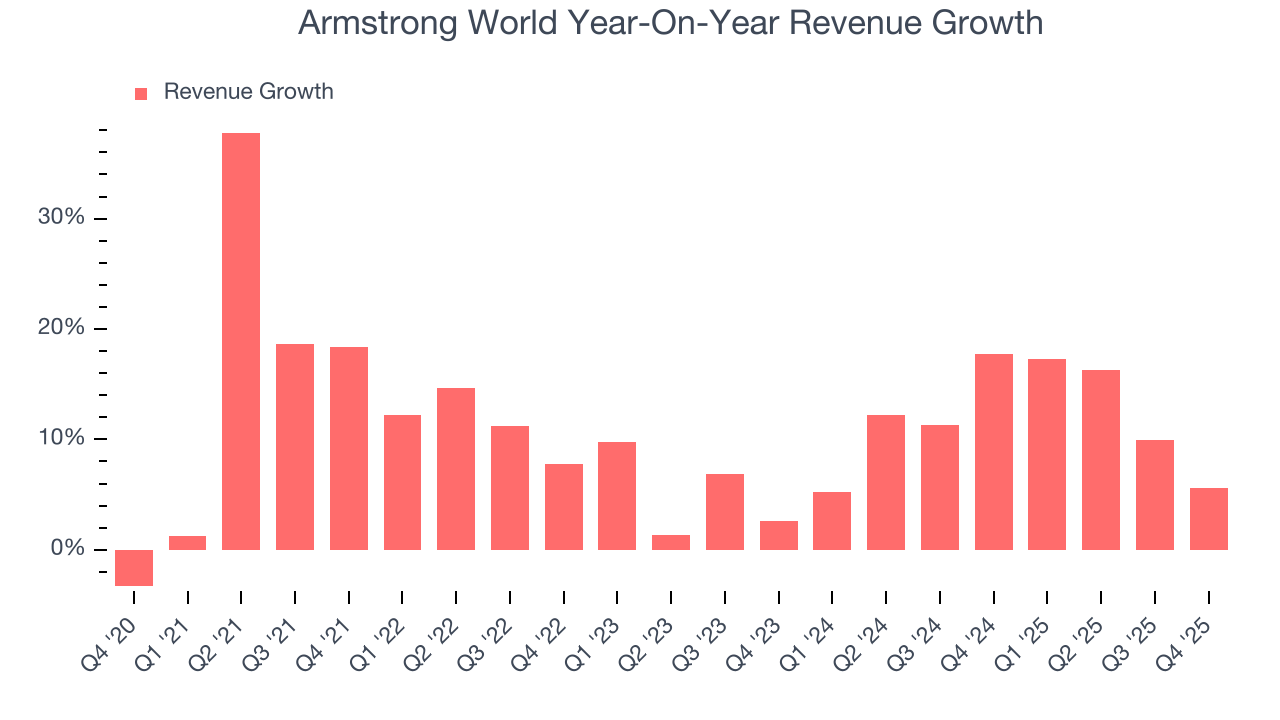
This quarter, Armstrong World’s revenue grew by 5.6% year on year to $388.3 million, missing Wall Street’s estimates.
Looking ahead, sell-side analysts expect revenue to grow 7.4% over the next 12 months, a deceleration versus the last two years. This projection is underwhelming and indicates its products and services will face some demand challenges. At least the company is tracking well in other measures of financial health.
6. Gross Margin & Pricing Power
Armstrong World’s unit economics are great compared to the broader industrials sector and signal that it enjoys product differentiation through quality or brand. As you can see below, it averaged an excellent 38.7% gross margin over the last five years. Said differently, roughly $38.69 was left to spend on selling, marketing, R&D, and general administrative overhead for every $100 in revenue. 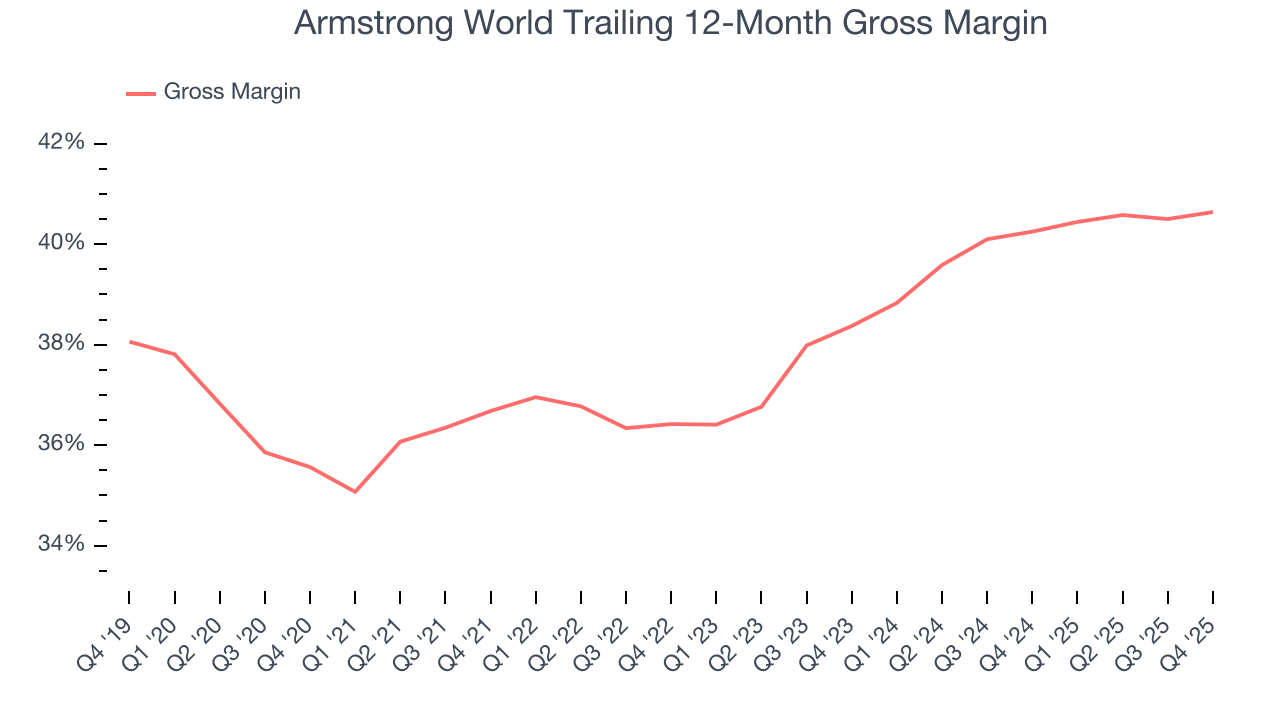
In Q4, Armstrong World produced a 39.8% gross profit margin, in line with the same quarter last year. On a wider time horizon, the company’s full-year margin has remained steady over the past four quarters, suggesting its input costs (such as raw materials and manufacturing expenses) have been stable and it isn’t under pressure to lower prices.
7. Operating Margin
Operating margin is an important measure of profitability as it shows the portion of revenue left after accounting for all core expenses – everything from the cost of goods sold to advertising and wages. It’s also useful for comparing profitability across companies with different levels of debt and tax rates because it excludes interest and taxes.
Armstrong World has been a well-oiled machine over the last five years. It demonstrated elite profitability for an industrials business, boasting an average operating margin of 24.9%. This result isn’t surprising as its high gross margin gives it a favorable starting point.
Looking at the trend in its profitability, Armstrong World’s operating margin rose by 3.1 percentage points over the last five years, as its sales growth gave it operating leverage.
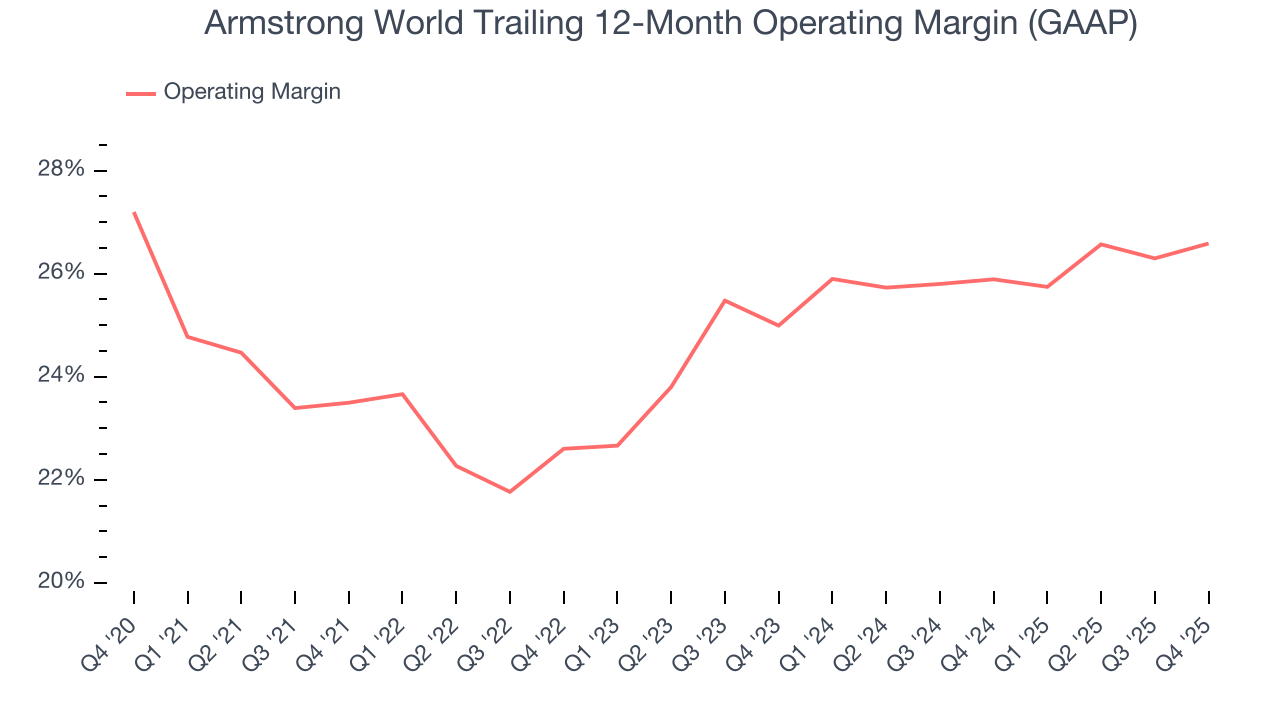
This quarter, Armstrong World generated an operating margin profit margin of 23.7%, up 1.4 percentage points year on year. The increase was encouraging, and because its operating margin rose more than its gross margin, we can infer it was more efficient with expenses such as marketing, R&D, and administrative overhead.
8. Earnings Per Share
Revenue trends explain a company’s historical growth, but the long-term change in earnings per share (EPS) points to the profitability of that growth – for example, a company could inflate its sales through excessive spending on advertising and promotions.
Armstrong World’s EPS grew at a spectacular 15% compounded annual growth rate over the last five years, higher than its 11.6% annualized revenue growth. This tells us the company became more profitable on a per-share basis as it expanded.
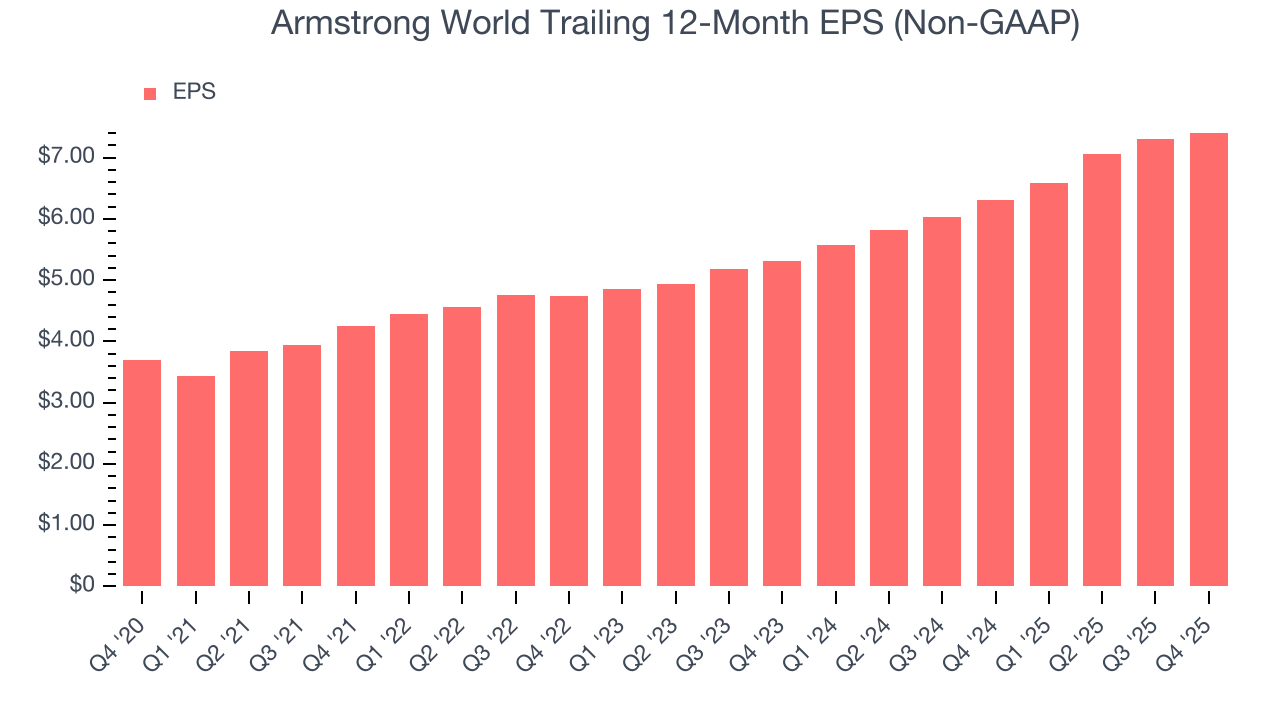
Diving into the nuances of Armstrong World’s earnings can give us a better understanding of its performance. As we mentioned earlier, Armstrong World’s operating margin expanded by 3.1 percentage points over the last five years. On top of that, its share count shrank by 9.8%. These are positive signs for shareholders because improving profitability and share buybacks turbocharge EPS growth relative to revenue growth. 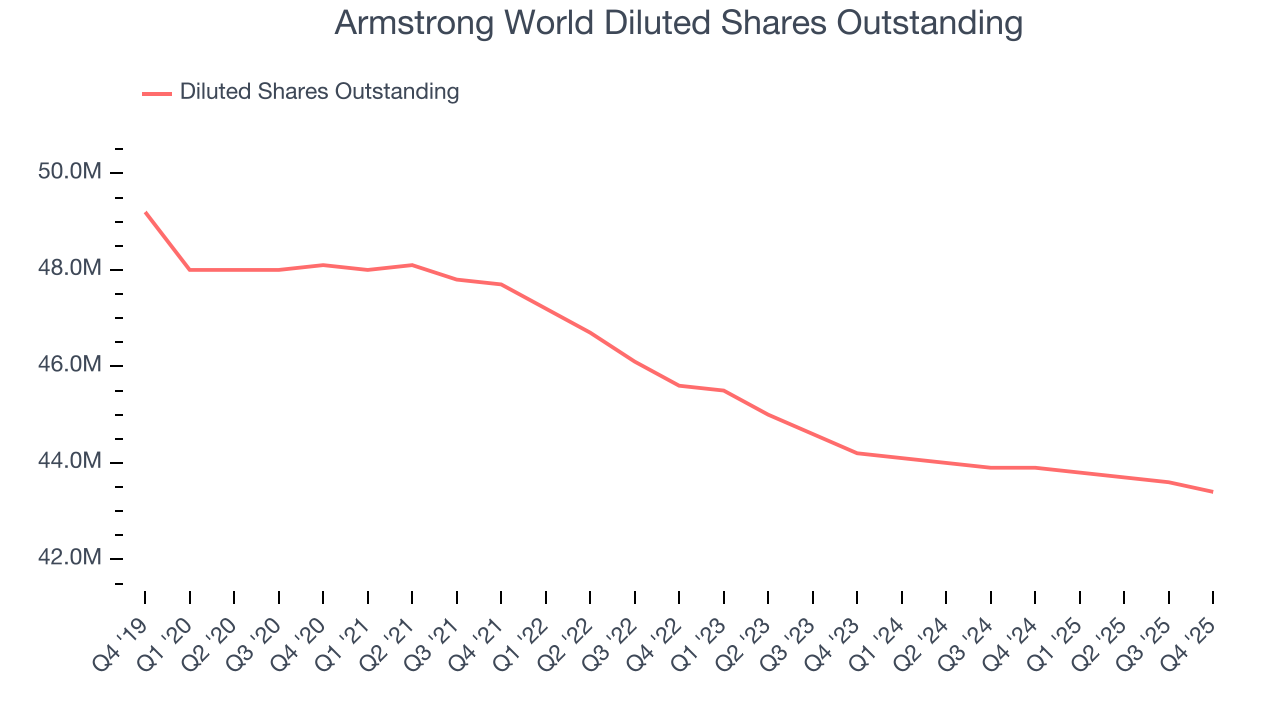
Like with revenue, we analyze EPS over a more recent period because it can provide insight into an emerging theme or development for the business.
For Armstrong World, its two-year annual EPS growth of 18% was higher than its five-year trend. We love it when earnings growth accelerates, especially when it accelerates off an already high base.
In Q4, Armstrong World reported adjusted EPS of $1.61, up from $1.50 in the same quarter last year. Despite growing year on year, this print missed analysts’ estimates, but we care more about long-term adjusted EPS growth than short-term movements. Over the next 12 months, Wall Street expects Armstrong World’s full-year EPS of $7.41 to grow 13.8%.
9. Cash Is King
Free cash flow isn't a prominently featured metric in company financials and earnings releases, but we think it's telling because it accounts for all operating and capital expenses, making it tough to manipulate. Cash is king.
Armstrong World has shown robust cash profitability, enabling it to comfortably ride out cyclical downturns while investing in plenty of new offerings and returning capital to investors. The company’s free cash flow margin averaged 12.2% over the last five years, quite impressive for an industrials business.
Taking a step back, we can see that Armstrong World’s margin expanded by 7 percentage points during that time. This is encouraging, and we can see it became a less capital-intensive business because its free cash flow profitability rose more than its operating profitability.
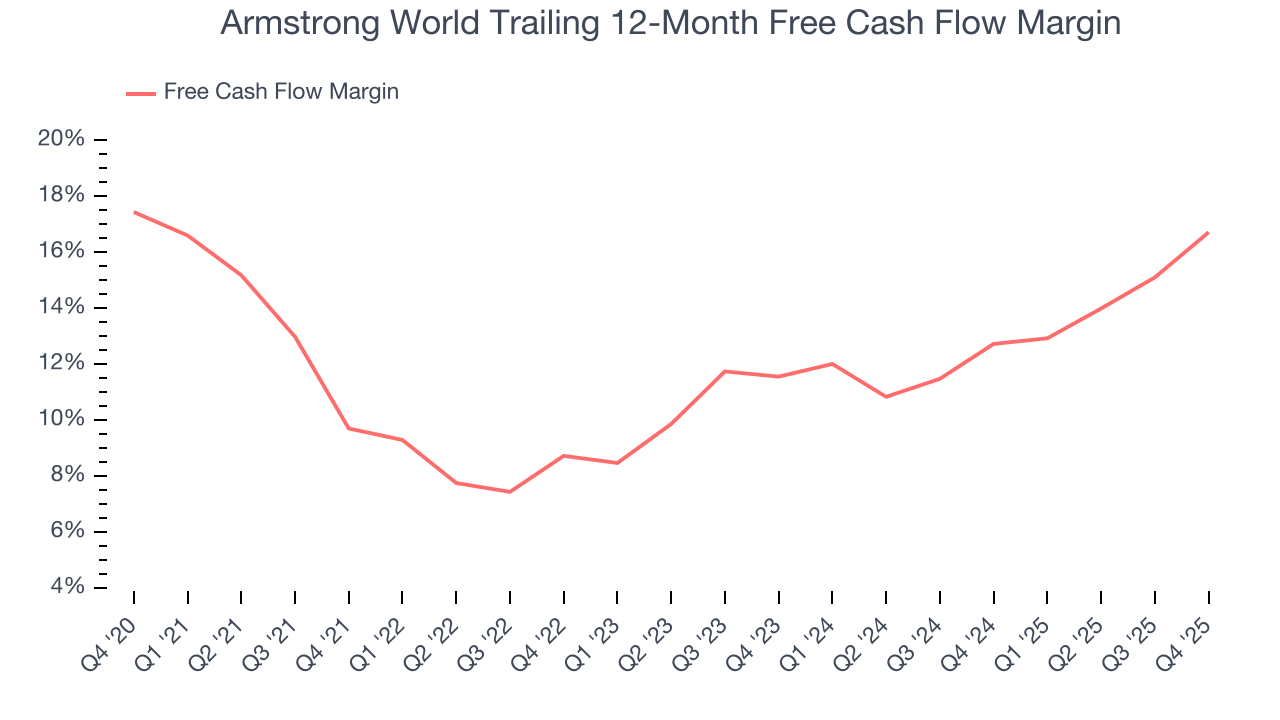
Armstrong World’s free cash flow clocked in at $87 million in Q4, equivalent to a 22.4% margin. This result was good as its margin was 6.7 percentage points higher than in the same quarter last year, building on its favorable historical trend.
10. Return on Invested Capital (ROIC)
EPS and free cash flow tell us whether a company was profitable while growing its revenue. But was it capital-efficient? Enter ROIC, a metric showing how much operating profit a company generates relative to the money it has raised (debt and equity).
Armstrong World’s five-year average ROIC was 22.9%, placing it among the best industrials companies. This illustrates its management team’s ability to invest in highly profitable ventures and produce tangible results for shareholders.
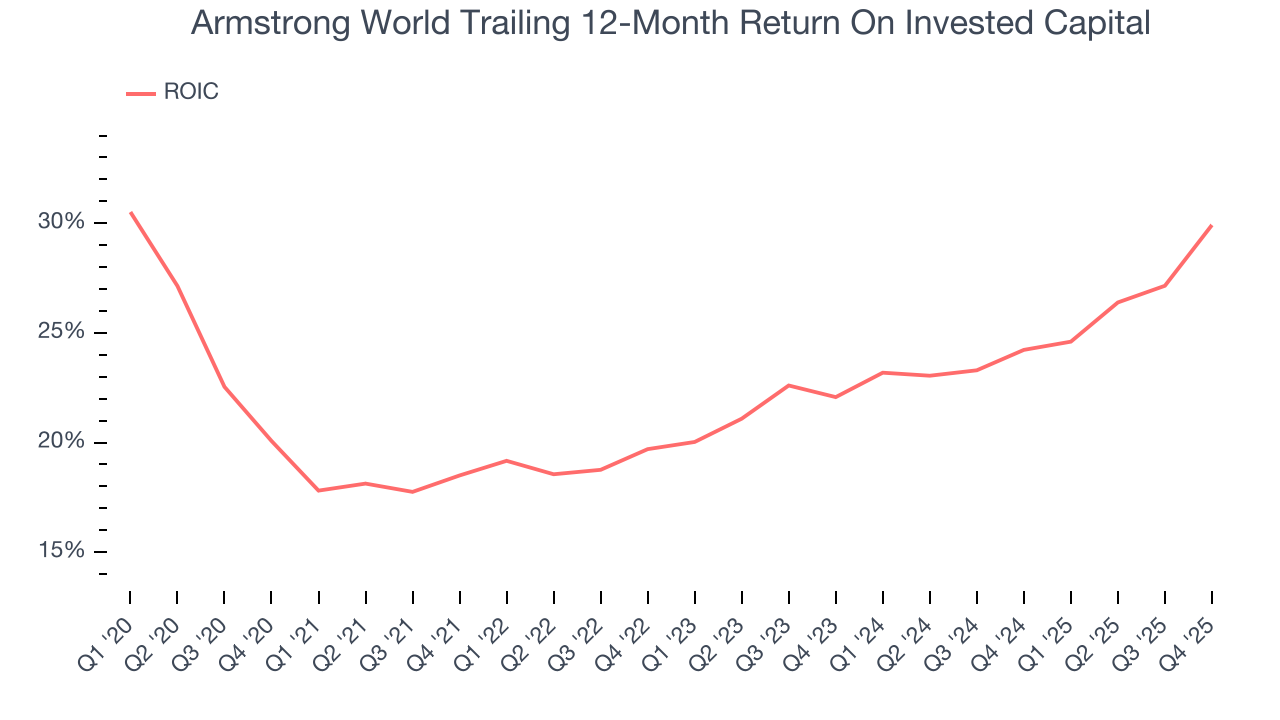
We like to invest in businesses with high returns, but the trend in a company’s ROIC is what often surprises the market and moves the stock price. Over the last few years, Armstrong World’s ROIC has increased. This is a great sign when paired with its already strong returns. It could suggest its competitive advantage or profitable growth opportunities are expanding.
11. Balance Sheet Assessment
Armstrong World reported $112.7 million of cash and $406.7 million of debt on its balance sheet in the most recent quarter. As investors in high-quality companies, we primarily focus on two things: 1) that a company’s debt level isn’t too high and 2) that its interest payments are not excessively burdening the business.
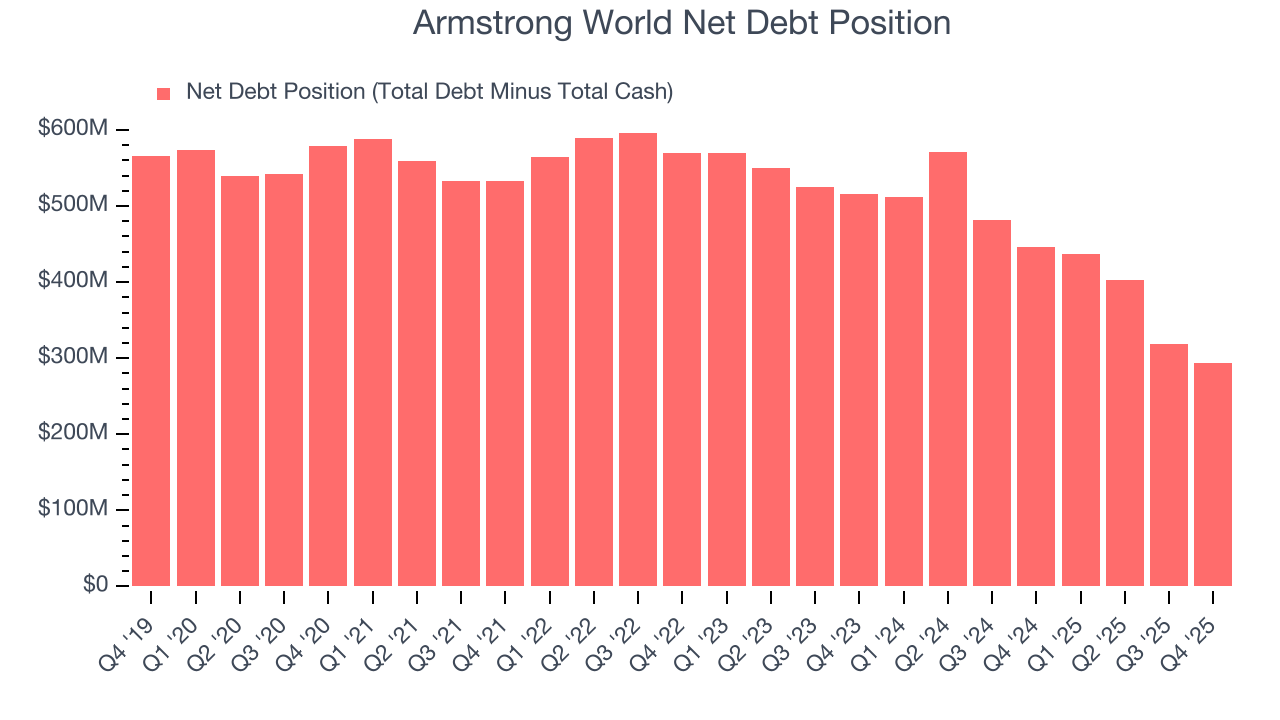
With $555 million of EBITDA over the last 12 months, we view Armstrong World’s 0.5× net-debt-to-EBITDA ratio as safe. We also see its $33 million of annual interest expenses as appropriate. The company’s profits give it plenty of breathing room, allowing it to continue investing in growth initiatives.
12. Key Takeaways from Armstrong World’s Q4 Results
It was good to see Armstrong World provide full-year revenue guidance that slightly beat analysts’ expectations. On the other hand, its revenue missed and its EPS fell short of Wall Street’s estimates. Overall, this was a softer quarter. The stock traded down 1.3% to $190.35 immediately after reporting.
13. Is Now The Time To Buy Armstrong World?
Updated: March 23, 2026 at 11:55 PM EDT
The latest quarterly earnings matters, sure, but we actually think longer-term fundamentals and valuation matter more. Investors should consider all these pieces before deciding whether or not to invest in Armstrong World.
Armstrong World is an amazing business ranking highly on our list. For starters, its revenue growth was impressive over the last five years. On top of that, its impressive operating margins show it has a highly efficient business model, and its rising cash profitability gives it more optionality.
Armstrong World’s P/E ratio based on the next 12 months is 19.7x. Scanning the industrials landscape today, Armstrong World’s fundamentals clearly illustrate that it’s an elite business, and we like it at this price.
Wall Street analysts have a consensus one-year price target of $208.80 on the company (compared to the current share price of $165.87), implying they see 25.9% upside in buying Armstrong World in the short term.