
Bank of America (BAC)
We’re cautious of Bank of America. Its sluggish sales growth shows demand is soft, a worrisome sign for investors in high-quality stocks.― StockStory Analyst Team
1. News


2. Summary
Why We Think Bank of America Will Underperform
Tracing its roots back to 1784 and now serving approximately 67 million consumer and small business clients, Bank of America (NYSE:BAC) is a global financial institution that provides banking, investing, asset management, and risk management products and services to individuals, businesses, and governments.
- Weak unit economics are reflected in its net interest margin of 2%, one of the worst among bank companies
- Estimated tangible book value per share growth of 6.3% for the next 12 months implies profitability will slow from its two-year trend
- On the plus side, its incremental sales over the last five years have been more profitable as its earnings per share increased by 15.4% annually, topping its revenue gains


Bank of America’s quality is inadequate. There are more rewarding stocks elsewhere.
Why There Are Better Opportunities Than Bank of America


At $46.71 per share, Bank of America trades at 1.2x forward P/B. The current valuation may be appropriate, but we’re still not buyers of the stock.
We prefer to invest in similarly-priced but higher-quality companies with superior earnings growth.
3. Bank of America (BAC) Research Report: Q4 CY2025 Update
Financial services giant Bank of America (NYSE:BAC) reported Q4 CY2025 results exceeding the market’s revenue expectations, with sales up 6.5% year on year to $28.37 billion. Its GAAP profit of $0.98 per share was 2.2% above analysts’ consensus estimates.
Bank of America (BAC) Q4 CY2025 Highlights:
- Net Interest Income: $15.75 billion vs analyst estimates of $15.68 billion (9.7% year-on-year growth, in line)
- Net Interest Margin: 2.1% vs analyst estimates of 2% (4.1 basis point beat)
- Revenue: $28.37 billion vs analyst estimates of $27.59 billion (6.5% year-on-year growth, 2.8% beat)
- Efficiency Ratio: 61.5% vs analyst estimates of 62.7% (127.7 basis point beat)
- EPS (GAAP): $0.98 vs analyst estimates of $0.96 (2.2% beat)
- Tangible Book Value per Share: $28.73 vs analyst estimates of $28.66 (7.5% year-on-year growth, in line)
- Market Capitalization: $398.3 billion
Company Overview
Tracing its roots back to 1784 and now serving approximately 67 million consumer and small business clients, Bank of America (NYSE:BAC) is a global financial institution that provides banking, investing, asset management, and risk management products and services to individuals, businesses, and governments.
Bank of America operates through four main segments: Consumer Banking, Global Wealth & Investment Management, Global Banking, and Global Markets. The Consumer Banking division offers traditional deposit accounts, credit cards, mortgages, and personal loans to approximately 67 million consumer and small business clients through a network of financial centers, ATMs, and digital platforms. Its Global Wealth & Investment Management segment provides investment advisory, brokerage, and financial planning services primarily to clients with over $250,000 in investable assets.
The Global Banking segment serves mid-market companies, large corporations, and institutions with commercial loans, treasury management, and investment banking services including debt and equity underwriting. Meanwhile, the Global Markets division offers sales and trading services across fixed-income, credit, currency, commodity, and equity businesses to institutional clients.
A typical consumer might use Bank of America's mobile app to deposit a check, transfer money between accounts, and pay bills, while a corporate client might work with the bank to secure financing for an expansion or manage international currency transactions. The bank generates revenue through interest on loans, fees for banking services, investment management charges, and trading activities.
Bank of America maintains a significant presence across the United States with financial centers in 38 states and the District of Columbia, while also operating in more than 35 countries internationally. As a systemically important financial institution, it faces comprehensive regulation from entities including the Federal Reserve, the Office of the Comptroller of the Currency, and various international regulatory bodies.
4. Diversified Banks
At their core, diversified banks take in deposits and engage in various forms of lending, which means revenue is generated through interest rate spreads (difference between loan and deposit rates) and fees. Other revenue comes from adjacent services such as wealth management, card and account fees, and products such as annuities. These institutions benefit from rising interest rates that improve NIMs (net interest margins), digital transformation reducing operational costs, and expanding wealth management services as populations age. However, they face headwinds including fintech competition disrupting traditional models (how disruptive is crypto?), stringent regulatory requirements increasing compliance costs, and cybersecurity threats requiring substantial technology investments. Economic downturns also pose risks through potential loan defaults and compressed margins during accommodative monetary policy periods.
Bank of America's primary competitors include other major U.S. financial institutions such as JPMorgan Chase (NYSE:JPM), Citigroup (NYSE:C), and Wells Fargo (NYSE:WFC), along with investment banking rivals like Goldman Sachs (NYSE:GS) and Morgan Stanley (NYSE:MS).
5. Sales Growth
In general, banks make money from two primary sources. The first is net interest income, which is interest earned on loans, mortgages, and investments in securities minus interest paid out on deposits. The second source is non-interest income, which can come from bank account, credit card, wealth management, investing banking, and trading fees. Over the last five years, Bank of America grew its revenue at a sluggish 5.7% compounded annual growth rate. This fell short of our benchmark for the banking sector and is a poor baseline for our analysis.
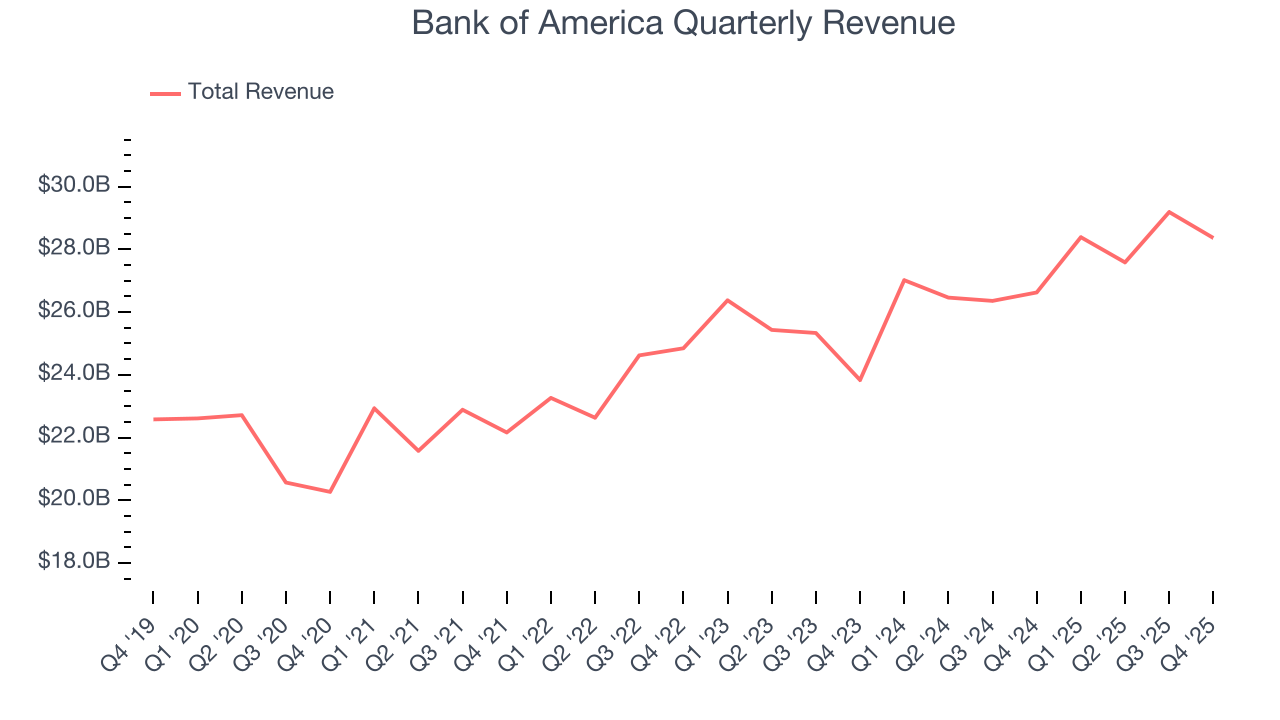
We at StockStory place the most emphasis on long-term growth, but within financials, a half-decade historical view may miss recent interest rate changes, market returns, and industry trends. Bank of America’s annualized revenue growth of 6% over the last two years aligns with its five-year trend, suggesting its demand was consistently weak. 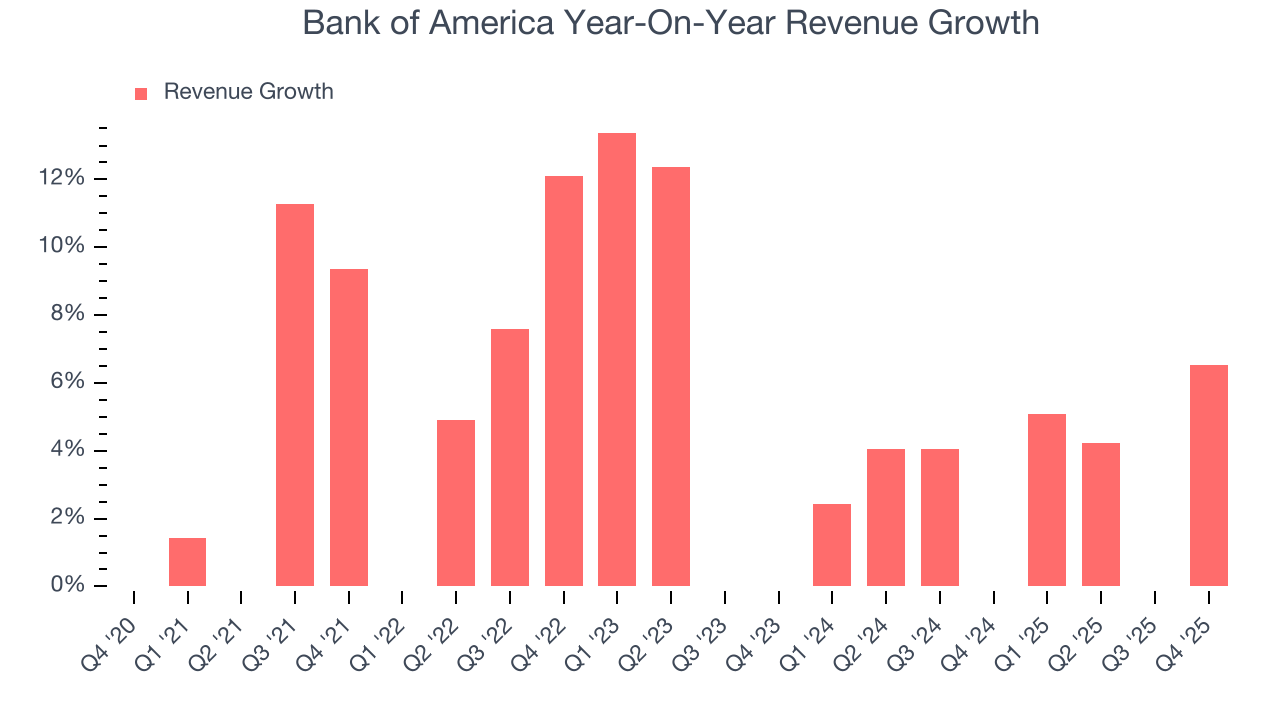 Note: Quarters not shown were determined to be outliers, impacted by outsized investment gains/losses that are not indicative of the recurring fundamentals of the business.
This quarter, Bank of America reported year-on-year revenue growth of 6.5%, and its $28.37 billion of revenue exceeded Wall Street’s estimates by 2.8%.
Net interest income made up 53% of the company’s total revenue during the last five years, meaning Bank of America’s growth drivers strike a balance between lending and non-lending activities.
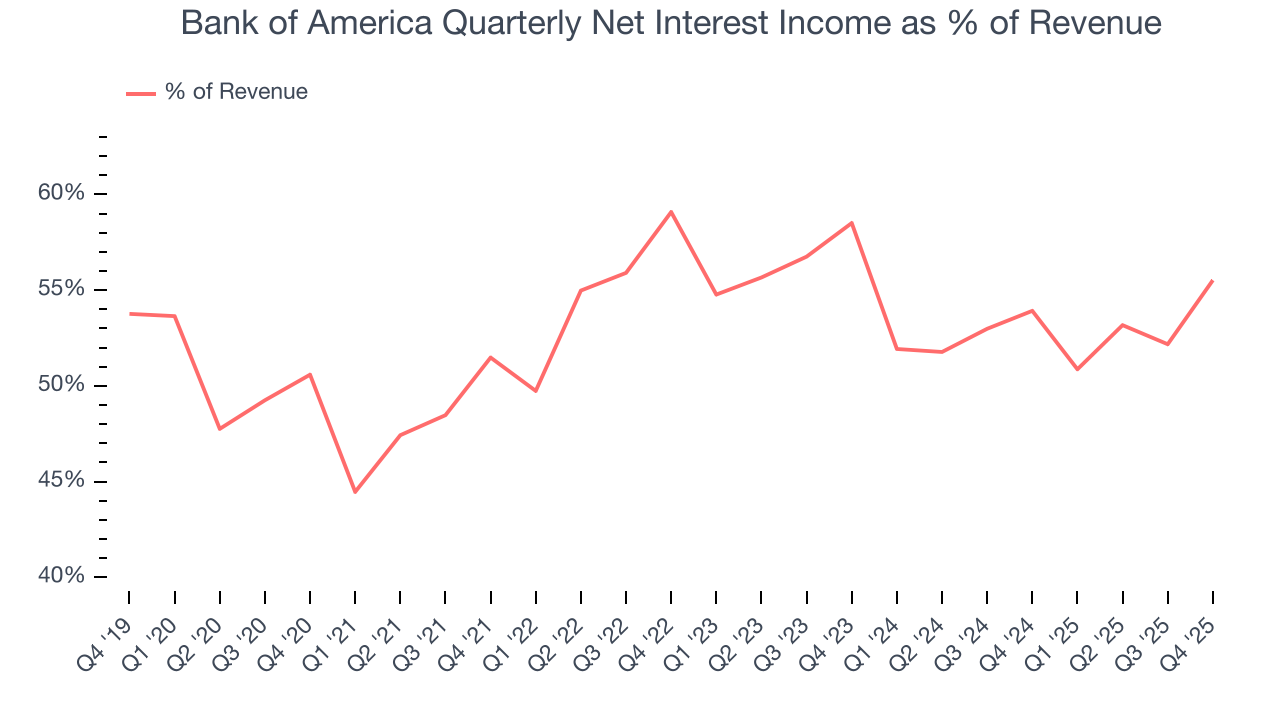
Our experience and research show the market cares primarily about a bank’s net interest income growth as non-interest income is considered a lower-quality and non-recurring revenue source.
6. Efficiency Ratio
Topline growth carries importance, but the overall profitability behind this expansion determines true value creation. For banks, the efficiency ratio captures this relationship by measuring non-interest expenses, including salaries, facilities, technology, and marketing, against total revenue.
Markets understand that a bank’s expense base depends on its revenue mix and what mostly drives share price performance is the change in this ratio, rather than its absolute value. It’s somewhat counterintuitive, but a lower efficiency ratio is better.
Over the last five years, Bank of America’s efficiency ratio couldn’t build momentum, hanging around 63.3%.
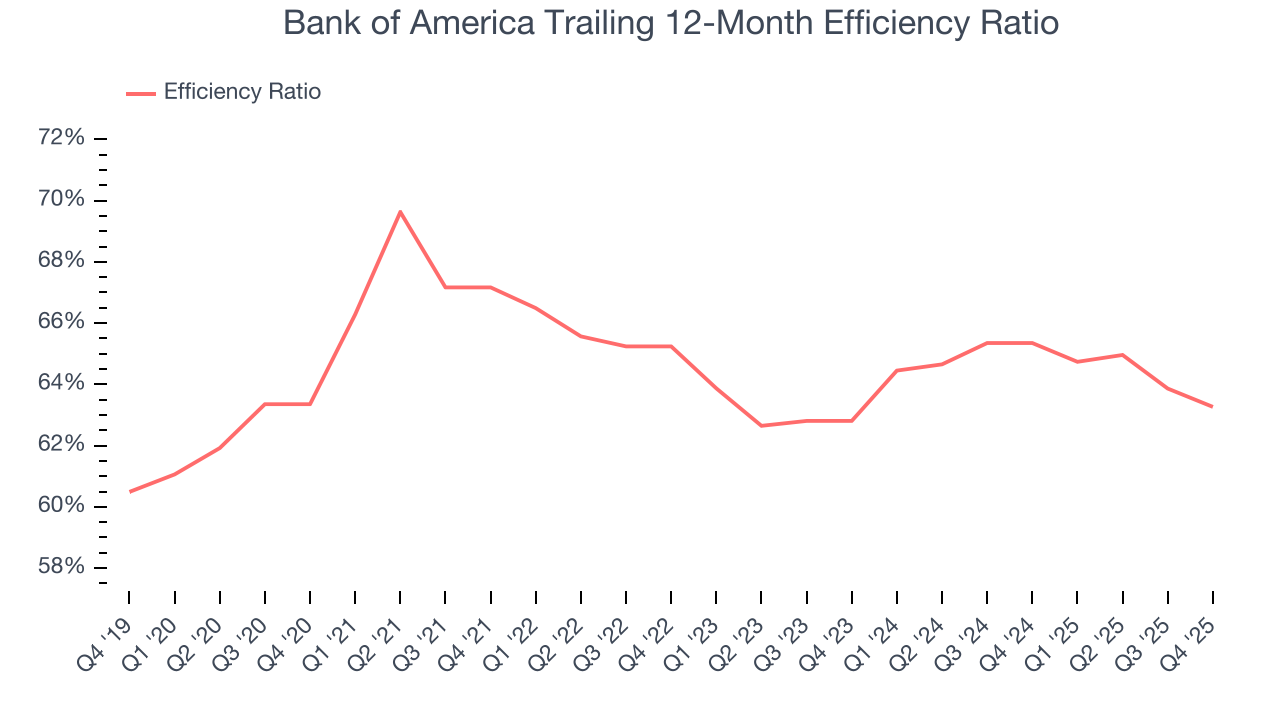
Bank of America’s efficiency ratio came in at 61.5% this quarter, beating analysts’ expectations by 127.7 basis points (100 basis points = 1 percentage point).
For the next 12 months, Wall Street expects Bank of America to rein in some of its expenses as it anticipates an efficiency ratio of 61.3%.
7. Earnings Per Share
Revenue trends explain a company’s historical growth, but the long-term change in earnings per share (EPS) points to the profitability of that growth – for example, a company could inflate its sales through excessive spending on advertising and promotions.
Bank of America’s EPS grew at a spectacular 15.3% compounded annual growth rate over the last five years, higher than its 5.7% annualized revenue growth. However, this alone doesn’t tell us much about its business quality because its efficiency ratio didn’t improve.
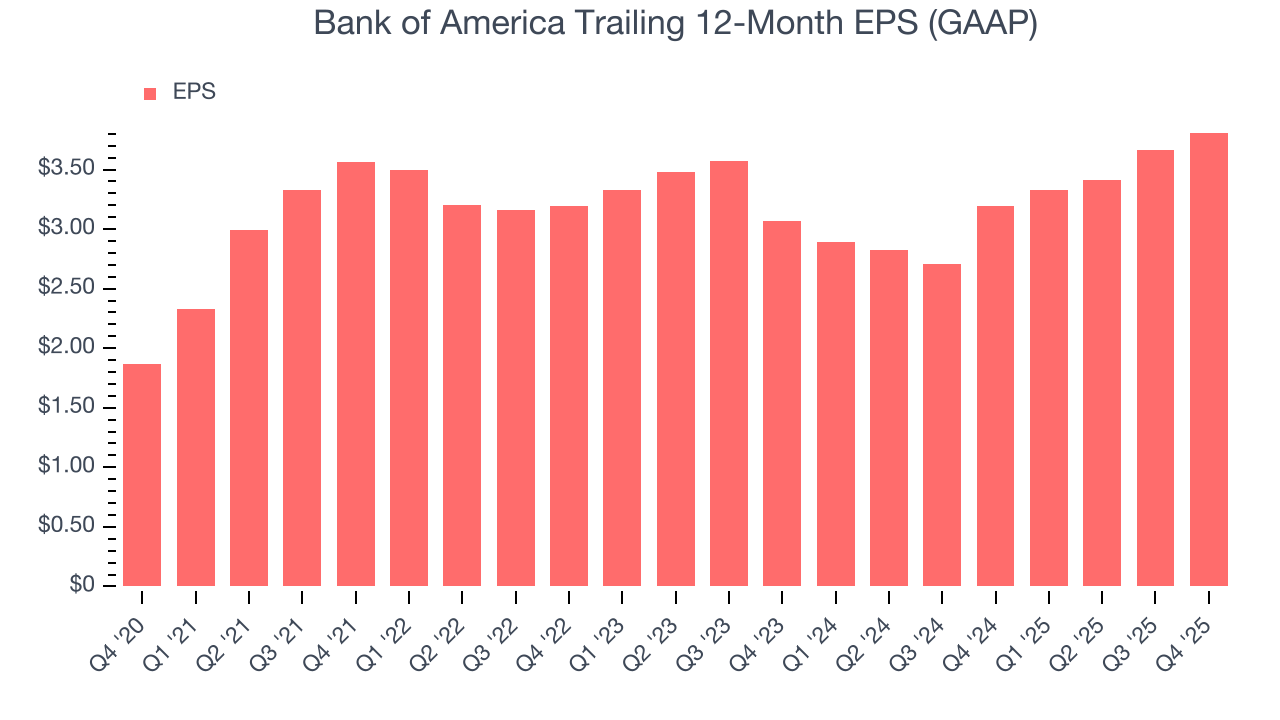
Like with revenue, we analyze EPS over a shorter period to see if we are missing a change in the business.
For Bank of America, its two-year annual EPS growth of 11.4% was lower than its five-year trend. We hope its growth can accelerate in the future.
In Q4, Bank of America reported EPS of $0.98, up from $0.83 in the same quarter last year. This print beat analysts’ estimates by 2.2%. Over the next 12 months, Wall Street expects Bank of America’s full-year EPS of $3.81 to grow 13.7%.
8. Tangible Book Value Per Share (TBVPS)
Banks are balance sheet-driven businesses because they generate earnings primarily through borrowing and lending. They’re also valued based on their balance sheet strength and ability to compound book value (another name for shareholders’ equity) over time.
Because of this, tangible book value per share (TBVPS) emerges as the critical performance benchmark. By excluding intangible assets with uncertain liquidation values, this metric captures real, liquid net worth per share. On the other hand, EPS is often distorted by mergers and flexible loan loss accounting. TBVPS provides clearer performance insights.
Bank of America’s TBVPS grew at a solid 6.7% annual clip over the last five years. TBVPS growth has also accelerated recently, growing by 8.1% annually over the last two years from $24.60 to $28.73 per share.
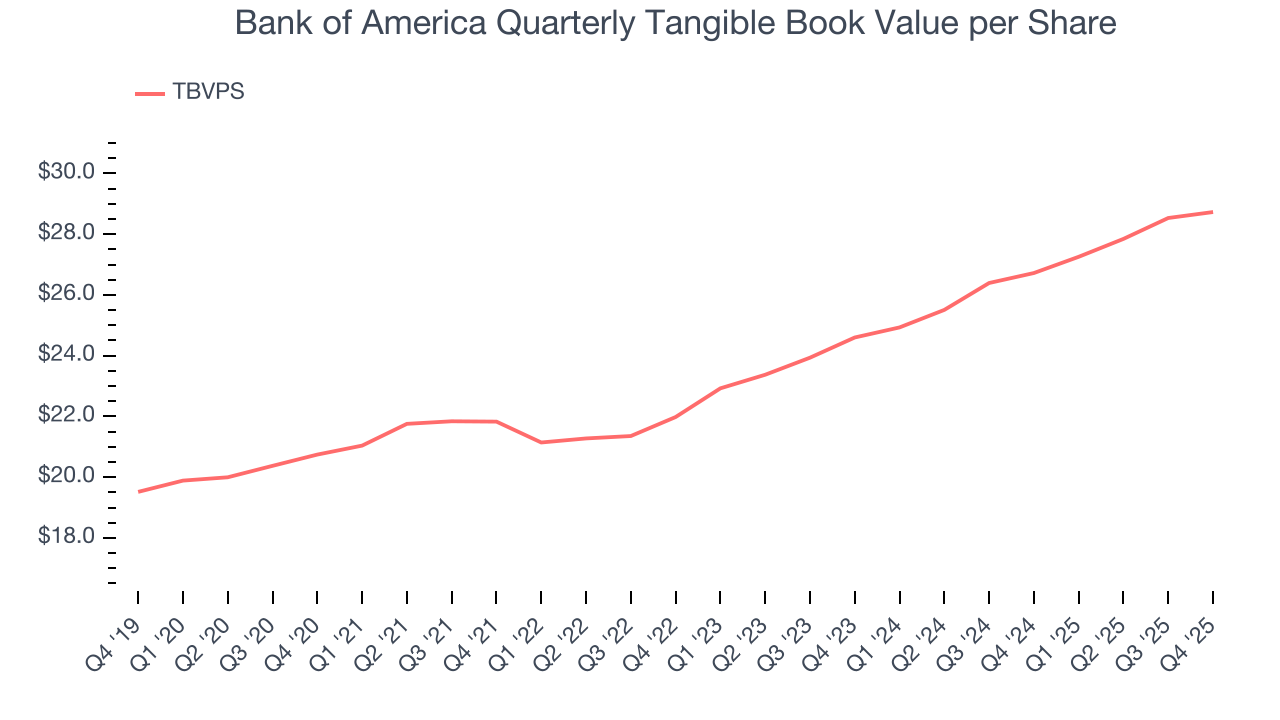
Over the next 12 months, Consensus estimates call for Bank of America’s TBVPS to grow by 6.3% to $30.55, lousy growth rate.
9. Balance Sheet Assessment
Leverage is core to a financial firm’s business model (loans funded by deposits). To ensure economic stability and avoid a repeat of the 2008 GFC, regulators require certain levels of capital and liquidity, focusing on the Tier 1 capital ratio.
Tier 1 capital is the highest-quality capital that a firm holds, consisting primarily of common stock and retained earnings, but also physical gold. It serves as the primary cushion against losses and is the first line of defense in times of financial distress.
This capital is divided by risk-weighted assets to derive the Tier 1 capital ratio. Risk-weighted means that cash and US treasury securities are assigned little risk while unsecured consumer loans and equity investments get much higher risk weights, for example.
New regulation after the 2008 financial crisis requires that all firms must maintain a Tier 1 capital ratio greater than 4.5%. On top of this, there are additional buffers based on scale, risk profile, and other regulatory classifications, so that at the end of the day, firms generally must maintain a 7-10% ratio at minimum.
Over the last two years, Bank of America has averaged a Tier 1 capital ratio of 13.1%, which is considered safe and well capitalized in the event that macro or market conditions suddenly deteriorate.
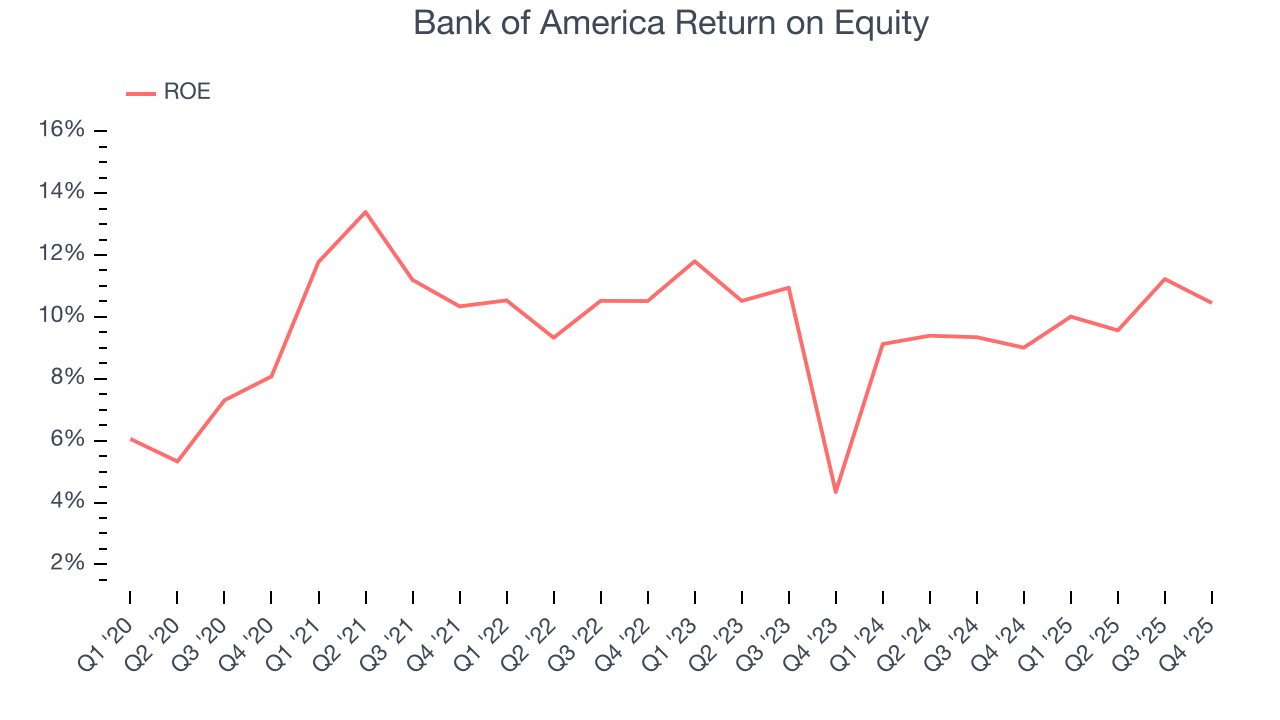
10. Return on Equity
Return on equity, or ROE, tells us how much profit a company generates for each dollar of shareholder equity, a key funding source for banks. Over a long period, banks with high ROE tend to compound shareholder wealth faster through retained earnings, buybacks, and dividends.
Over the last five years, Bank of America has averaged an ROE of 10.2%, respectable for a company operating in a sector where the average shakes out around 7.5% and those putting up 15%+ are greatly admired.
11. Key Takeaways from Bank of America’s Q4 Results
We enjoyed seeing Bank of America beat analysts’ revenue expectations this quarter. With higher net interest margin and a better-than-expected efficiency ratio, EPS also exceeded expectations. Zooming out, we think this was a solid quarter. The stock traded up 1.3% to $55.06 immediately after reporting.
12. Is Now The Time To Buy Bank of America?
Updated: March 16, 2026 at 12:54 AM EDT
Before making an investment decision, investors should account for Bank of America’s business fundamentals and valuation in addition to what happened in the latest quarter.
Bank of America isn’t a terrible business, but it doesn’t pass our quality test. To kick things off, its revenue growth was uninspiring over the last five years, and analysts don’t see anything changing over the next 12 months. While its spectacular EPS growth over the last five years shows its profits are trickling down to shareholders, the downside is its net interest margin limits its operating profit potential compared to other banks that can earn more, all else equal.. On top of that, its estimated sales for the next 12 months are weak.
Bank of America’s P/B ratio based on the next 12 months is 1.2x. While this valuation is fair, the upside isn’t great compared to the potential downside. We're fairly confident there are better stocks to buy right now.
Wall Street analysts have a consensus one-year price target of $62.19 on the company (compared to the current share price of $46.71).
Although the price target is bullish, readers should exercise caution because analysts tend to be overly optimistic. The firms they work for, often big banks, have relationships with companies that extend into fundraising, M&A advisory, and other rewarding business lines. As a result, they typically hesitate to say bad things for fear they will lose out. We at StockStory do not suffer from such conflicts of interest, so we’ll always tell it like it is.