
Ball (BALL)
Ball faces an uphill battle. Its weak sales growth and low returns on capital show it struggled to generate demand and profits.― StockStory Analyst Team
1. News


2. Summary
Why We Think Ball Will Underperform
Started with a $200 loan in 1880, Ball (NYSE:BLL) manufactures aluminum packaging for beverages, personal care, and household products as well as aerospace systems and other technologies.
- Products and services are facing significant end-market challenges during this cycle as sales have declined by 3.1% annually over the last two years
- Lacking free cash flow limits its freedom to invest in growth initiatives, execute share buybacks, or pay dividends
- Competitive supply chain dynamics and steep production costs are reflected in its low gross margin of 21.4%


Ball doesn’t live up to our standards. We’ve identified better opportunities elsewhere.
Why There Are Better Opportunities Than Ball


Ball is trading at $62.20 per share, or 15.5x forward P/E. Ball’s multiple may seem like a great deal among industrials peers, but we think there are valid reasons why it’s this cheap.
It’s better to pay up for high-quality businesses with higher long-term earnings potential rather than to buy lower-quality stocks because they appear cheap. These challenged businesses often don’t re-rate, a phenomenon known as a “value trap”.
3. Ball (BALL) Research Report: Q4 CY2025 Update
Packaging manufacturer Ball (NYSE:BLL) reported Q4 CY2025 results topping the market’s revenue expectations, with sales up 16.2% year on year to $3.35 billion. Its non-GAAP profit of $0.91 per share was 1.5% above analysts’ consensus estimates.
Ball (BALL) Q4 CY2025 Highlights:
- Revenue: $3.35 billion vs analyst estimates of $3.12 billion (16.2% year-on-year growth, 7.3% beat)
- Adjusted EPS: $0.91 vs analyst estimates of $0.90 (1.5% beat)
- Adjusted EBITDA: $639 million vs analyst estimates of $500.8 million (19.1% margin, 27.6% beat)
- Operating Margin: 23.8%, up from 2.2% in the same quarter last year
- Free Cash Flow Margin: 31.1%, up from 13.6% in the same quarter last year
- Market Capitalization: $15.19 billion
Company Overview
Started with a $200 loan in 1880, Ball (NYSE:BLL) manufactures aluminum packaging for beverages, personal care, and household products as well as aerospace systems and other technologies.
Ball originally manufactured wooden-jacketed tin cans for products such as paint and kerosene and has since evolved to provide glass manufacturing and aerospace technologies through a range of acquisitions.
In its aluminum packaging and glass manufacturing business lines, the company mainly serves the beverage, personal care, and household products industries by creating aerosol containers and cans and bottles for soft drinks, beer, and energy drinks. On the aerospace side, the company operates Ball Aerospace, which designs and manufactures systems for commercial and government customers.
Ball sells its products worldwide through direct sales and distribution networks, targeting beverage manufacturers, consumer product companies, and government agencies for aerospace contracts. Its cost structure includes significant fixed costs related to manufacturing facilities and equipment, balanced by variable costs such as raw materials and labor. Revenue is largely recurring due to ongoing customer demand for packaging products and multi-year aerospace contracts, providing a steady flow of income.
4. Industrial Packaging
Industrial packaging companies have built competitive advantages from economies of scale that lead to advantaged purchasing and capital investments that are difficult and expensive to replicate. Recently, eco-friendly packaging and conservation are driving customers preferences and innovation. For example, plastic is not as desirable a material as it once was. Despite being integral to consumer goods ranging from beer to toothpaste to laundry detergent, these companies are still at the whim of the macro, especially consumer health and consumer willingness to spend.
Competitors in the packaging industry include Crown Holdings (NYSE:CCK), Ardagh Group (NYSE:ARD), and Silgan Holdings (NASDAQ:SLGN) while competitors in the aerospace industry consist of Lockheed Martin (NYSE:LMT), Boeing (NYSE:BA), Northrop Grumman (NYSE:NOC), and Raytheon (NYSE:RTX).
5. Revenue Growth
A company’s long-term performance is an indicator of its overall quality. Even a bad business can shine for one or two quarters, but a top-tier one grows for years. Unfortunately, Ball’s 2.2% annualized revenue growth over the last five years was sluggish. This was below our standards and is a rough starting point for our analysis.
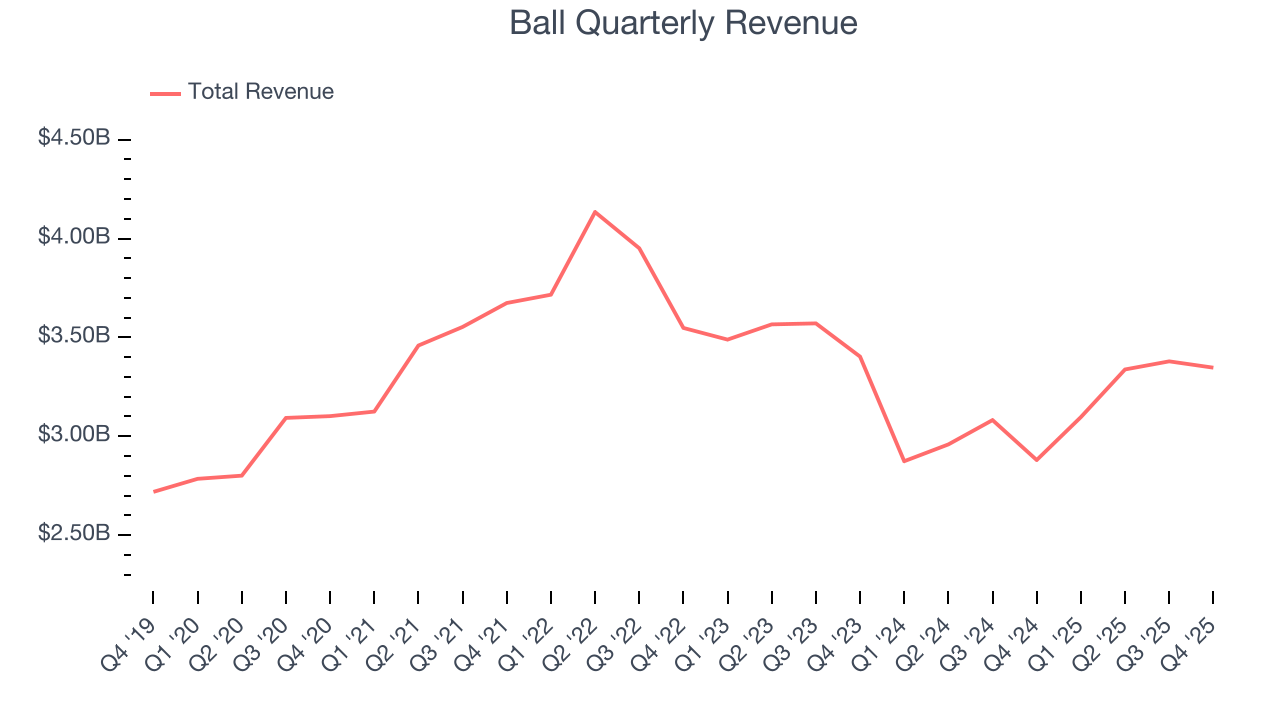
We at StockStory place the most emphasis on long-term growth, but within industrials, a half-decade historical view may miss cycles, industry trends, or a company capitalizing on catalysts such as a new contract win or a successful product line. Ball’s performance shows it grew in the past but relinquished its gains over the last two years, as its revenue fell by 3.1% annually. 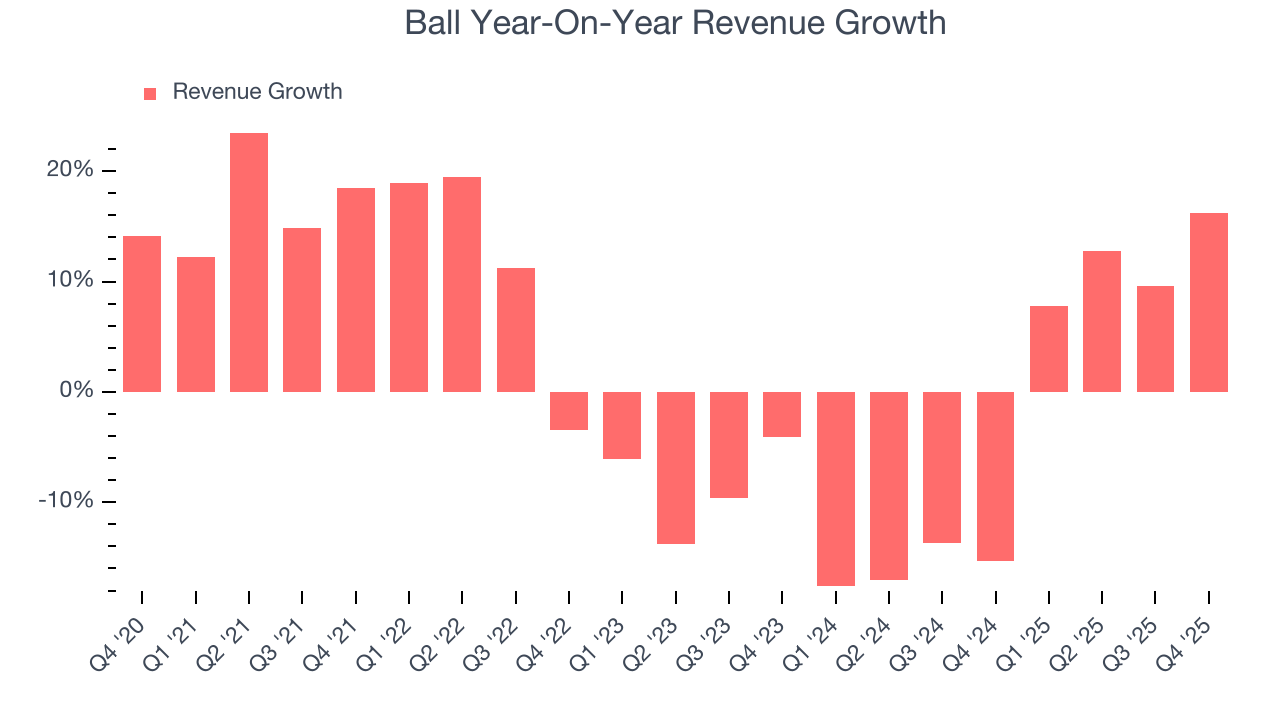
This quarter, Ball reported year-on-year revenue growth of 16.2%, and its $3.35 billion of revenue exceeded Wall Street’s estimates by 7.3%.
Looking ahead, sell-side analysts expect revenue to grow 2.7% over the next 12 months. While this projection suggests its newer products and services will spur better top-line performance, it is still below average for the sector.
6. Gross Margin & Pricing Power
Cost of sales for an industrials business is usually comprised of the direct labor, raw materials, and supplies needed to offer a product or service. These costs can be impacted by inflation and supply chain dynamics.
Ball has bad unit economics for an industrials business, signaling it operates in a competitive market. As you can see below, it averaged a 21.4% gross margin over the last five years. Said differently, Ball had to pay a chunky $78.57 to its suppliers for every $100 in revenue. 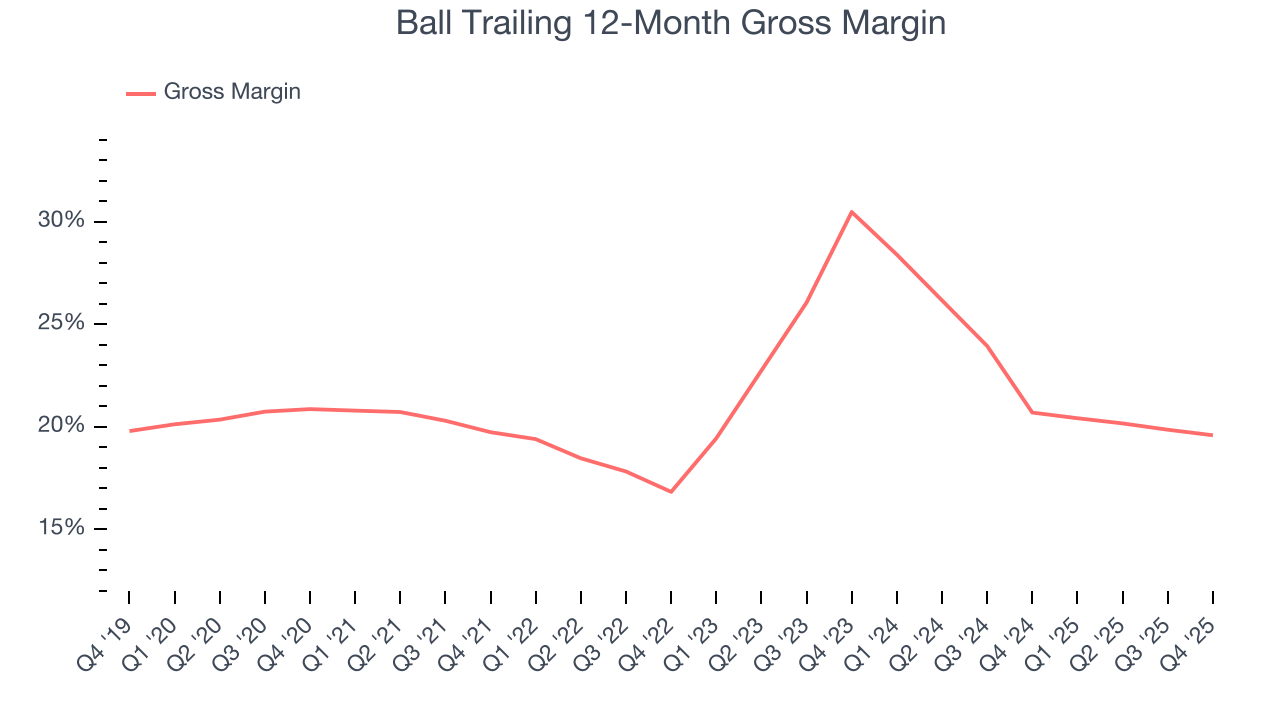
In Q4, Ball produced a 19.4% gross profit margin, marking a 1.2 percentage point decrease from 20.5% in the same quarter last year. Ball’s full-year margin has also been trending down over the past 12 months, decreasing by 1.1 percentage points. If this move continues, it could suggest a more competitive environment with some pressure to lower prices and higher input costs (such as raw materials and manufacturing expenses).
7. Operating Margin
Operating margin is a key measure of profitability. Think of it as net income - the bottom line - excluding the impact of taxes and interest on debt, which are less connected to business fundamentals.
Ball has done a decent job managing its cost base over the last five years. The company has produced an average operating margin of 9.4%, higher than the broader industrials sector.
Looking at the trend in its profitability, Ball’s operating margin rose by 5.1 percentage points over the last five years, as its sales growth gave it operating leverage. Its expansion was impressive, especially when considering most Industrial Packaging peers saw their margins plummet.
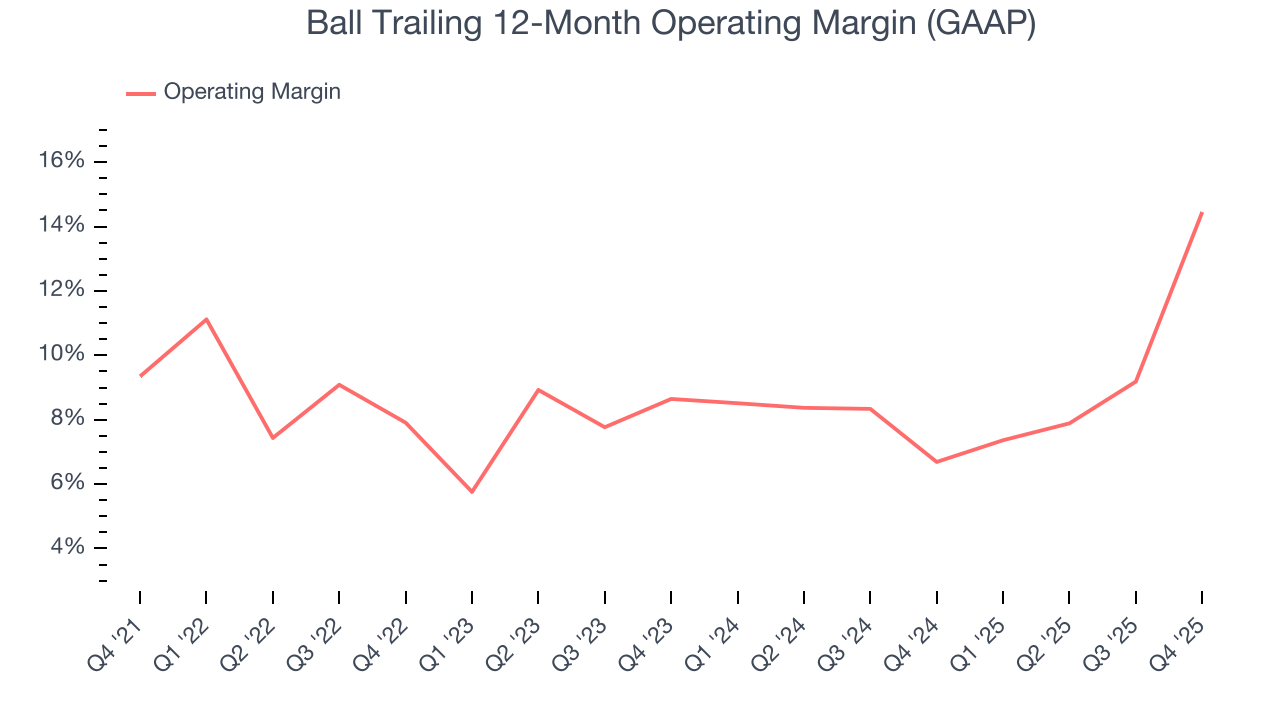
In Q4, Ball generated an operating margin profit margin of 23.8%, up 21.7 percentage points year on year. The increase was solid, and because its gross margin actually decreased, we can assume it was more efficient because its operating expenses like marketing, R&D, and administrative overhead grew slower than its revenue.
8. Earnings Per Share
Revenue trends explain a company’s historical growth, but the long-term change in earnings per share (EPS) points to the profitability of that growth – for example, a company could inflate its sales through excessive spending on advertising and promotions.
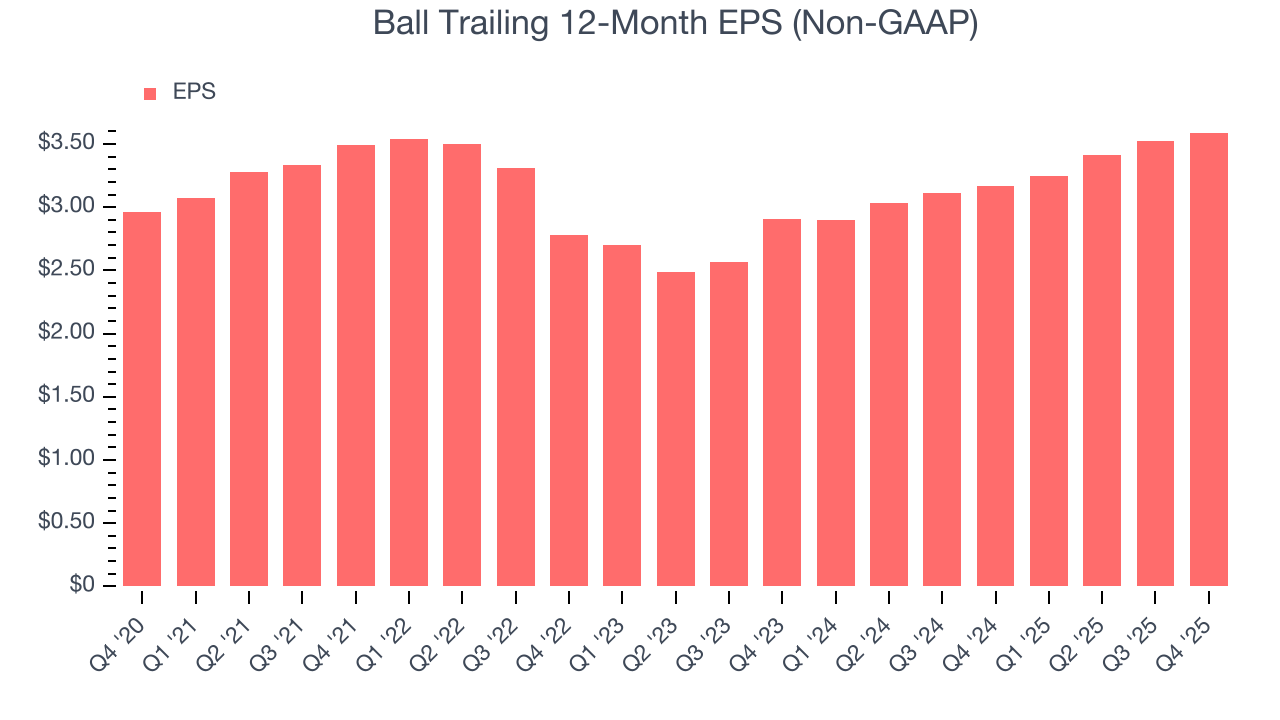
Ball’s weak 3.9% annual EPS growth over the last five years aligns with its revenue performance. On the bright side, this tells us its incremental sales were profitable.
Like with revenue, we analyze EPS over a shorter period to see if we are missing a change in the business.
Ball’s two-year annual EPS growth of 11.1% was good and topped its two-year revenue performance.
We can take a deeper look into Ball’s earnings to better understand the drivers of its performance. Ball’s operating margin has expanded over the last two yearswhile its share count has shrunk 15.4%. Improving profitability and share buybacks are positive signs for shareholders as they juice EPS growth relative to revenue growth. 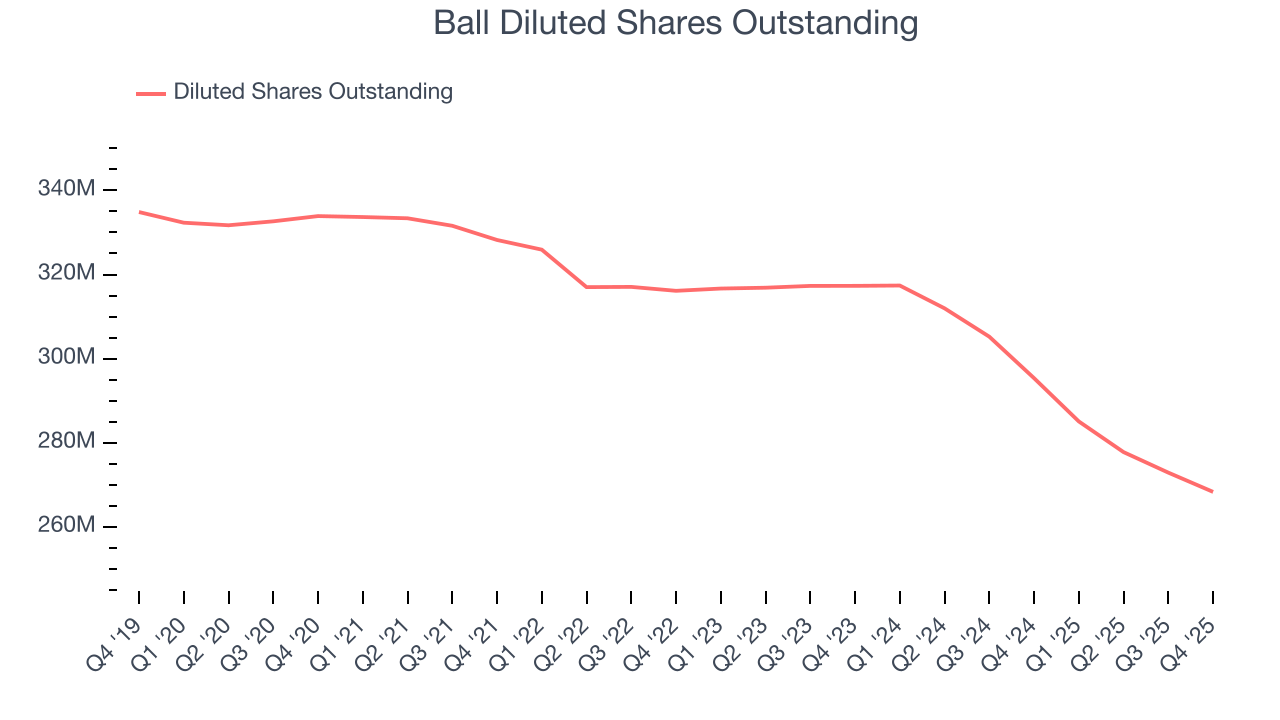
In Q4, Ball reported adjusted EPS of $0.91, up from $0.84 in the same quarter last year. This print beat analysts’ estimates by 1.5%. Over the next 12 months, Wall Street expects Ball’s full-year EPS of $3.59 to grow 10.5%.
9. Cash Is King
If you’ve followed StockStory for a while, you know we emphasize free cash flow. Why, you ask? We believe that in the end, cash is king, and you can’t use accounting profits to pay the bills.
Ball broke even from a free cash flow perspective over the last five years, giving the company limited opportunities to return capital to shareholders.
Taking a step back, an encouraging sign is that Ball’s margin expanded by 5.7 percentage points during that time. We have no doubt shareholders would like to continue seeing its cash conversion rise as it gives the company more optionality.
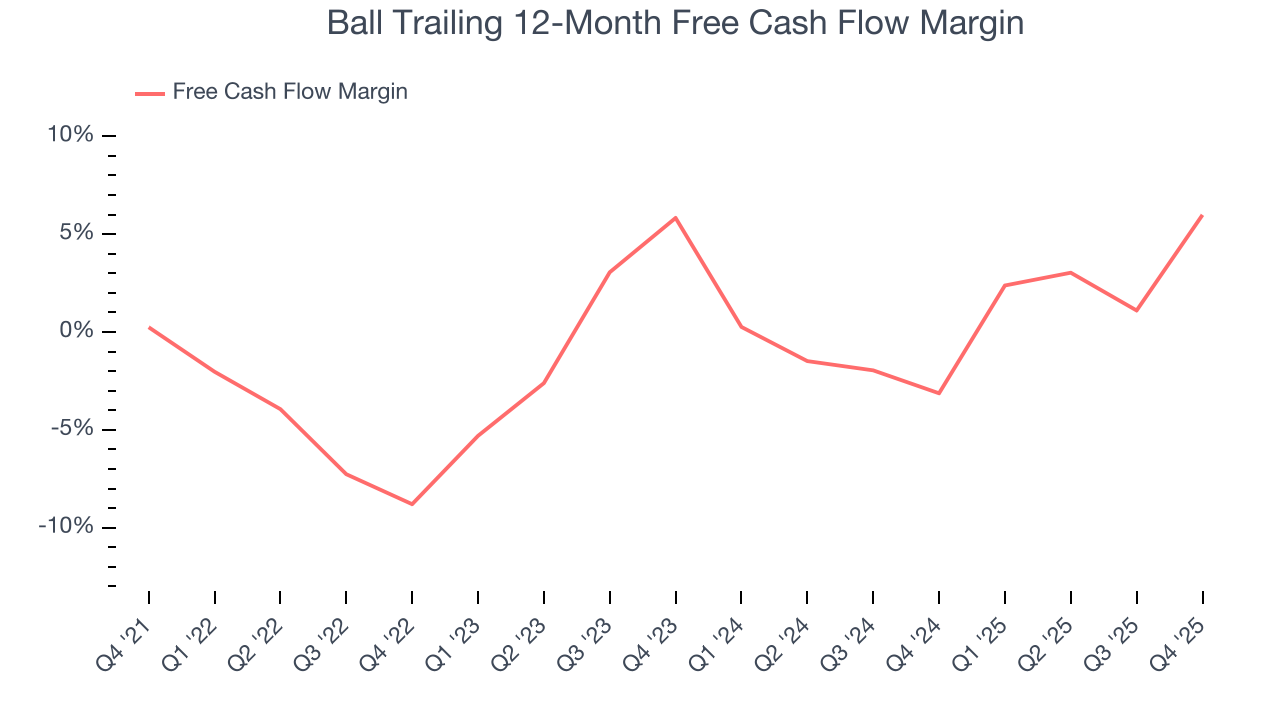
Ball’s free cash flow clocked in at $1.04 billion in Q4, equivalent to a 31.1% margin. This result was good as its margin was 17.5 percentage points higher than in the same quarter last year, building on its favorable historical trend.
10. Return on Invested Capital (ROIC)
EPS and free cash flow tell us whether a company was profitable while growing its revenue. But was it capital-efficient? A company’s ROIC explains this by showing how much operating profit it makes compared to the money it has raised (debt and equity).
Ball historically did a mediocre job investing in profitable growth initiatives. Its five-year average ROIC was 9.8%, somewhat low compared to the best industrials companies that consistently pump out 20%+.
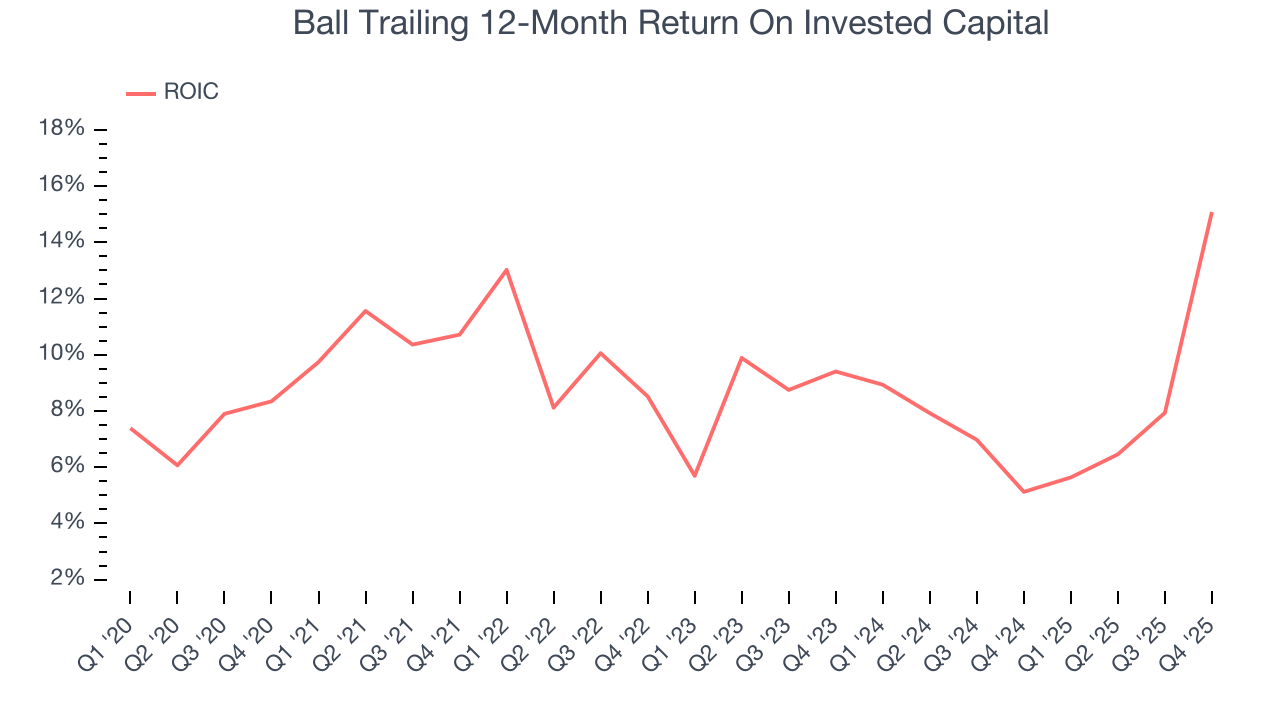
We like to invest in businesses with high returns, but the trend in a company’s ROIC is what often surprises the market and moves the stock price. Unfortunately, Ball’s ROIC has stayed the same over the last few years. If the company wants to become an investable business, it must improve its returns by generating more profitable growth.
11. Balance Sheet Assessment
Ball reported $1.21 billion of cash and $7.01 billion of debt on its balance sheet in the most recent quarter. As investors in high-quality companies, we primarily focus on two things: 1) that a company’s debt level isn’t too high and 2) that its interest payments are not excessively burdening the business.
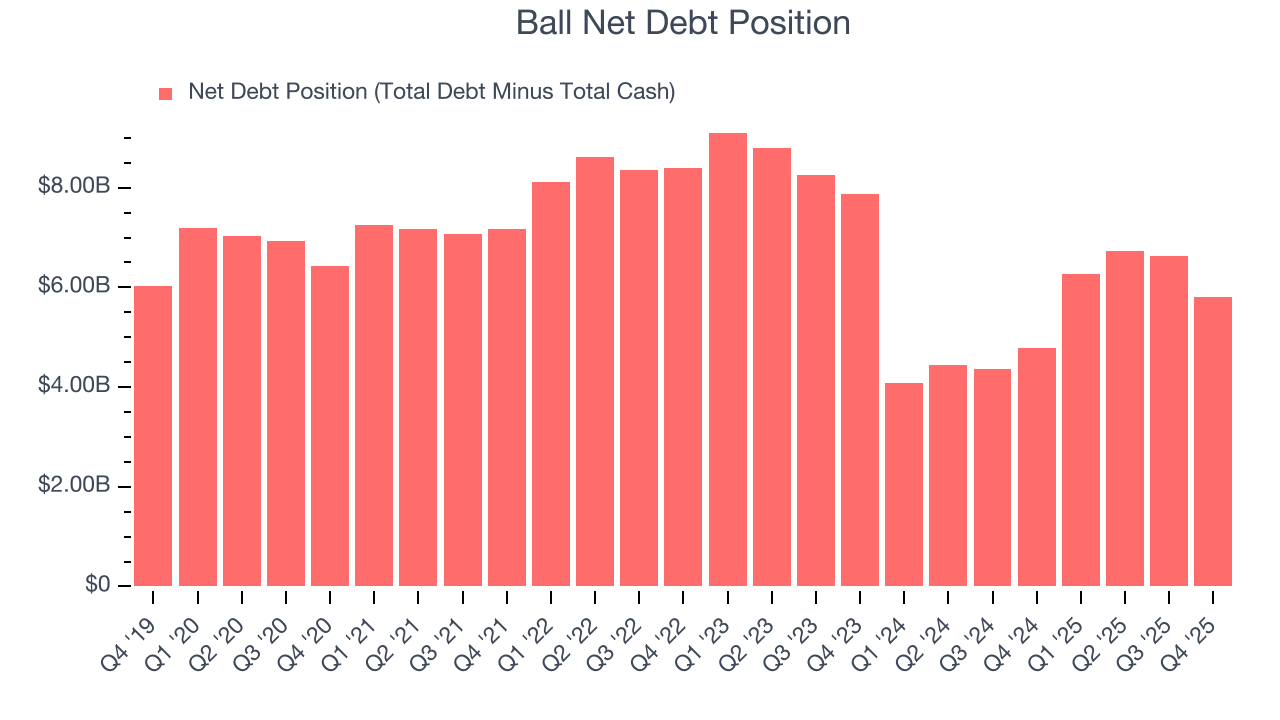
With $2.18 billion of EBITDA over the last 12 months, we view Ball’s 2.7× net-debt-to-EBITDA ratio as safe. We also see its $148 million of annual interest expenses as appropriate. The company’s profits give it plenty of breathing room, allowing it to continue investing in growth initiatives.
12. Key Takeaways from Ball’s Q4 Results
We were impressed by how significantly Ball blew past analysts’ EBITDA expectations this quarter. We were also excited its revenue outperformed Wall Street’s estimates by a wide margin. Zooming out, we think this was a good print with some key areas of upside. The stock traded up 2.9% to $58.34 immediately after reporting.
13. Is Now The Time To Buy Ball?
Updated: March 14, 2026 at 11:44 PM EDT
When considering an investment in Ball, investors should account for its valuation and business qualities as well as what’s happened in the latest quarter.
We see the value of companies helping their customers, but in the case of Ball, we’re out. First off, its revenue growth was weak over the last five years. While its rising cash profitability gives it more optionality, the downside is its low free cash flow margins give it little breathing room. On top of that, its low gross margins indicate some combination of competitive pressures and high production costs.
Ball’s P/E ratio based on the next 12 months is 15.5x. This valuation multiple is fair, but we don’t have much confidence in the company. There are better investments elsewhere.
Wall Street analysts have a consensus one-year price target of $70.15 on the company (compared to the current share price of $62.20).