
Belden (BDC)
We’re cautious of Belden. Its poor sales growth and falling returns on capital suggest its growth opportunities are shrinking.― StockStory Analyst Team
1. News


2. Summary
Why We Think Belden Will Underperform
With its enamel-coated copper wire used in WWI for the Allied forces, Belden (NYSE:BDC) designs, manufactures, and sells electronic components to various industries.
- On the plus side, its earnings growth has outpaced its peers over the last five years as its EPS has compounded at 22.4% annually


Belden doesn’t live up to our standards. Our attention is focused on better businesses.
Why There Are Better Opportunities Than Belden


Belden’s stock price of $114.58 implies a valuation ratio of 14.8x forward P/E. This multiple is lower than most industrials companies, but for good reason.
We’d rather pay up for companies with elite fundamentals than get a bargain on weak ones. Cheap stocks can be value traps, and as their performance deteriorates, they will stay cheap or get even cheaper.
3. Belden (BDC) Research Report: Q4 CY2025 Update
Electronic component manufacturer Belden (NYSE:BDC) beat Wall Street’s revenue expectations in Q4 CY2025, with sales up 8.1% year on year to $720.1 million. On top of that, next quarter’s revenue guidance ($682.5 million at the midpoint) was surprisingly good and 3.2% above what analysts were expecting. Its non-GAAP profit of $2.08 per share was 6.4% above analysts’ consensus estimates.
Belden (BDC) Q4 CY2025 Highlights:
- Revenue: $720.1 million vs analyst estimates of $696.9 million (8.1% year-on-year growth, 3.3% beat)
- Adjusted EPS: $2.08 vs analyst estimates of $1.95 (6.4% beat)
- Adjusted EBITDA: $122.1 million vs analyst estimates of $120.9 million (17% margin, 1% beat)
- Revenue Guidance for Q1 CY2026 is $682.5 million at the midpoint, above analyst estimates of $661.2 million
- Adjusted EPS guidance for Q1 CY2026 is $1.70 at the midpoint, above analyst estimates of $1.68
- Operating Margin: 12.2%, up from 10.4% in the same quarter last year
- Free Cash Flow Margin: 16.8%, similar to the same quarter last year
- Market Capitalization: $5.59 billion
Company Overview
With its enamel-coated copper wire used in WWI for the Allied forces, Belden (NYSE:BDC) designs, manufactures, and sells electronic components to various industries.
Founded in 1902, the company initially produced wire and cable products for the burgeoning electrical industry. M&A has historically been instrumental in the company's growth, and the acquisitions of Cable Design (CDT) and Hirschmann Automation and Control were instrumental in its evolution.
Today, Belden offers an array of cables, connectors, and networking components designed to enable communication and data transmission. Its products are used in the telecommunications, broadcast, and industrial automation industries by industrial manufacturers, infrastructure developers, and IT professionals. Alongside its products, the company offers servicing agreements.
Belden engages with customers through distributors, direct sales, and original equipment manufacturers (OEMs). In addition, Belden works with system integrators (companies specializing in combining various components) to create a complete system with its products. The company often enters into long-term contracts with OEM partners, which typically involve pricing agreements, volume commitments, and ongoing technical support. Prices charged to customers can also vary based on order volumes and frequency, a tactic to keep the company's largest customers satisfied and more likely to return.
4. Electronic Components
Like many equipment and component manufacturers, electronic components companies are buoyed by secular trends such as connectivity and industrial automation. More specific pockets of strong demand include data centers and telecommunications, which can benefit companies whose optical and transceiver offerings fit those markets. But like the broader industrials sector, these companies are also at the whim of economic cycles. Consumer spending, for example, can greatly impact these companies’ volumes.
Competitors offering similar products include CommScope (NASDAQ:COMM), TE Connectivity (NYSE:TEL), and Panduit (private).
5. Revenue Growth
A company’s long-term sales performance is one signal of its overall quality. Even a bad business can shine for one or two quarters, but a top-tier one grows for years. Thankfully, Belden’s 7.8% annualized revenue growth over the last five years was decent. Its growth was slightly above the average industrials company and shows its offerings resonate with customers.
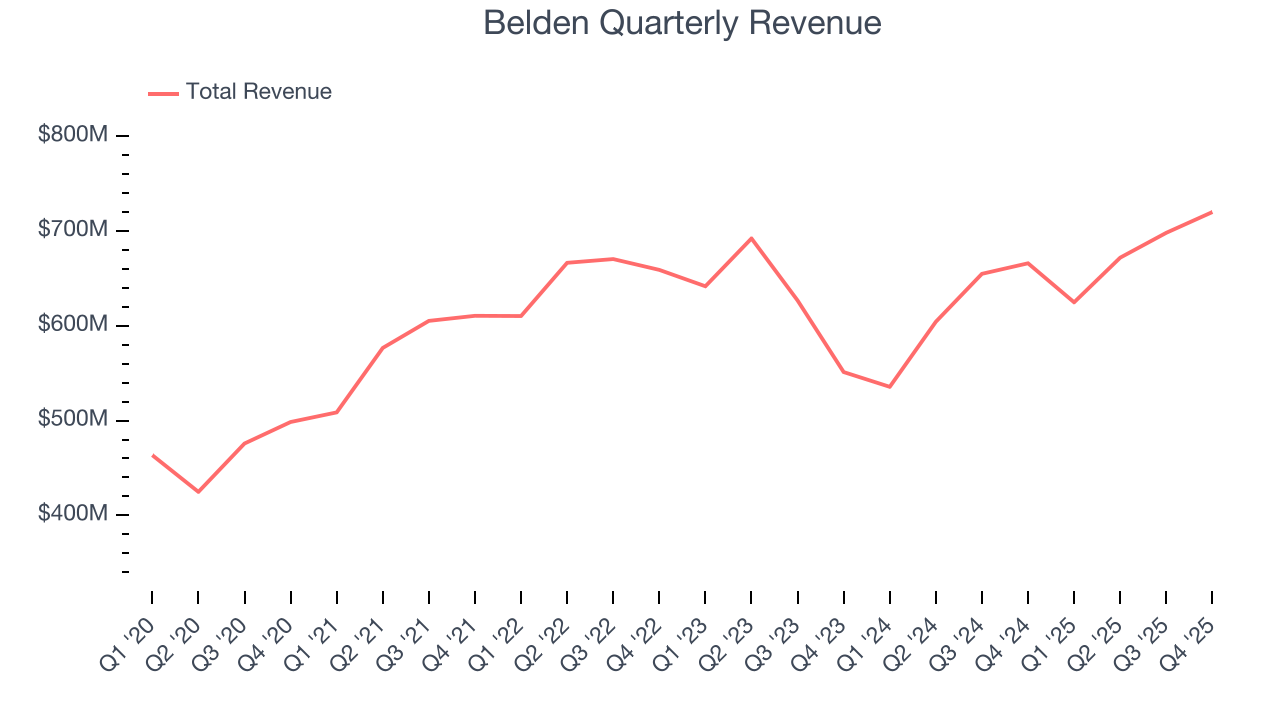
We at StockStory place the most emphasis on long-term growth, but within industrials, a half-decade historical view may miss cycles, industry trends, or a company capitalizing on catalysts such as a new contract win or a successful product line. Belden’s recent performance shows its demand has slowed as its annualized revenue growth of 4% over the last two years was below its five-year trend. We’re wary when companies in the sector see decelerations in revenue growth, as it could signal changing consumer tastes aided by low switching costs. 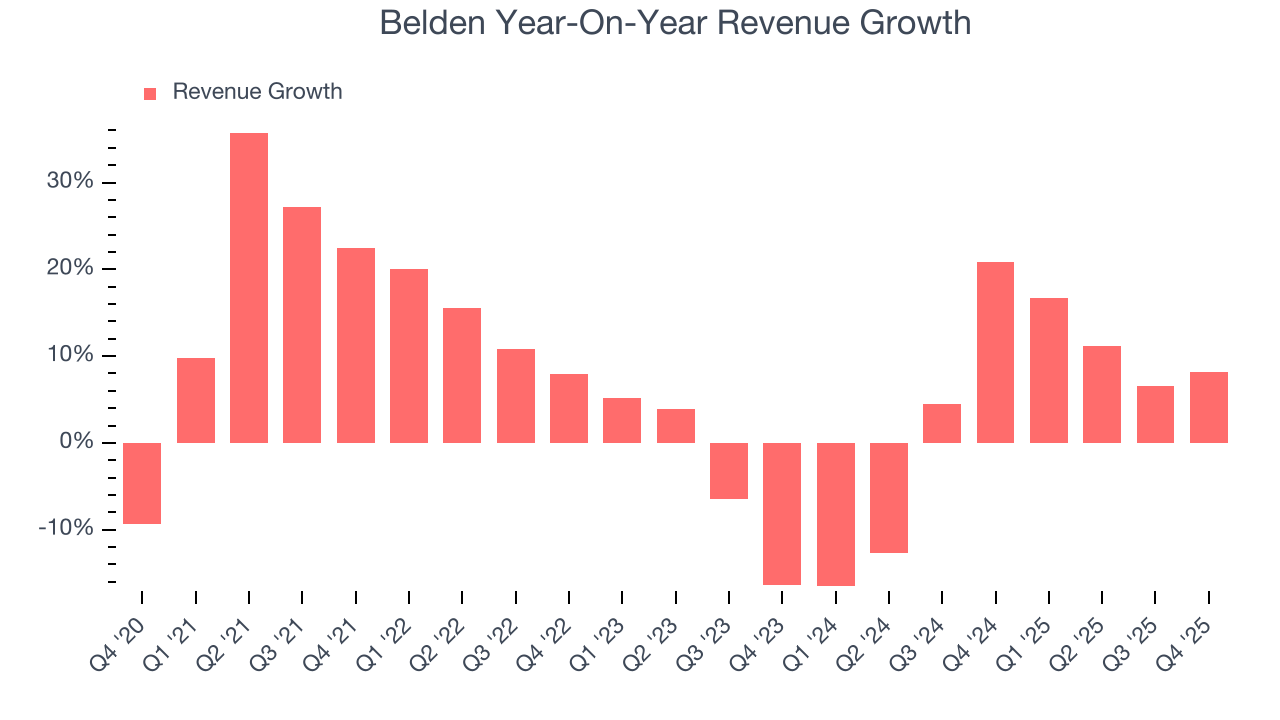
We can dig further into the company’s revenue dynamics by analyzing its most important segments, Enterprise and Industrial, which are 44.8% and 55.2% of revenue. Over the last two years, Belden’s Enterprise revenue (network infrastructure and broadband solutions) averaged 2% year-on-year growth while its Industrial revenue (infrastructure digitization and automation) averaged 8.2% growth. 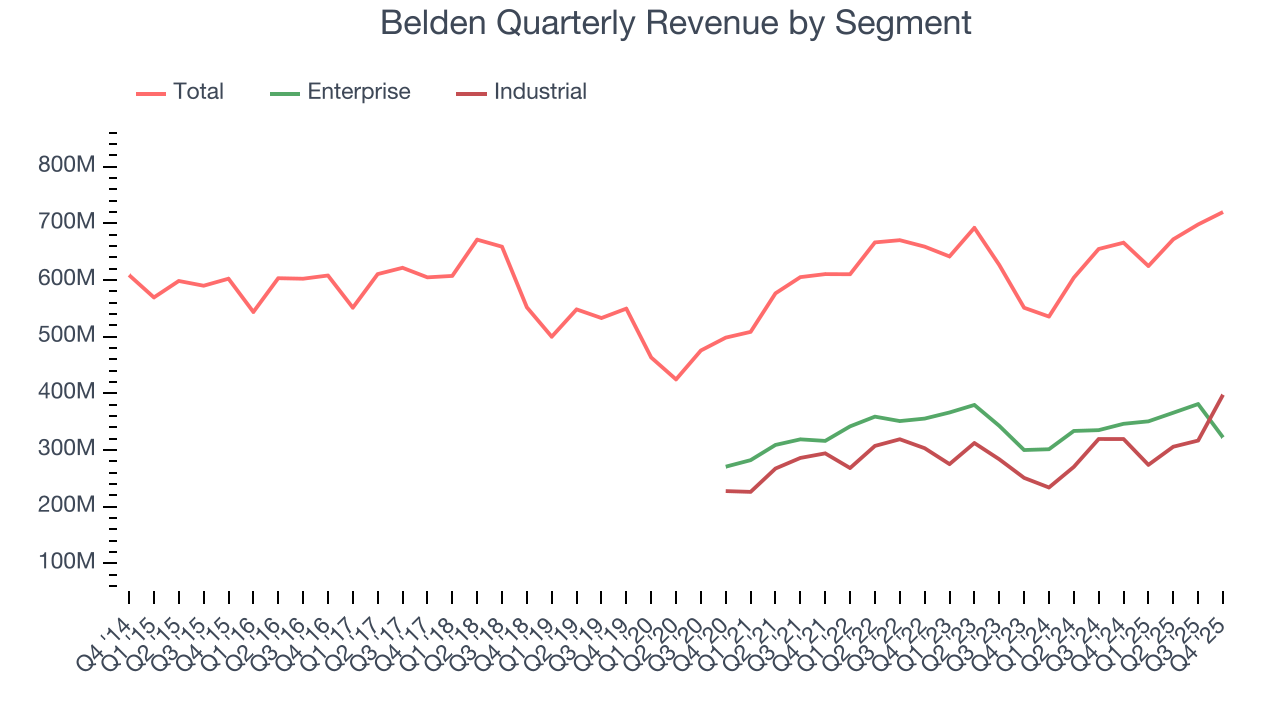
This quarter, Belden reported year-on-year revenue growth of 8.1%, and its $720.1 million of revenue exceeded Wall Street’s estimates by 3.3%. Company management is currently guiding for a 9.2% year-on-year increase in sales next quarter.
Looking further ahead, sell-side analysts expect revenue to grow 4.3% over the next 12 months, similar to its two-year rate. This projection is underwhelming and indicates its newer products and services will not lead to better top-line performance yet.
6. Gross Margin & Pricing Power
Belden’s unit economics are great compared to the broader industrials sector and signal that it enjoys product differentiation through quality or brand. As you can see below, it averaged an excellent 36.6% gross margin over the last five years. Said differently, roughly $36.64 was left to spend on selling, marketing, R&D, and general administrative overhead for every $100 in revenue. 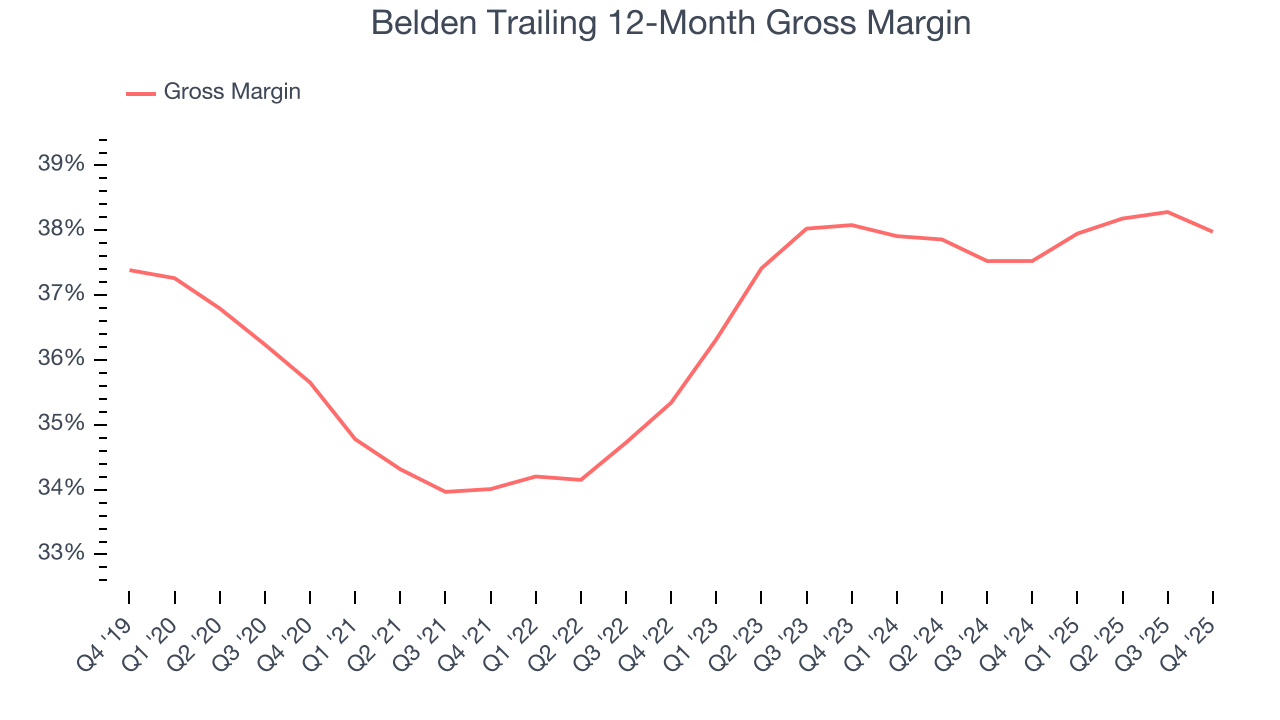
Belden’s gross profit margin came in at 36.6% this quarter , marking a 1.1 percentage point decrease from 37.7% in the same quarter last year. Zooming out, the company’s full-year margin has remained steady over the past 12 months, suggesting its input costs (such as raw materials and manufacturing expenses) have been stable and it isn’t under pressure to lower prices.
7. Operating Margin
Operating margin is one of the best measures of profitability because it tells us how much money a company takes home after procuring and manufacturing its products, marketing and selling those products, and most importantly, keeping them relevant through research and development.
Belden’s operating margin might fluctuated slightly over the last 12 months but has remained more or less the same, averaging 12.1% over the last five years. This profitability was top-notch for an industrials business, showing it’s an well-run company with an efficient cost structure. This result isn’t surprising as its high gross margin gives it a favorable starting point.
Analyzing the trend in its profitability, Belden’s operating margin might fluctuated slightly but has generally stayed the same over the last five years. This raises questions about the company’s expense base because its revenue growth should have given it leverage on its fixed costs, resulting in better economies of scale and profitability.
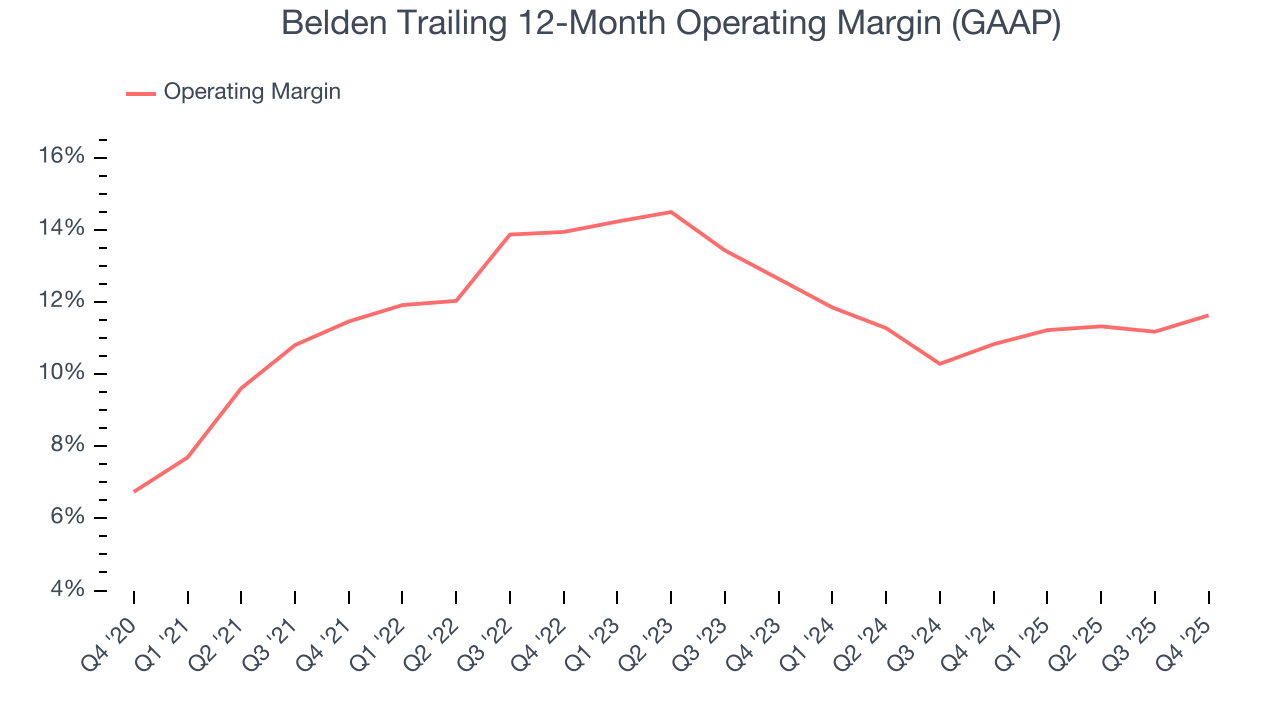
In Q4, Belden generated an operating margin profit margin of 12.2%, up 1.8 percentage points year on year. The increase was encouraging, and because its gross margin actually decreased, we can assume it was more efficient because its operating expenses like marketing, R&D, and administrative overhead grew slower than its revenue.
8. Earnings Per Share
Revenue trends explain a company’s historical growth, but the long-term change in earnings per share (EPS) points to the profitability of that growth – for example, a company could inflate its sales through excessive spending on advertising and promotions.
Belden’s EPS grew at an astounding 22.4% compounded annual growth rate over the last five years, higher than its 7.8% annualized revenue growth. This tells us the company became more profitable on a per-share basis as it expanded.
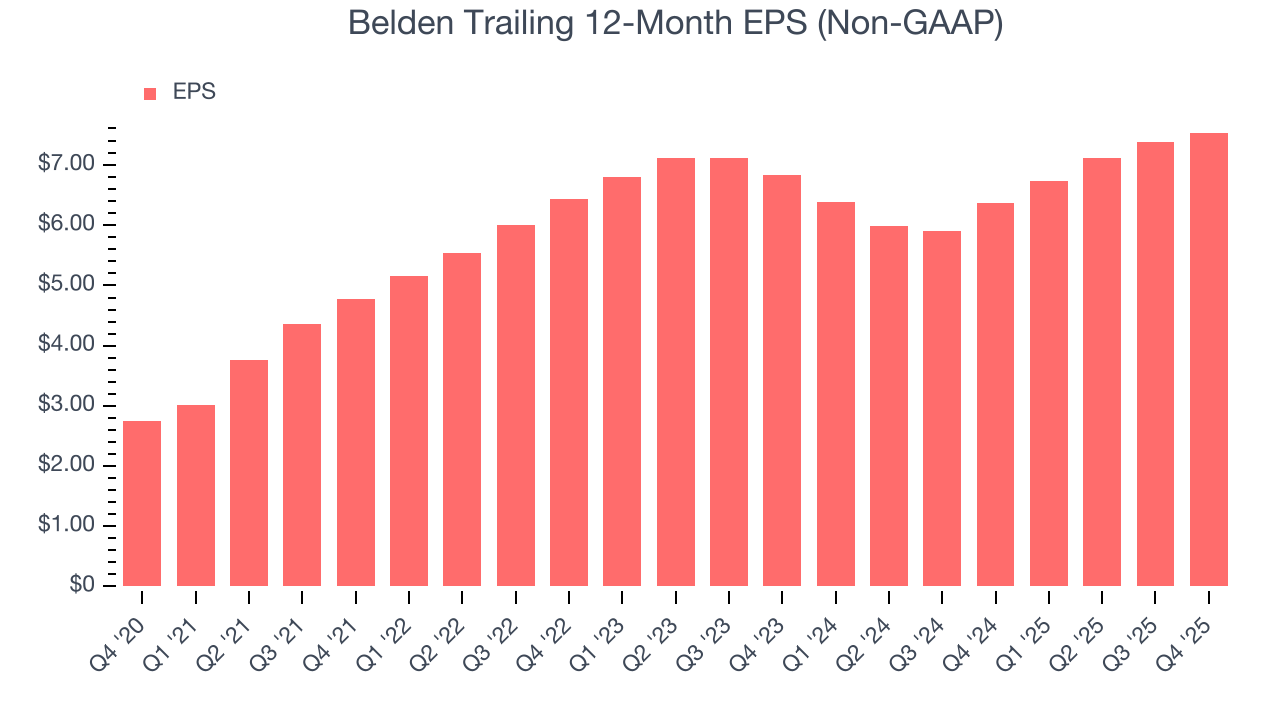
Diving into Belden’s quality of earnings can give us a better understanding of its performance. A five-year view shows that Belden has repurchased its stock, shrinking its share count by 11.1%. This tells us its EPS outperformed its revenue not because of increased operational efficiency but financial engineering, as buybacks boost per share earnings. 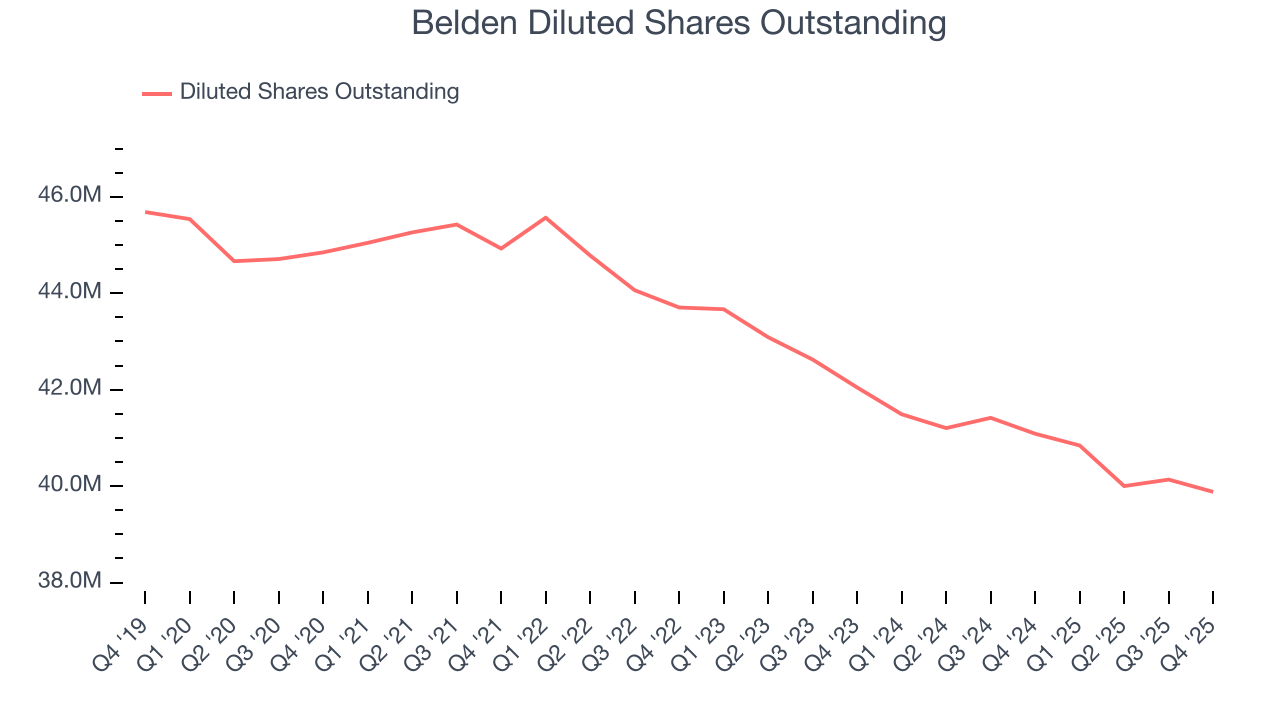
Like with revenue, we analyze EPS over a more recent period because it can provide insight into an emerging theme or development for the business.
For Belden, its two-year annual EPS growth of 5.1% was lower than its five-year trend. We hope its growth can accelerate in the future.
In Q4, Belden reported adjusted EPS of $2.08, up from $1.92 in the same quarter last year. This print beat analysts’ estimates by 6.4%. Over the next 12 months, Wall Street expects Belden’s full-year EPS of $7.54 to grow 3.7%.
9. Cash Is King
Free cash flow isn't a prominently featured metric in company financials and earnings releases, but we think it's telling because it accounts for all operating and capital expenses, making it tough to manipulate. Cash is king.
Belden has shown impressive cash profitability, enabling it to ride out cyclical downturns more easily while maintaining its investments in new and existing offerings. The company’s free cash flow margin averaged 8.2% over the last five years, better than the broader industrials sector.
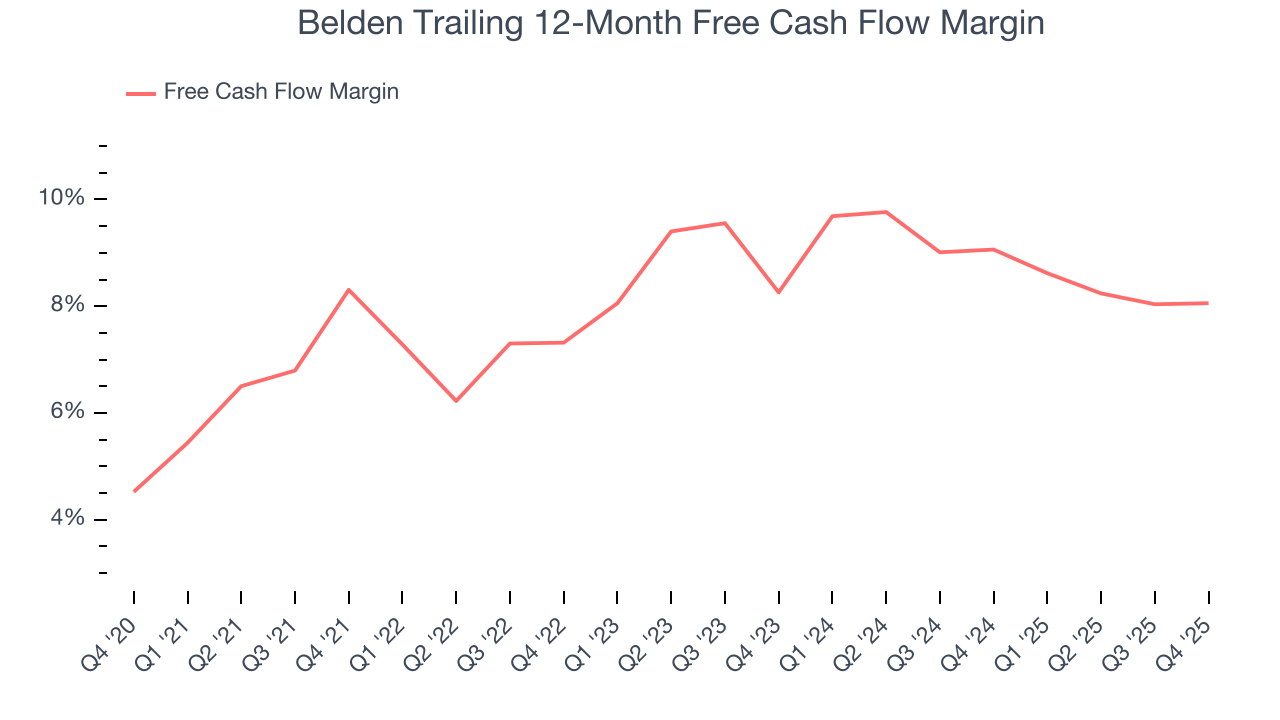
Belden’s free cash flow clocked in at $121.3 million in Q4, equivalent to a 16.8% margin. This cash profitability was in line with the comparable period last year and above its five-year average.
10. Return on Invested Capital (ROIC)
EPS and free cash flow tell us whether a company was profitable while growing its revenue. But was it capital-efficient? A company’s ROIC explains this by showing how much operating profit it makes compared to the money it has raised (debt and equity).
Although Belden hasn’t been the highest-quality company lately, it historically found a few growth initiatives that worked. Its five-year average ROIC was 13.1%, higher than most industrials businesses.
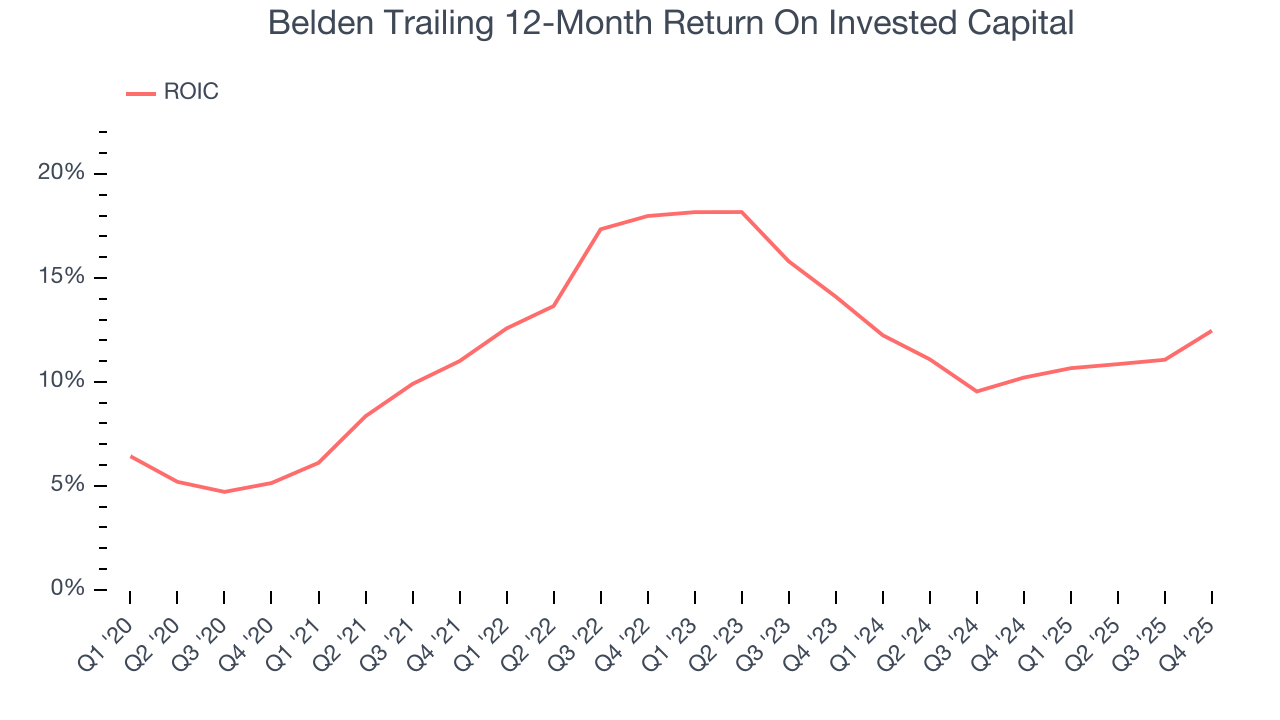
We like to invest in businesses with high returns, but the trend in a company’s ROIC is what often surprises the market and moves the stock price. On average, Belden’s ROIC decreased by 3.2 percentage points annually each year over the last few years. We like what management has done in the past, but its declining returns are perhaps a symptom of fewer profitable growth opportunities.
11. Balance Sheet Assessment
Belden reported $389.9 million of cash and $1.38 billion of debt on its balance sheet in the most recent quarter. As investors in high-quality companies, we primarily focus on two things: 1) that a company’s debt level isn’t too high and 2) that its interest payments are not excessively burdening the business.
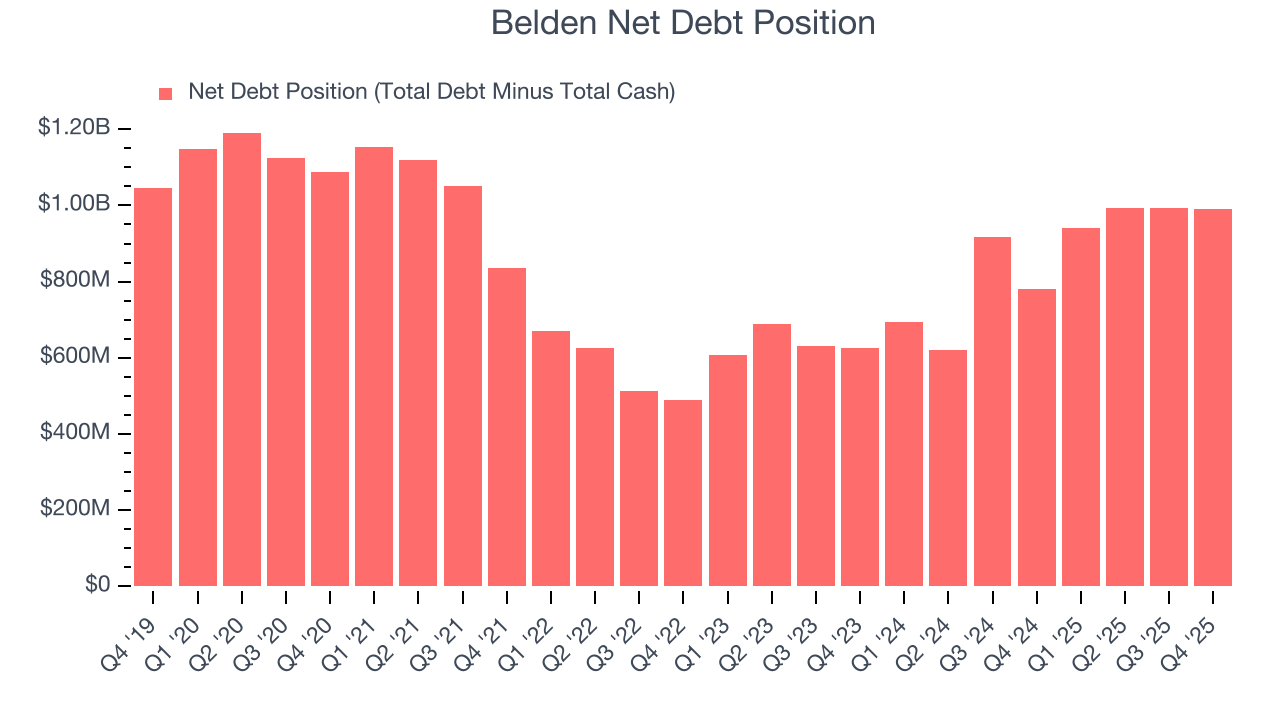
With $458.7 million of EBITDA over the last 12 months, we view Belden’s 2.2× net-debt-to-EBITDA ratio as safe. We also see its $46.36 million of annual interest expenses as appropriate. The company’s profits give it plenty of breathing room, allowing it to continue investing in growth initiatives.
12. Key Takeaways from Belden’s Q4 Results
We were impressed by how significantly Belden blew past analysts’ Industrial revenue expectations this quarter. We were also glad its revenue and EPS outperformed Wall Street’s estimates. Looking ahead, revenue and EPS guidance for next quarter was also ahead of estimates. On the other hand, its Enterprise revenue missed. Overall, we think this was a good quarter with some key metrics above expectations. The stock remained flat at $142.63 immediately after reporting.
13. Is Now The Time To Buy Belden?
Updated: March 14, 2026 at 11:30 PM EDT
A common mistake we notice when investors are deciding whether to buy a stock or not is that they simply look at the latest earnings results. Business quality and valuation matter more, so we urge you to understand these dynamics as well.
Belden’s business quality ultimately falls short of our standards. Although its revenue growth was decent over the last five years and Wall Street believes it will continue to grow, its diminishing returns show management's prior bets haven't worked out. And while the company’s astounding EPS growth over the last five years shows its profits are trickling down to shareholders, the downside is its projected EPS for the next year is lacking.
Belden’s P/E ratio based on the next 12 months is 14.8x. This valuation multiple is fair, but we don’t have much faith in the company. We're pretty confident there are superior stocks to buy right now.
Wall Street analysts have a consensus one-year price target of $175.80 on the company (compared to the current share price of $114.58).
Although the price target is bullish, readers should exercise caution because analysts tend to be overly optimistic. The firms they work for, often big banks, have relationships with companies that extend into fundraising, M&A advisory, and other rewarding business lines. As a result, they typically hesitate to say bad things for fear they will lose out. We at StockStory do not suffer from such conflicts of interest, so we’ll always tell it like it is.