
Bloom Energy (BE)
Bloom Energy is one of our favorite stocks. Its revenue and EPS are soaring, showing it can grow quickly and become more profitable as it scales.― StockStory Analyst Team
1. News


2. Summary
Why We Like Bloom Energy
Working in stealth mode for eight years, Bloom Energy (NYSE:BE) designs, manufactures, and markets solid oxide fuel cell systems for on-site power generation.
- Annual revenue growth of 20.6% over the last five years was superb and indicates its market share increased during this cycle
- Incremental sales over the last five years have been highly profitable as its earnings per share increased by 25.1% annually, topping its revenue gains
- Projected revenue growth of 58% for the next 12 months is above its two-year trend, pointing to accelerating demand


We’re fond of companies like Bloom Energy. No coincidence the stock is up 466% over the last five years.
Is Now The Time To Buy Bloom Energy?


At $149.13 per share, Bloom Energy trades at 105.1x forward P/E. There’s no denying that the lofty valuation means there’s much good news priced into the stock.
If you like the company and believe the bull case, we suggest making it a smaller position as our analysis shows high-quality companies outperform the market over a multi-year period regardless of valuation.
3. Bloom Energy (BE) Research Report: Q4 CY2025 Update
Electricity generation and hydrogen production company Bloom Energy (NYSE:BE) reported Q4 CY2025 results topping the market’s revenue expectations, with sales up 35.9% year on year to $777.7 million. The company’s full-year revenue guidance of $3.2 billion at the midpoint came in 24.2% above analysts’ estimates. Its non-GAAP profit of $0.45 per share was 50.4% above analysts’ consensus estimates.
Bloom Energy (BE) Q4 CY2025 Highlights:
- Revenue: $777.7 million vs analyst estimates of $655.1 million (35.9% year-on-year growth, 18.7% beat)
- Adjusted EPS: $0.45 vs analyst estimates of $0.30 (50.4% beat)
- Adjusted EBITDA: $146.1 million vs analyst estimates of $107 million (18.8% margin, 36.6% beat)
- Operating Margin: 17.1%, down from 18.3% in the same quarter last year
- Free Cash Flow Margin: 50.8%, down from 82.7% in the same quarter last year
- Market Capitalization: $34.85 billion
Company Overview
Working in stealth mode for eight years, Bloom Energy (NYSE:BE) designs, manufactures, and markets solid oxide fuel cell systems for on-site power generation.
Founded in 2001 by Dr. K.R. Sridhar, Bloom Energy was established to change the energy landscape by developing efficient, sustainable power generation solutions. Dr. Sridhar, originally a NASA scientist, envisioned a way to address the global need for reliable and clean energy through the creation of the company's solid oxide fuel cell systems.
Today, Bloom Energy designs, manufactures, and markets solid oxide fuel cell systems that provide on-site power generation for commercial and industrial applications. These systems solve the problem of unreliable grid power and high carbon emissions by offering a clean, efficient, and resilient alternative. For example, Bloom Energy Servers can supply uninterrupted power to data centers, hospitals, and manufacturing facilities, ensuring critical operations remain functional even during grid outages.
The primary revenue sources for Bloom Energy include the sale of fuel cell systems, maintenance contracts, and energy service agreements. The company's business model focuses on providing decentralized power generation solutions that offer significant cost savings and environmental benefits to its customers. Bloom Energy appeals to businesses seeking reliable, sustainable energy solutions that reduce their carbon footprint and operating costs. The company generates recurring revenue through long-term service agreements and maintenance contracts.
4. Renewable Energy
Renewable energy companies are buoyed by the secular trend of green energy that is upending traditional power generation. Those who innovate and evolve with this dynamic market can win share while those who continue to rely on legacy technologies can see diminishing demand, which includes headwinds from increasing regulation against “dirty” energy. Additionally, these companies are at the whim of economic cycles, as interest rates can impact the willingness to invest in renewable energy projects.
Competitors in the energy industry include NET Power (NYSE:NPWR), Energy Vault (NYSE:NRGV), and NuScale Power (NYSE:SMR).
5. Revenue Growth
Reviewing a company’s long-term sales performance reveals insights into its quality. Any business can put up a good quarter or two, but many enduring ones grow for years. Over the last five years, Bloom Energy grew its sales at an incredible 20.6% compounded annual growth rate. Its growth surpassed the average industrials company and shows its offerings resonate with customers, a great starting point for our analysis.
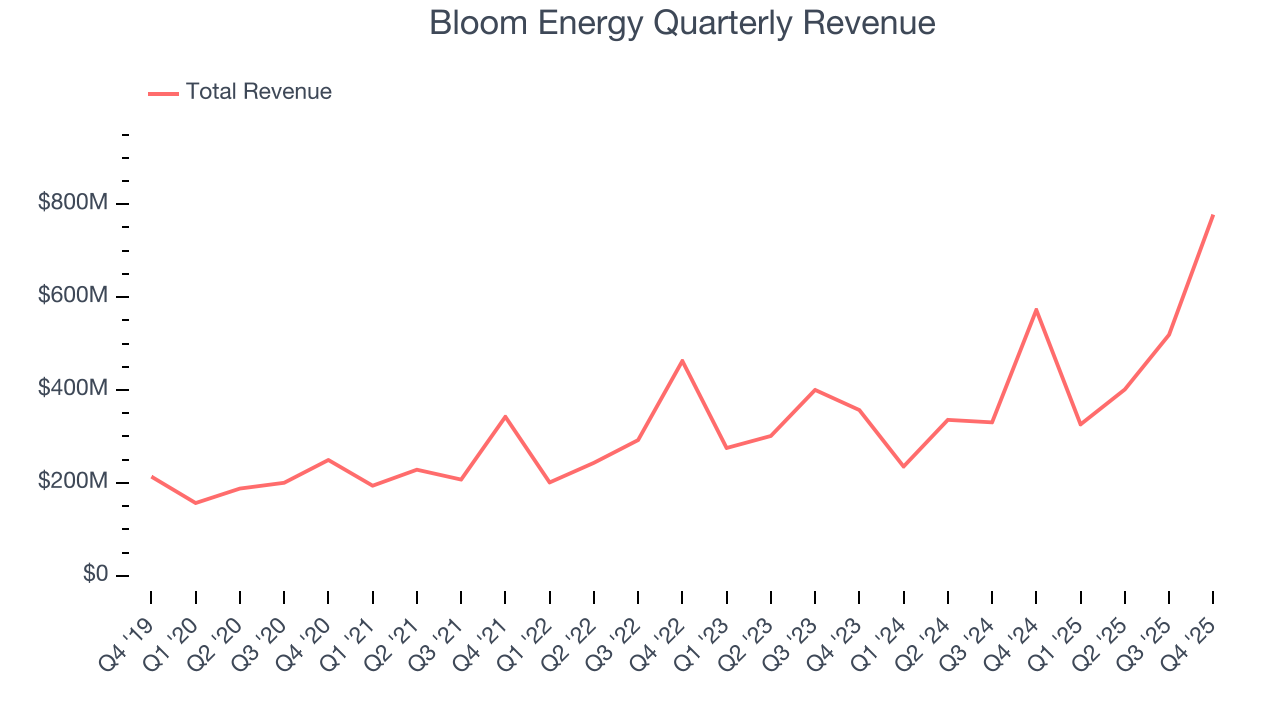
We at StockStory place the most emphasis on long-term growth, but within industrials, a half-decade historical view may miss cycles, industry trends, or a company capitalizing on catalysts such as a new contract win or a successful product line. Bloom Energy’s annualized revenue growth of 23.2% over the last two years is above its five-year trend, suggesting its demand was strong and recently accelerated. 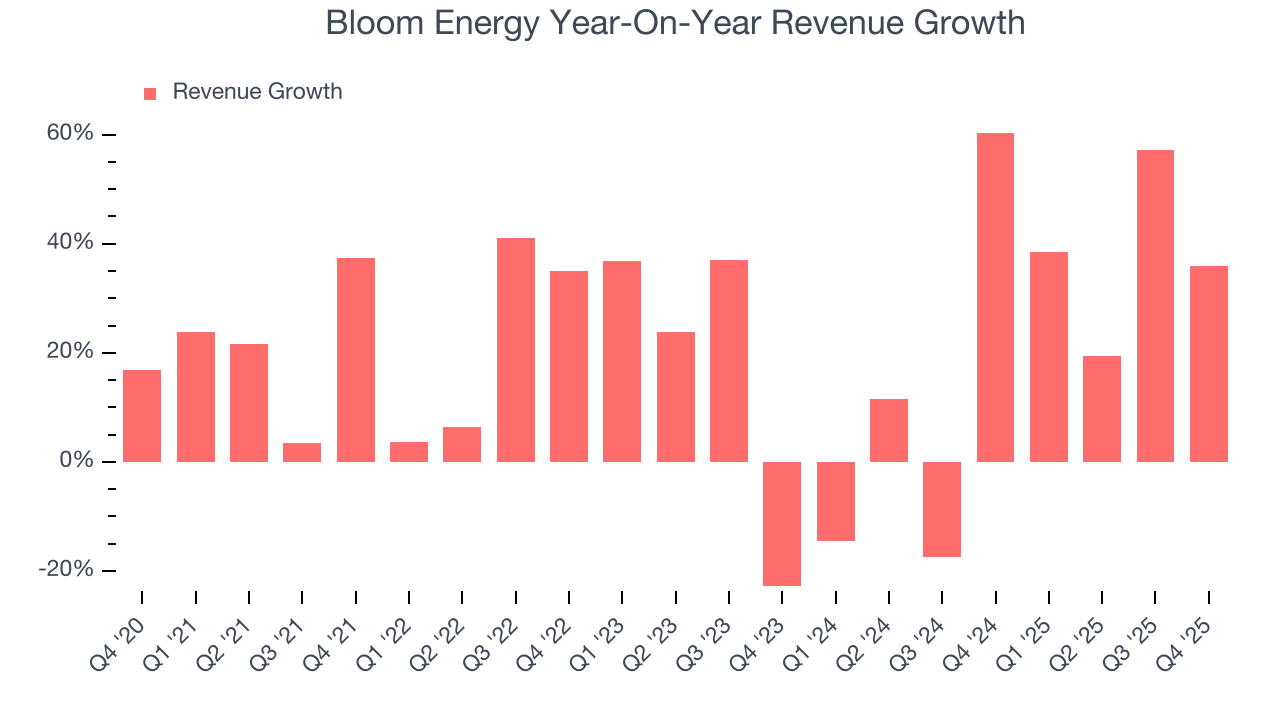
We can dig further into the company’s revenue dynamics by analyzing its most important segments, Product and Service, which are 82.1% and 7.9% of revenue. Over the last two years, Bloom Energy’s Product revenue (energy servers and electrolyzers) averaged 26.3% year-on-year growth while its Service revenue (operations and maintenance agreements) averaged 12.6% growth. 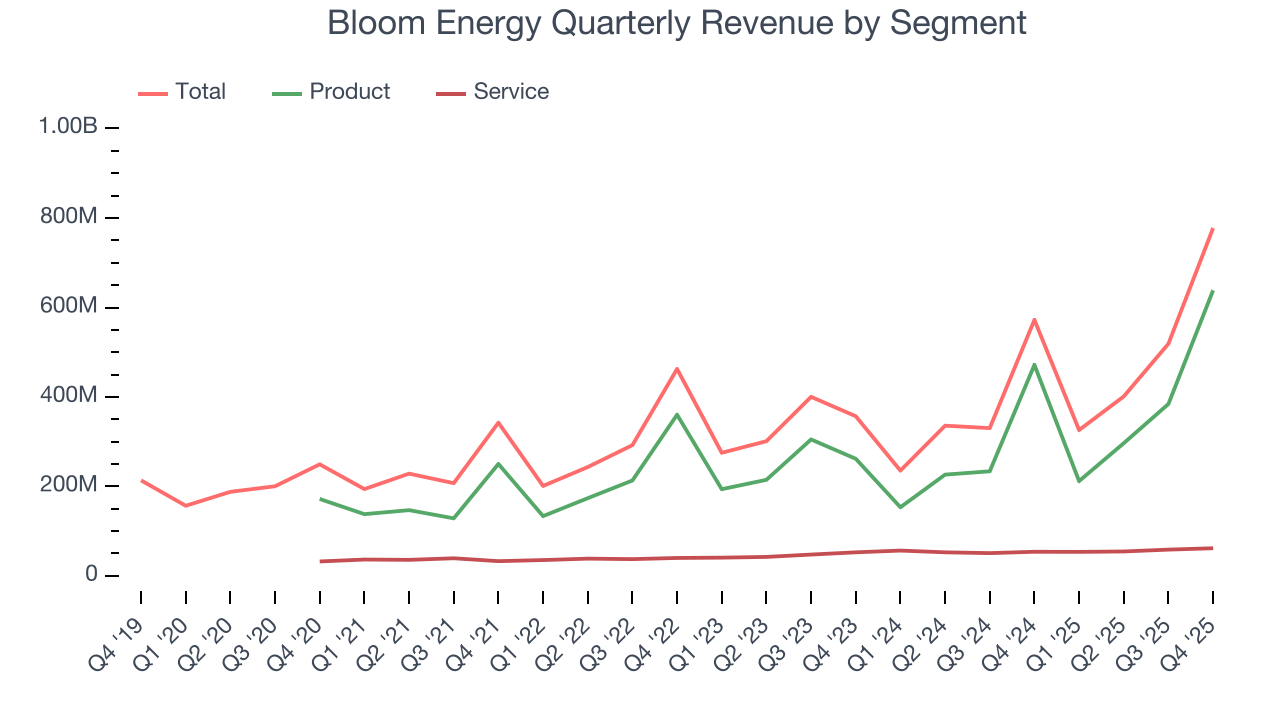
This quarter, Bloom Energy reported wonderful year-on-year revenue growth of 35.9%, and its $777.7 million of revenue exceeded Wall Street’s estimates by 18.7%.
Looking ahead, sell-side analysts expect revenue to grow 23.7% over the next 12 months, similar to its two-year rate. This projection is eye-popping and indicates the market sees success for its products and services.
6. Gross Margin & Pricing Power
Gross profit margin is a critical metric to track because it sheds light on its pricing power, complexity of products, and ability to procure raw materials, equipment, and labor.
Bloom Energy has bad unit economics for an industrials business, signaling it operates in a competitive market. As you can see below, it averaged a 21.3% gross margin over the last five years. Said differently, Bloom Energy had to pay a chunky $78.69 to its suppliers for every $100 in revenue. 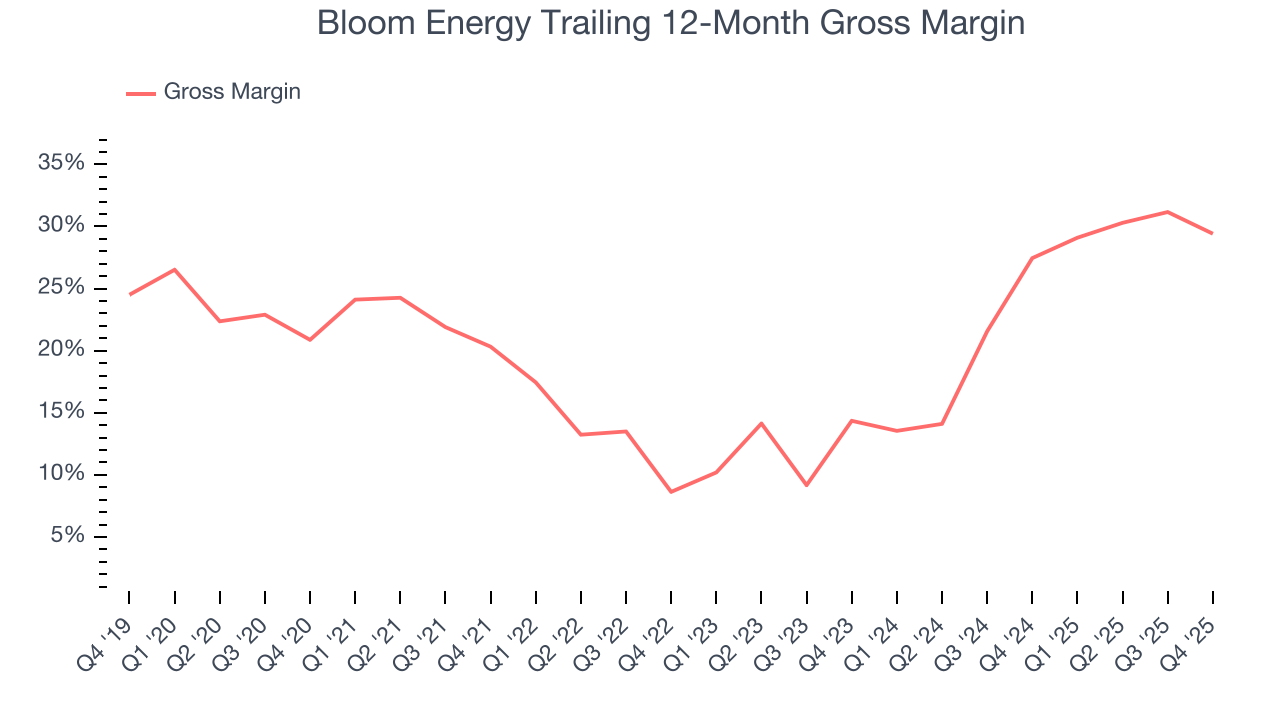
This quarter, Bloom Energy’s gross profit margin was 31.9%, down 6.4 percentage points year on year. Zooming out, however, Bloom Energy’s full-year margin has been trending up over the past 12 months, increasing by 2 percentage points. If this move continues, it could suggest better unit economics due to more leverage from its growing sales on the fixed portion of its cost of goods sold (such as manufacturing expenses).
7. Operating Margin
Although Bloom Energy was profitable this quarter from an operational perspective, it’s generally struggled over a longer time period. Its expensive cost structure has contributed to an average operating margin of negative 6.3% over the last five years. Unprofitable industrials companies require extra attention because they could get caught swimming naked when the tide goes out.
On the plus side, Bloom Energy’s operating margin rose by 17.6 percentage points over the last five years, as its sales growth gave it operating leverage. Still, it will take much more for the company to show consistent profitability.
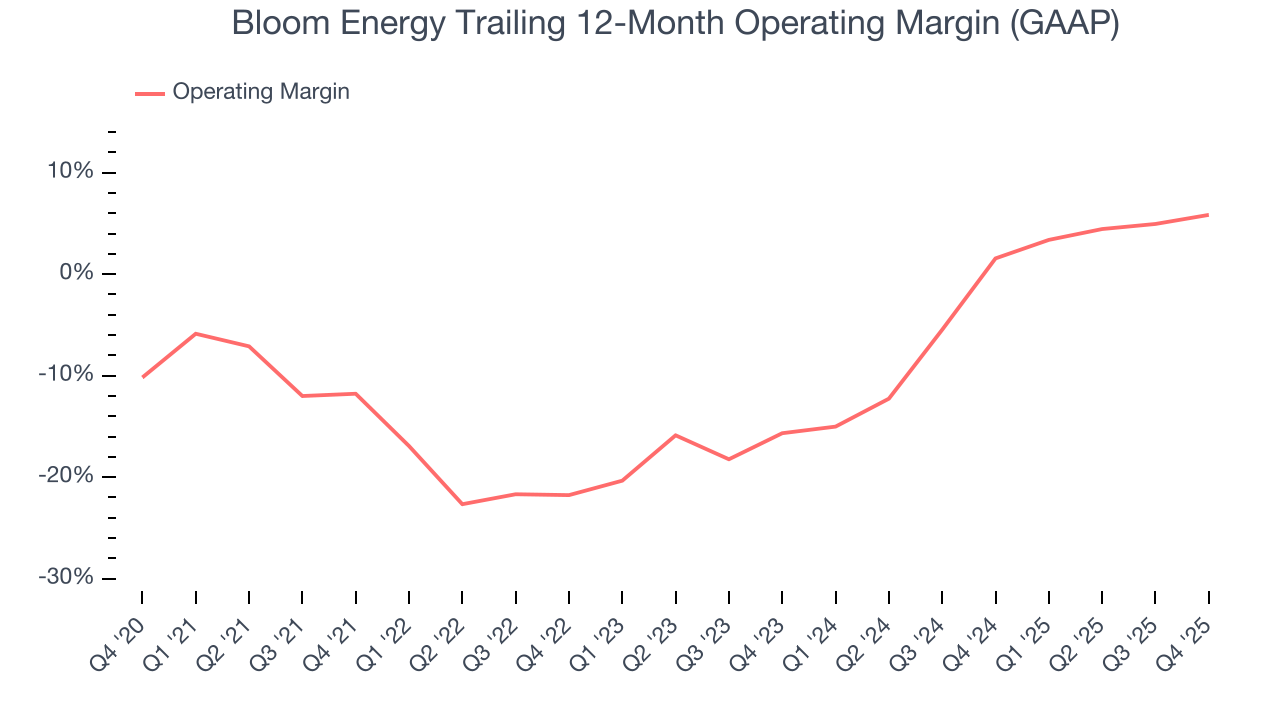
This quarter, Bloom Energy generated an operating margin profit margin of 17.1%, down 1.2 percentage points year on year. Since Bloom Energy’s gross margin decreased more than its operating margin, we can assume its recent inefficiencies were driven more by weaker leverage on its cost of sales rather than increased marketing, R&D, and administrative overhead expenses.
8. Earnings Per Share
We track the long-term change in earnings per share (EPS) for the same reason as long-term revenue growth. Compared to revenue, however, EPS highlights whether a company’s growth is profitable.
Bloom Energy’s full-year EPS flipped from negative to positive over the last five years. This is a good sign and shows it’s at an inflection point.
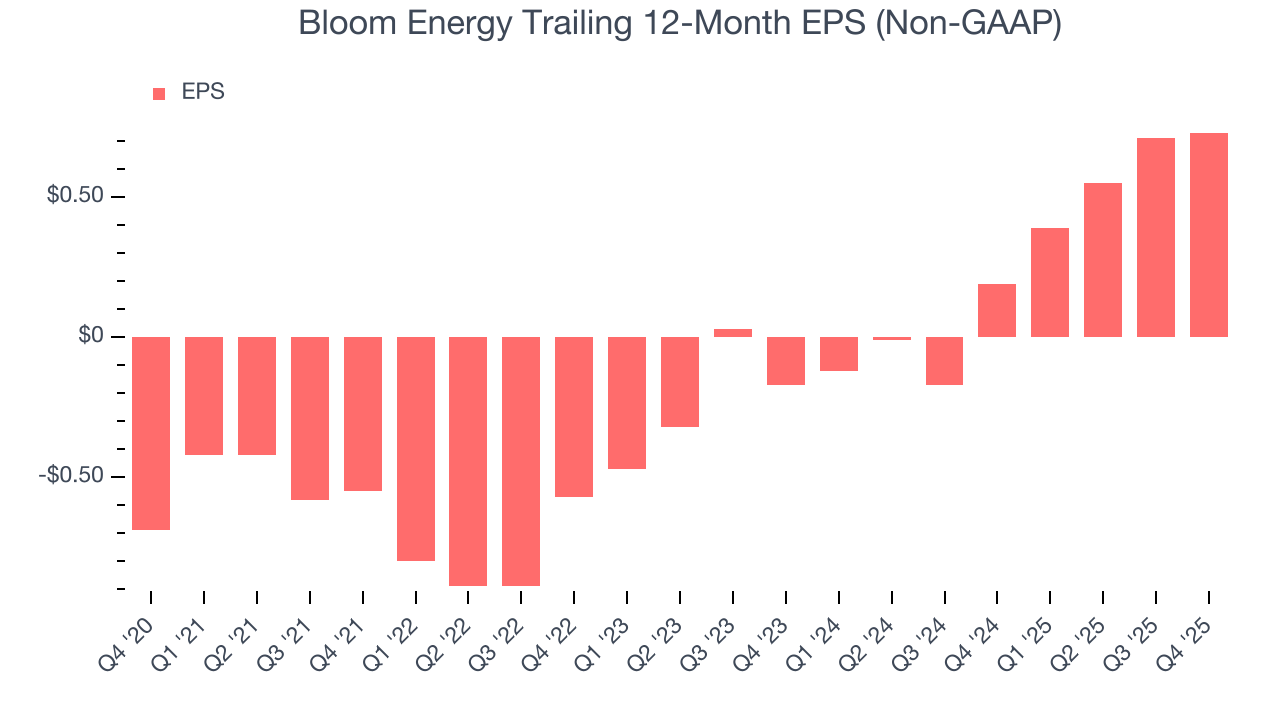
Like with revenue, we analyze EPS over a shorter period to see if we are missing a change in the business.
For Bloom Energy, its two-year annual EPS growth of 151% was higher than its five-year trend. We love it when earnings growth accelerates, especially when it accelerates off an already high base.
In Q4, Bloom Energy reported adjusted EPS of $0.45, up from $0.43 in the same quarter last year. This print easily cleared analysts’ estimates, and shareholders should be content with the results. Over the next 12 months, Wall Street expects Bloom Energy’s full-year EPS of $0.73 to grow 47.1%.
9. Cash Is King
Free cash flow isn't a prominently featured metric in company financials and earnings releases, but we think it's telling because it accounts for all operating and capital expenses, making it tough to manipulate. Cash is king.
While Bloom Energy posted positive free cash flow this quarter, the broader story hasn’t been so clean. Bloom Energy’s demanding reinvestments have drained its resources over the last five years, putting it in a pinch and limiting its ability to return capital to investors. Its free cash flow margin averaged negative 11.2%, meaning it lit $11.21 of cash on fire for every $100 in revenue.
Taking a step back, an encouraging sign is that Bloom Energy’s margin expanded by 14.2 percentage points during that time. In light of its glaring cash burn, however, this improvement is a bucket of hot water in a cold ocean.
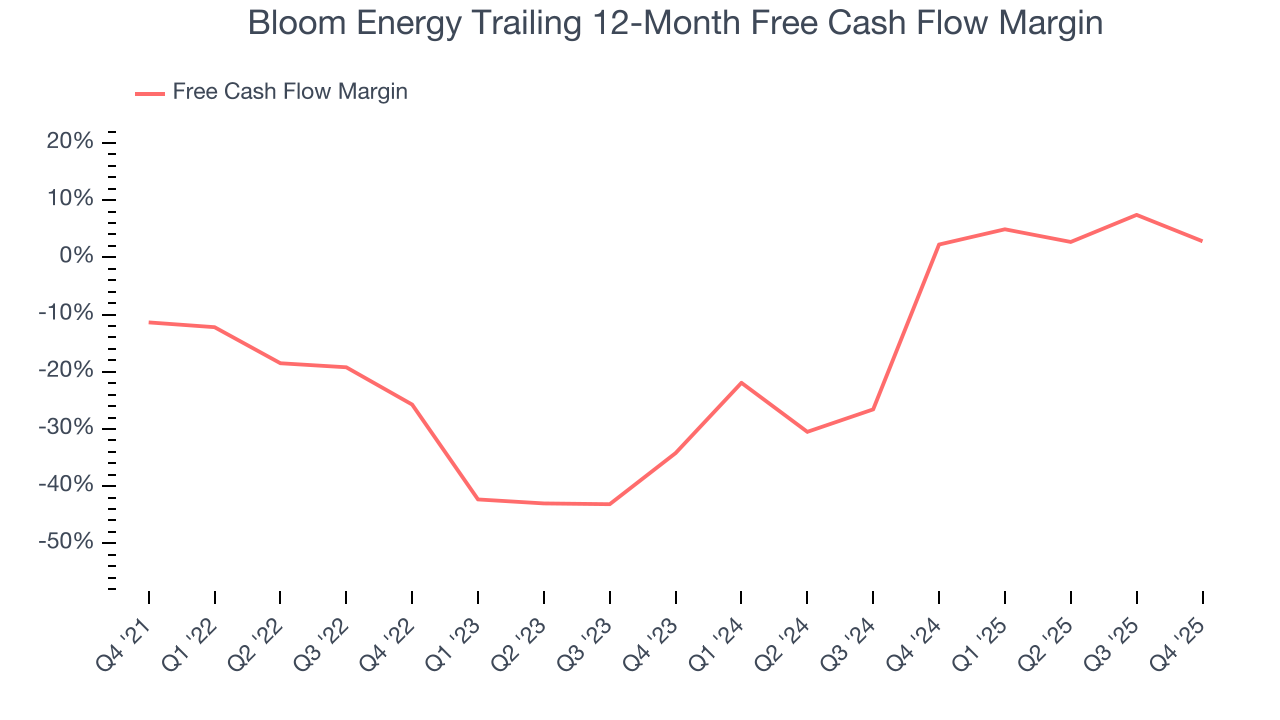
Bloom Energy’s free cash flow clocked in at $395.1 million in Q4, equivalent to a 50.8% margin. The company’s cash profitability regressed as it was 31.8 percentage points lower than in the same quarter last year, but it’s still above its five-year average. We wouldn’t read too much into this quarter’s decline because capital expenditures can be seasonal and companies often stockpile inventory in anticipation of higher demand, causing short-term swings. Long-term trends carry greater meaning.
10. Return on Invested Capital (ROIC)
EPS and free cash flow tell us whether a company was profitable while growing its revenue. But was it capital-efficient? A company’s ROIC explains this by showing how much operating profit it makes compared to the money it has raised (debt and equity).
Although Bloom Energy has shown solid business quality lately, it struggled to grow profitably in the past. Its five-year average ROIC was negative 13.9%, meaning management lost money while trying to expand the business.
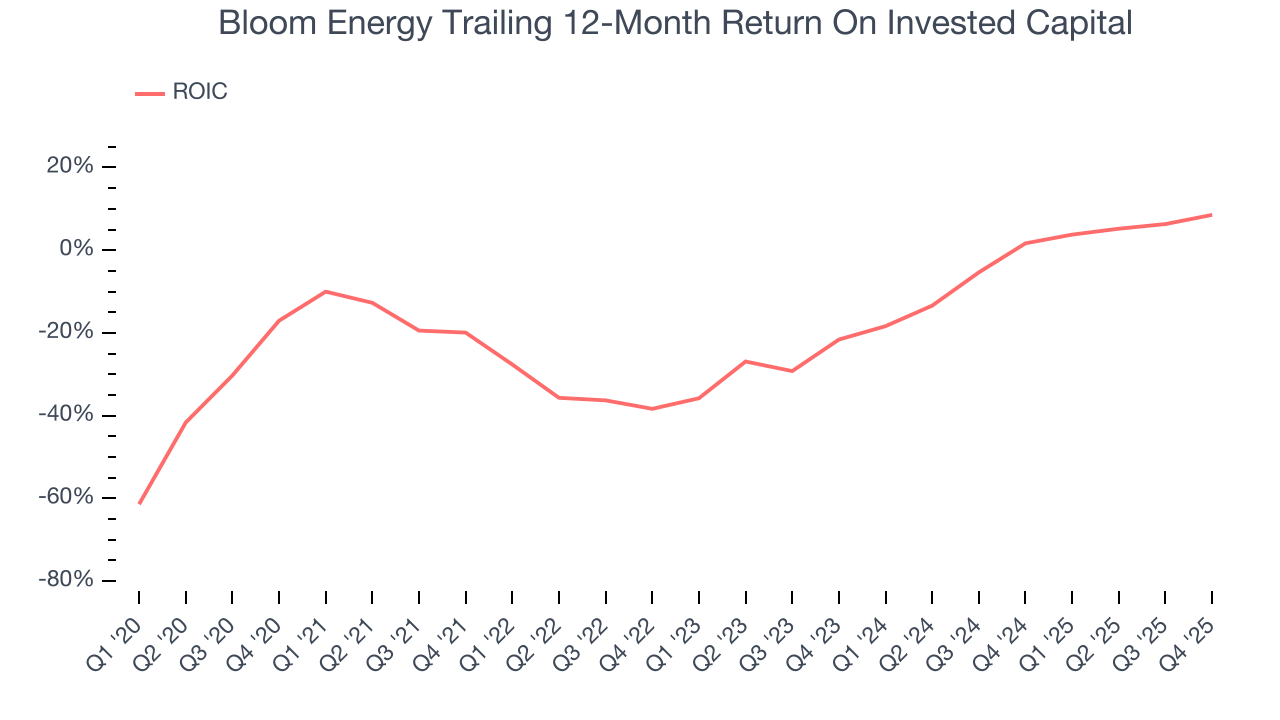
We like to invest in businesses with high returns, but the trend in a company’s ROIC is what often surprises the market and moves the stock price. Over the last few years, Bloom Energy’s ROIC has increased. This is a good sign, but we recognize its lack of profitable growth during the COVID era was the primary reason for the change.
11. Balance Sheet Assessment
Bloom Energy reported $2.48 billion of cash and $2.69 billion of debt on its balance sheet in the most recent quarter. As investors in high-quality companies, we primarily focus on two things: 1) that a company’s debt level isn’t too high and 2) that its interest payments are not excessively burdening the business.
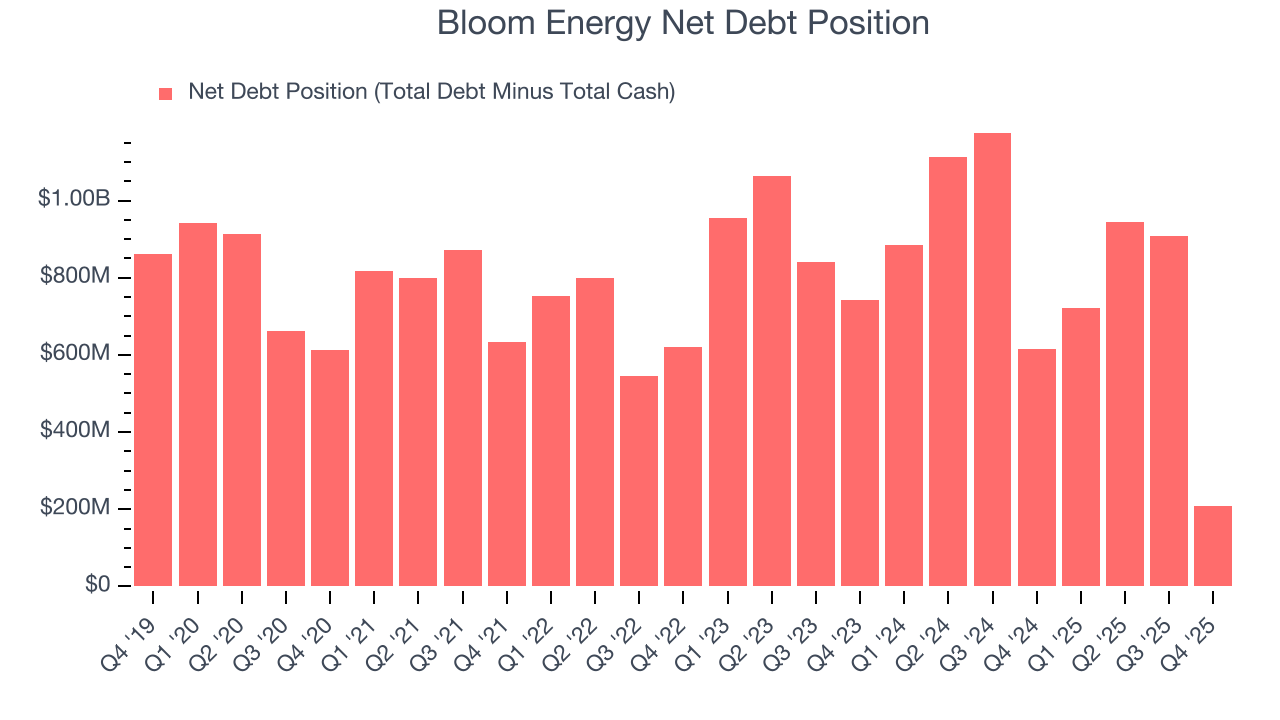
With $271.6 million of EBITDA over the last 12 months, we view Bloom Energy’s 0.8× net-debt-to-EBITDA ratio as safe. We also see its $24.82 million of annual interest expenses as appropriate. The company’s profits give it plenty of breathing room, allowing it to continue investing in growth initiatives.
12. Key Takeaways from Bloom Energy’s Q4 Results
It was good to see Bloom Energy beat analysts’ EPS expectations this quarter. We were also excited its EBITDA outperformed Wall Street’s estimates by a wide margin. On the other hand, its Service revenue missed. Zooming out, we think this was a good print with some key areas of upside. The stock traded up 9.1% to $151 immediately following the results.
13. Is Now The Time To Buy Bloom Energy?
Updated: March 25, 2026 at 11:46 PM EDT
Before investing in or passing on Bloom Energy, we urge you to understand the company’s business quality (or lack thereof), valuation, and the latest quarterly results - in that order.
There is a lot to like about Bloom Energy. To begin with, its revenue growth was exceptional over the last five years, and its growth over the next 12 months is expected to accelerate. And while its relatively low ROIC suggests management has struggled to find compelling investment opportunities, its rising cash profitability gives it more optionality. On top of that, Bloom Energy’s expanding operating margin shows the business has become more efficient.
Bloom Energy’s P/E ratio based on the next 12 months is 105.1x. Expectations are high given its premium multiple, but we’ll happily own Bloom Energy as its fundamentals illustrate it’s clearly doing something special. Investments like this should be held patiently for at least three to five years as they benefit from the power of long-term compounding, which more than makes up for any short-term price volatility that comes with high valuations.
Wall Street analysts have a consensus one-year price target of $144.08 on the company (compared to the current share price of $149.13).