
Benchmark (BHE)
Benchmark doesn’t excite us. Its poor returns on capital indicate it barely generated any profits, a must for high-quality companies.― StockStory Analyst Team
1. News


2. Summary
Why Benchmark Is Not Exciting
Operating as a critical behind-the-scenes partner for complex technology products since 1979, Benchmark Electronics (NYSE:BHE) provides advanced manufacturing, engineering, and technology solutions for original equipment manufacturers across aerospace, medical, industrial, and technology sectors.
- Low free cash flow margin gives it little breathing room, constraining its ability to self-fund growth or return capital to shareholders
- Operating margin falls short of the industry average, and the smaller profit dollars make it harder to react to unexpected market developments
- On the bright side, its incremental sales over the last five years have been highly profitable as its earnings per share increased by 20.4% annually, topping its revenue gains


Benchmark’s quality is inadequate. We see more lucrative opportunities elsewhere.
Why There Are Better Opportunities Than Benchmark


Benchmark is trading at $59.04 per share, or 23.4x forward P/E. Not only is Benchmark’s multiple richer than most business services peers, but it’s also expensive for its fundamentals.
There are stocks out there similarly priced with better business quality. We prefer owning these.
3. Benchmark (BHE) Research Report: Q4 CY2025 Update
Electronics manufacturing services provider Benchmark (NYSE:BHE) reported Q4 CY2025 results topping the market’s revenue expectations, with sales up 7.2% year on year to $704.3 million. Guidance for next quarter’s revenue was better than expected at $675 million at the midpoint, 1.8% above analysts’ estimates. Its non-GAAP profit of $0.71 per share was 10.9% above analysts’ consensus estimates.
Benchmark (BHE) Q4 CY2025 Highlights:
- Revenue: $704.3 million vs analyst estimates of $696.7 million (7.2% year-on-year growth, 1.1% beat)
- Adjusted EPS: $0.71 vs analyst estimates of $0.64 (10.9% beat)
- Adjusted EBITDA: $49.34 million (7% margin, 20.7% year-on-year growth)
- Revenue Guidance for Q1 CY2026 is $675 million at the midpoint, above analyst estimates of $662.8 million
- Adjusted EPS guidance for Q1 CY2026 is $0.56 at the midpoint, above analyst estimates of $0.55
- Operating Margin: 2.9%, down from 4.5% in the same quarter last year
- Free Cash Flow Margin: 8.3%, up from 5.7% in the same quarter last year
- Market Capitalization: $1.92 billion
Company Overview
Operating as a critical behind-the-scenes partner for complex technology products since 1979, Benchmark Electronics (NYSE:BHE) provides advanced manufacturing, engineering, and technology solutions for original equipment manufacturers across aerospace, medical, industrial, and technology sectors.
Benchmark specializes in three core service areas that help bring sophisticated products to market. Its manufacturing services include printed circuit board assembly, complex subsystem integration, and complete system builds that can be shipped directly to end customers. The company also offers precision technology services such as machining, metal joining, and assembly for industries requiring exacting tolerances.
Design and engineering services form another key pillar of Benchmark's business, where its teams help customers optimize products for manufacturability, develop test protocols, and provide regulatory guidance. The company can engage at any point in a customer's design process, from initial concept through production.
Benchmark has also developed proprietary technology solutions, including reference designs and building blocks for defense systems, surveillance equipment, and radio frequency subsystems. For example, a defense contractor might partner with Benchmark to develop ruggedized communications equipment for harsh battlefield environments, leveraging the company's expertise in both design and manufacturing.
The company operates through a global network of facilities across seven countries, including the United States, Mexico, China, and several European locations. This footprint allows Benchmark to serve multinational customers with consistent quality standards while providing regional support.
Benchmark's business model relies on establishing long-term relationships with OEMs who outsource their manufacturing needs. The company typically operates under master supply agreements, providing services throughout a product's lifecycle from design through aftermarket support. Revenue comes from both the engineering services and the actual manufacturing of products, with customers paying for Benchmark's technical expertise, manufacturing capabilities, and supply chain management.
4. Electronic Components & Manufacturing
The sector could see higher demand as the prevalence of advanced electronics increases in industries such as automotive, healthcare, aerospace, and computing. The high-performance components and contract manufacturing expertise required for autonomous vehicles and cloud computing datacenters, for instance, will benefit companies in the space. However, headwinds include geopolitical risks, particularly U.S.-China trade tensions that could disrupt component sourcing and production as the Trump administration takes an increasingly antagonizing stance on foreign relations. Additionally, stringent environmental regulations on e-waste and emissions could force the industry to pivot in potentially costly ways.
Benchmark Electronics competes with other electronics manufacturing services providers including Celestica (NYSE:CLS), Flex (NASDAQ:FLEX), Jabil (NYSE:JBL), Plexus (NASDAQ:PLXS), and Sanmina (NASDAQ:SANM).
5. Revenue Growth
Examining a company’s long-term performance can provide clues about its quality. Any business can put up a good quarter or two, but the best consistently grow over the long haul.
With $2.66 billion in revenue over the past 12 months, Benchmark is a mid-sized business services company, which sometimes brings disadvantages compared to larger competitors benefiting from better economies of scale. On the bright side, it can still flex high growth rates because it’s working from a smaller revenue base.
As you can see below, Benchmark’s sales grew at a decent 5.3% compounded annual growth rate over the last five years. This shows its offerings generated slightly more demand than the average business services company, a useful starting point for our analysis.
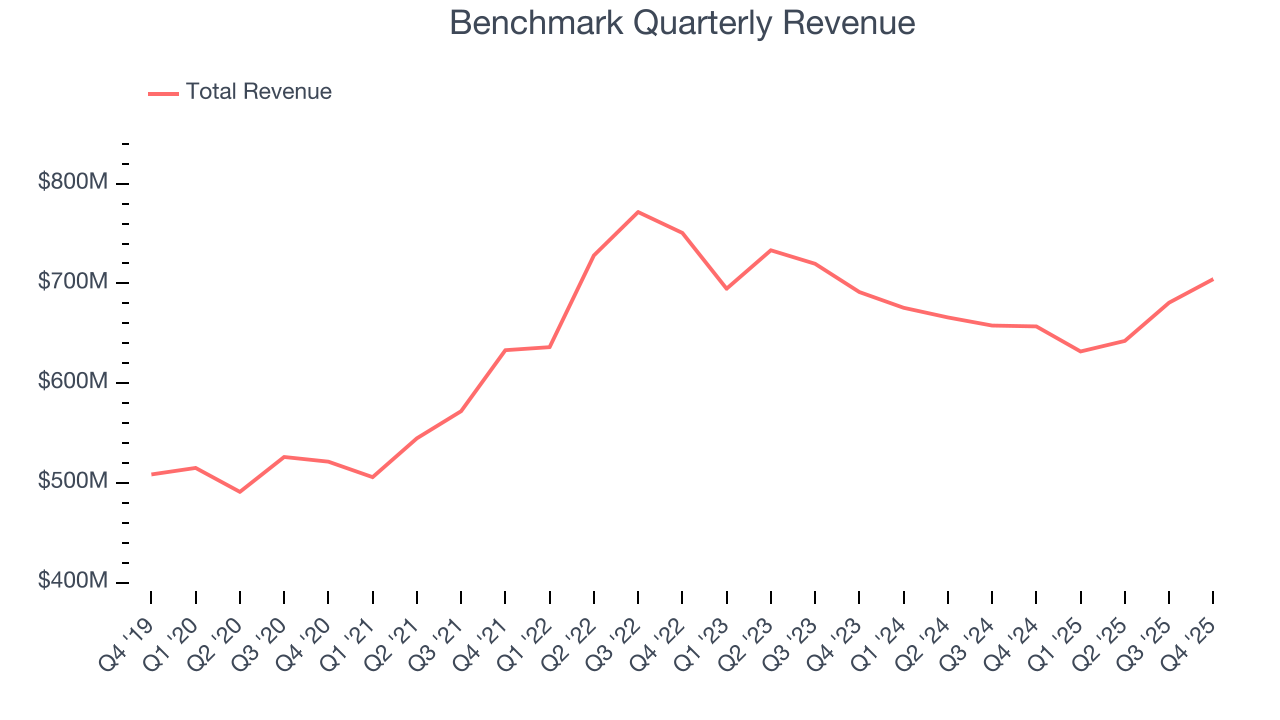
Long-term growth is the most important, but within business services, a half-decade historical view may miss new innovations or demand cycles. Benchmark’s recent performance marks a sharp pivot from its five-year trend as its revenue has shown annualized declines of 3.2% over the last two years. 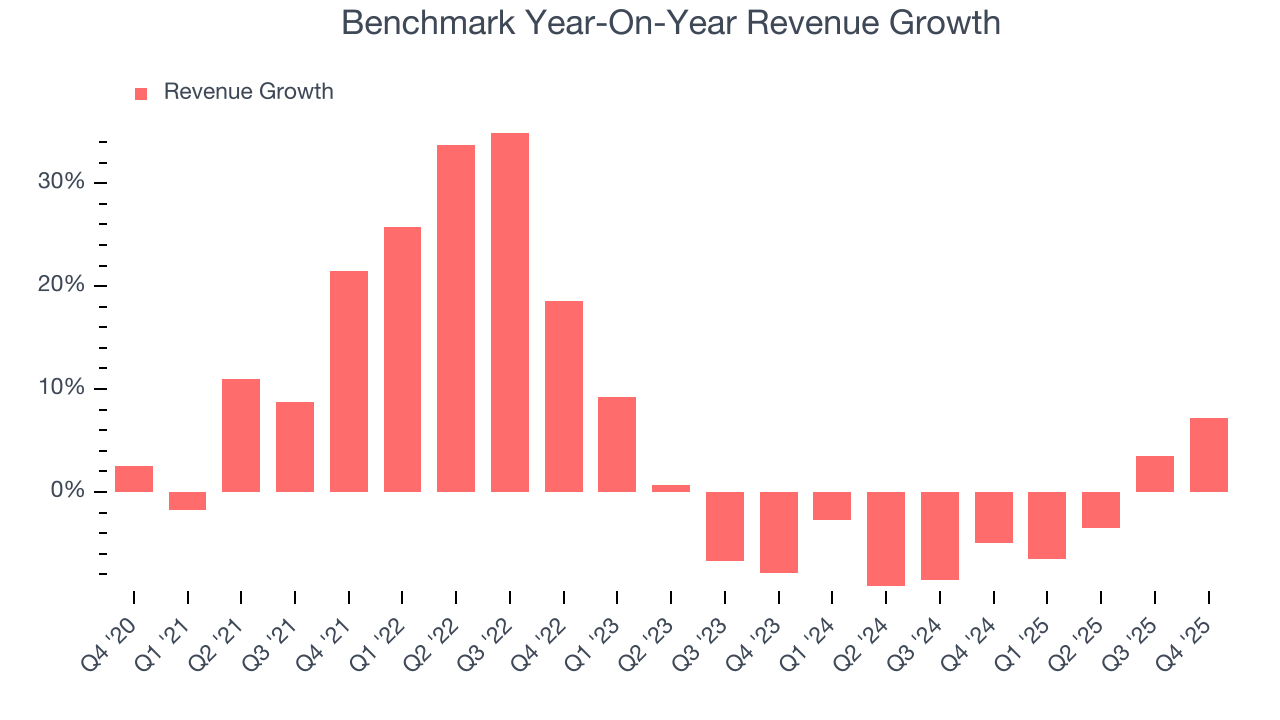
This quarter, Benchmark reported year-on-year revenue growth of 7.2%, and its $704.3 million of revenue exceeded Wall Street’s estimates by 1.1%. Company management is currently guiding for a 6.8% year-on-year increase in sales next quarter.
Looking further ahead, sell-side analysts expect revenue to grow 4.6% over the next 12 months. Although this projection implies its newer products and services will fuel better top-line performance, it is still below the sector average.
6. Operating Margin
Benchmark’s operating margin might fluctuated slightly over the last 12 months but has remained more or less the same, averaging 3.7% over the last five years. This profitability was lousy for a business services business and caused by its suboptimal cost structure.
Analyzing the trend in its profitability, Benchmark’s operating margin might fluctuated slightly but has generally stayed the same over the last five years. This raises questions about the company’s expense base because its revenue growth should have given it leverage on its fixed costs, resulting in better economies of scale and profitability.
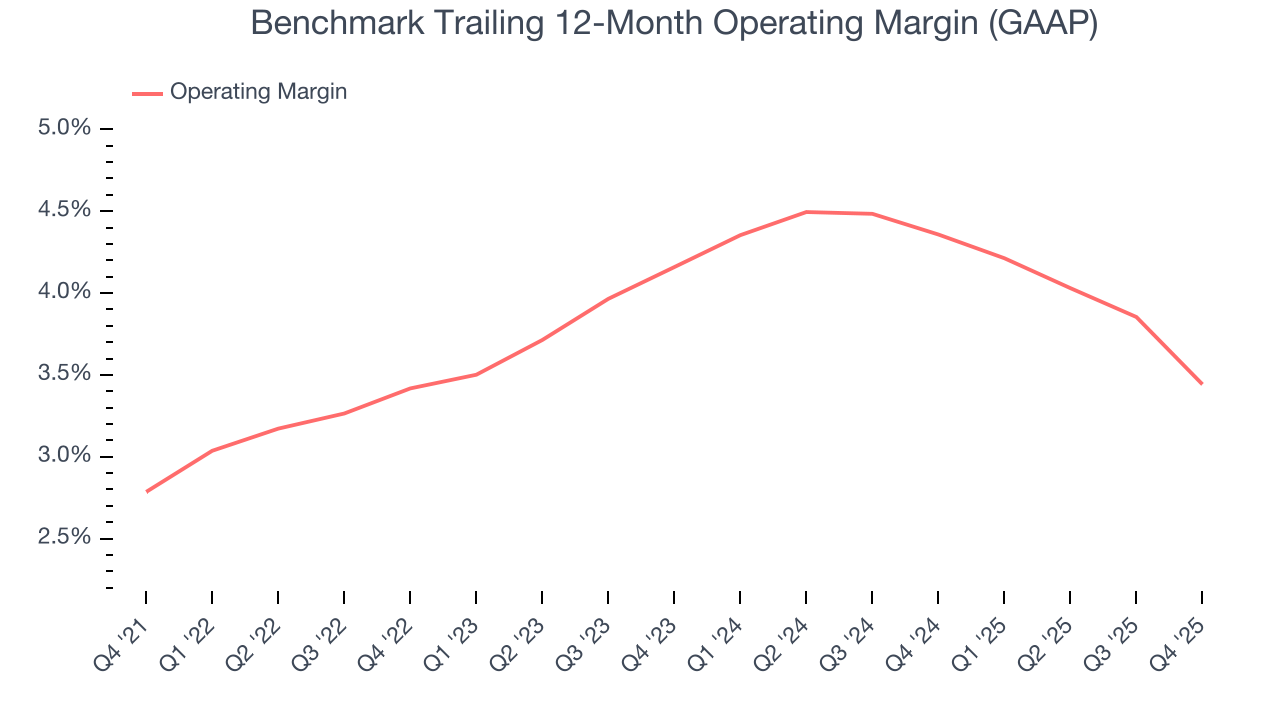
In Q4, Benchmark generated an operating margin profit margin of 2.9%, down 1.6 percentage points year on year. This reduction is quite minuscule and indicates the company’s overall cost structure has been relatively stable.
7. Earnings Per Share
Revenue trends explain a company’s historical growth, but the long-term change in earnings per share (EPS) points to the profitability of that growth – for example, a company could inflate its sales through excessive spending on advertising and promotions.
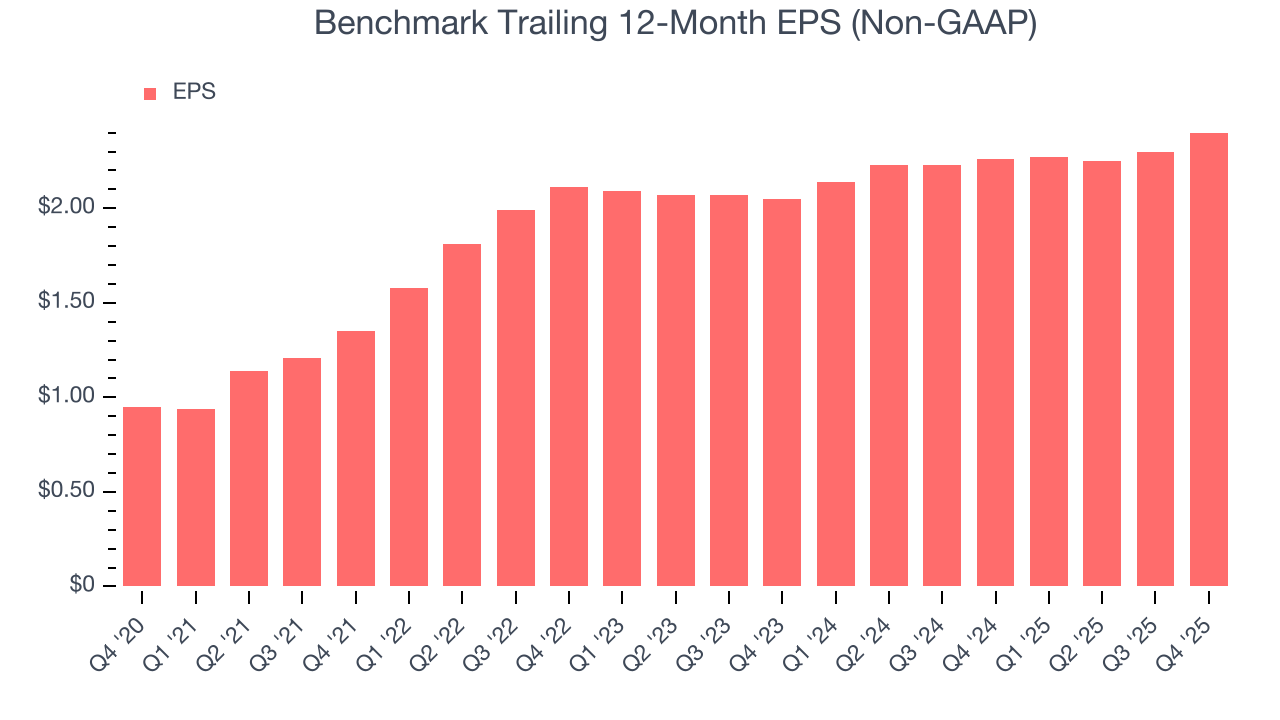
Benchmark’s EPS grew at an astounding 20.4% compounded annual growth rate over the last five years, higher than its 5.3% annualized revenue growth. However, this alone doesn’t tell us much about its business quality because its operating margin didn’t improve.
Like with revenue, we analyze EPS over a more recent period because it can provide insight into an emerging theme or development for the business.
For Benchmark, its two-year annual EPS growth of 8.2% was lower than its five-year trend. We hope its growth can accelerate in the future.
In Q4, Benchmark reported adjusted EPS of $0.71, up from $0.61 in the same quarter last year. This print easily cleared analysts’ estimates, and shareholders should be content with the results. Over the next 12 months, Wall Street expects Benchmark’s full-year EPS of $2.40 to grow 3.6%.
8. Cash Is King
Free cash flow isn't a prominently featured metric in company financials and earnings releases, but we think it's telling because it accounts for all operating and capital expenses, making it tough to manipulate. Cash is king.
Benchmark broke even from a free cash flow perspective over the last five years, giving the company limited opportunities to return capital to shareholders.
Taking a step back, an encouraging sign is that Benchmark’s margin expanded by 5.5 percentage points during that time. The company’s improvement shows it’s heading in the right direction, and we can see it became a less capital-intensive business because its free cash flow profitability rose while its operating profitability was flat.
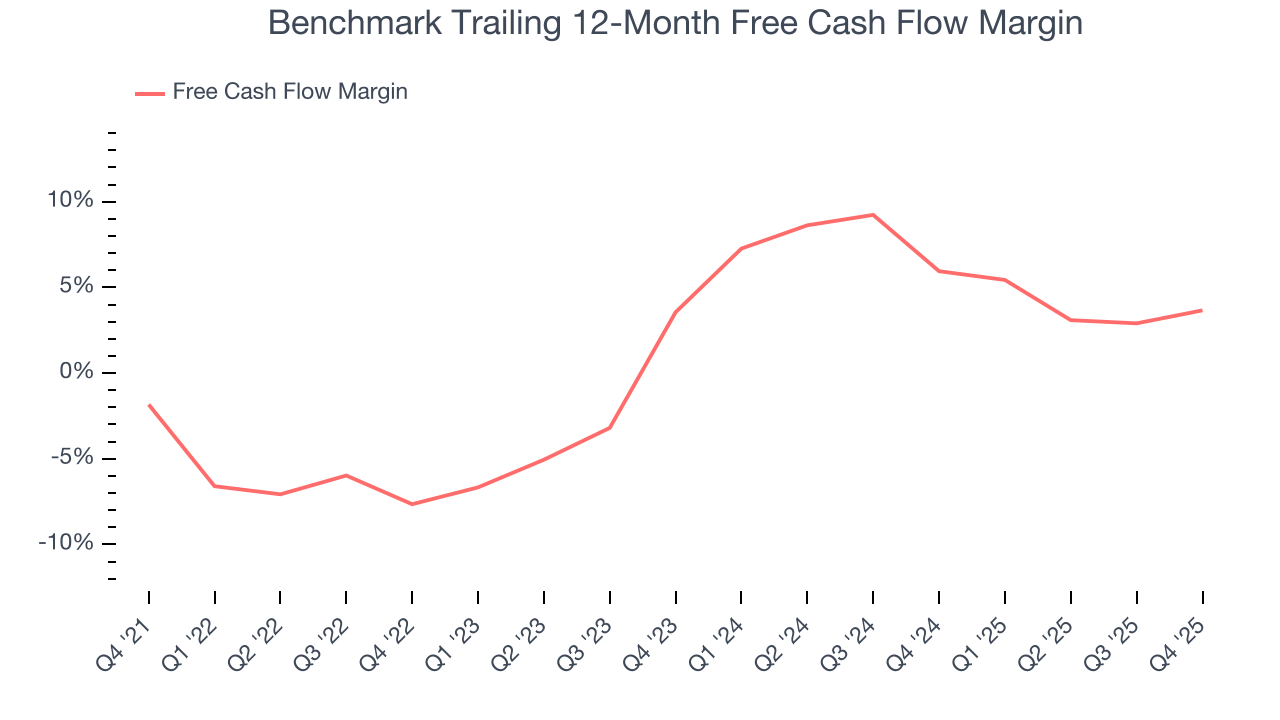
Benchmark’s free cash flow clocked in at $58.68 million in Q4, equivalent to a 8.3% margin. This result was good as its margin was 2.7 percentage points higher than in the same quarter last year, building on its favorable historical trend.
9. Return on Invested Capital (ROIC)
EPS and free cash flow tell us whether a company was profitable while growing its revenue. But was it capital-efficient? A company’s ROIC explains this by showing how much operating profit it makes compared to the money it has raised (debt and equity).
Benchmark historically did a mediocre job investing in profitable growth initiatives. Its five-year average ROIC was 7.1%, somewhat low compared to the best business services companies that consistently pump out 25%+.
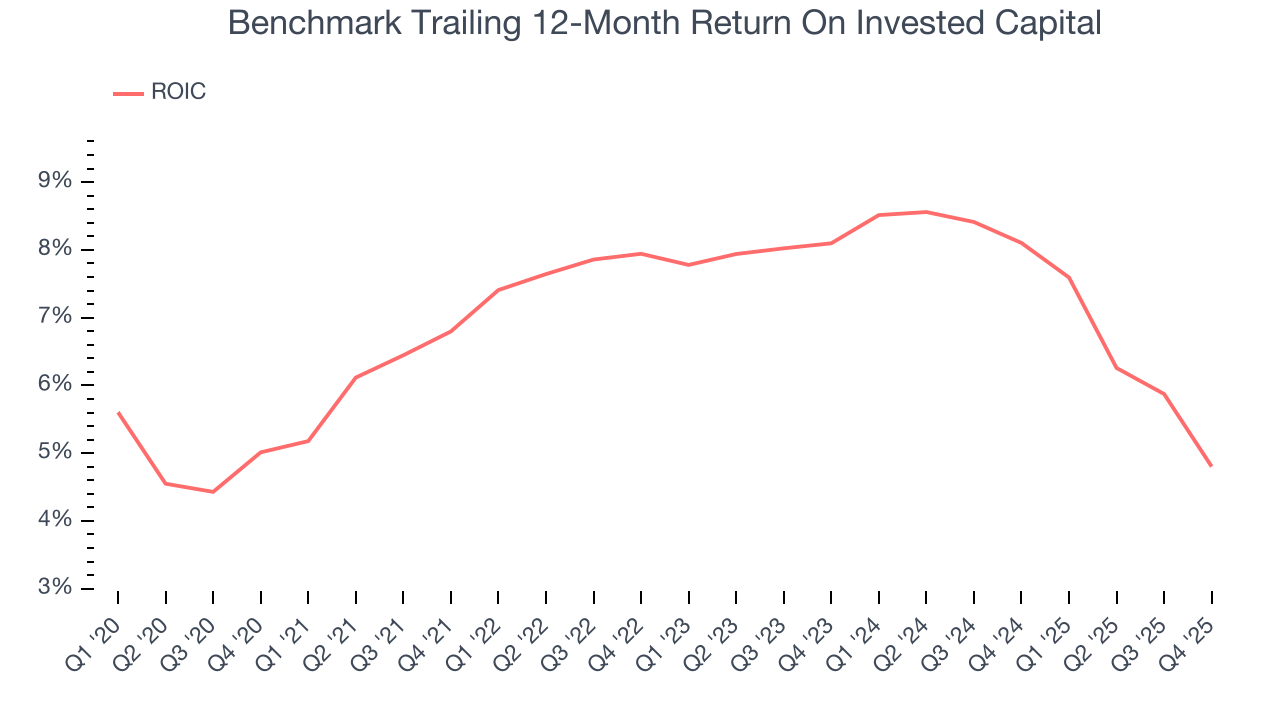
We like to invest in businesses with high returns, but the trend in a company’s ROIC is what often surprises the market and moves the stock price. Unfortunately, Benchmark’s ROIC has stayed the same over the last few years. If the company wants to become an investable business, it must improve its returns by generating more profitable growth.
10. Balance Sheet Assessment
One of the best ways to mitigate bankruptcy risk is to hold more cash than debt.
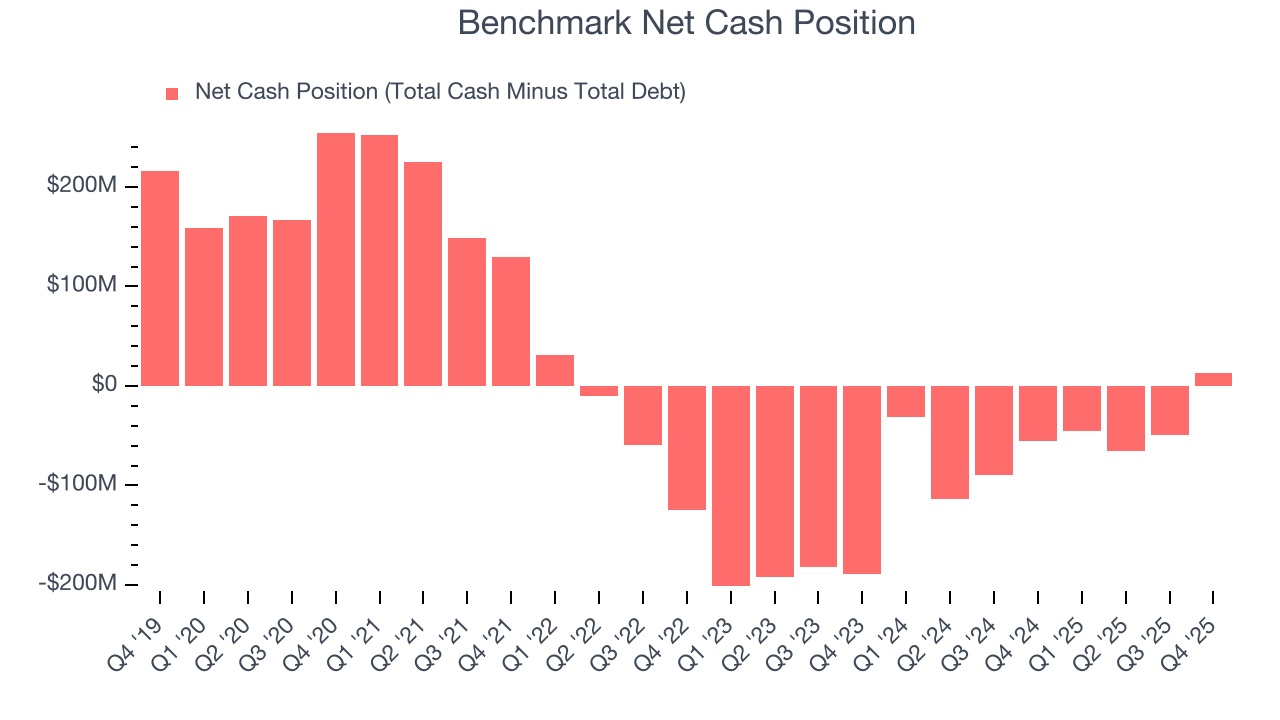
Benchmark is a profitable, well-capitalized company with $322.4 million of cash and $309.3 million of debt on its balance sheet. This $13.14 million net cash position gives it the freedom to borrow money, return capital to shareholders, or invest in growth initiatives. Leverage is not an issue here.
11. Key Takeaways from Benchmark’s Q4 Results
It was great to see Benchmark’s revenue guidance for next quarter top analysts’ expectations. We were also glad its EPS outperformed Wall Street’s estimates. Zooming out, we think this quarter featured some important positives. The stock remained flat at $56.09 immediately after reporting.
12. Is Now The Time To Buy Benchmark?
Updated: March 25, 2026 at 11:50 PM EDT
The latest quarterly earnings matters, sure, but we actually think longer-term fundamentals and valuation matter more. Investors should consider all these pieces before deciding whether or not to invest in Benchmark.
Benchmark isn’t a terrible business, but it isn’t one of our picks. Although its revenue growth was decent over the last five years and Wall Street believes it will continue to grow, its low free cash flow margins give it little breathing room. And while the company’s rising cash profitability gives it more optionality, the downside is its operating margins reveal poor profitability compared to other business services companies.
Benchmark’s P/E ratio based on the next 12 months is 23.4x. This valuation tells us a lot of optimism is priced in - you can find more timely opportunities elsewhere.
Wall Street analysts have a consensus one-year price target of $59.33 on the company (compared to the current share price of $59.04).