
BILL (BILL)
BILL doesn’t excite us. Its revenue growth has decelerated and its historical operating losses don’t give us confidence in a turnaround.― StockStory Analyst Team
1. News


2. Summary
Why BILL Is Not Exciting
Transforming the messy back-office financial operations that plague small business owners, BILL (NYSE:BILL) provides a cloud-based platform that automates accounts payable, accounts receivable, and expense management for small and midsize businesses.
- Operating margin expanded by 3.1 percentage points over the last year as it scaled and became more efficient
- Estimated sales growth of 10.5% for the next 12 months implies demand will slow from its two-year trend
- A silver lining is that its market share has increased as its 54.8% annual revenue growth over the last five years was exceptional


BILL doesn’t fulfill our quality requirements. We see more attractive opportunities in the market.
Why There Are Better Opportunities Than BILL


BILL’s stock price of $48.42 implies a valuation ratio of 2.9x forward price-to-sales. BILL’s valuation may seem like a bargain, but we think there are valid reasons why it’s so cheap.
Cheap stocks can look like great bargains at first glance, but you often get what you pay for. These mediocre businesses often have less earnings power, meaning there is more reliance on a re-rating to generate good returns - an unlikely scenario for low-quality companies.
3. BILL (BILL) Research Report: Q3 CY2025 Update
Financial automation platform BILL (NYSE:BILL) reported Q3 CY2025 results topping the market’s revenue expectations, with sales up 10.4% year on year to $395.7 million. The company expects next quarter’s revenue to be around $399.5 million, close to analysts’ estimates. Its non-GAAP profit of $0.61 per share was 20.5% above analysts’ consensus estimates.
BILL (BILL) Q3 CY2025 Highlights:
- Revenue: $395.7 million vs analyst estimates of $391 million (10.4% year-on-year growth, 1.2% beat)
- Adjusted EPS: $0.61 vs analyst estimates of $0.51 (20.5% beat)
- Adjusted Operating Income: $68.24 million vs analyst estimates of $56.54 million (17.2% margin, 20.7% beat)
- The company slightly lifted its revenue guidance for the full year to $1.61 billion at the midpoint from $1.61 billion
- Management raised its full-year Adjusted EPS guidance to $2.18 at the midpoint, a 3.8% increase
- Operating Margin: -5.2%, down from -2.1% in the same quarter last year
- Free Cash Flow Margin: 20.8%, up from 17.9% in the previous quarter
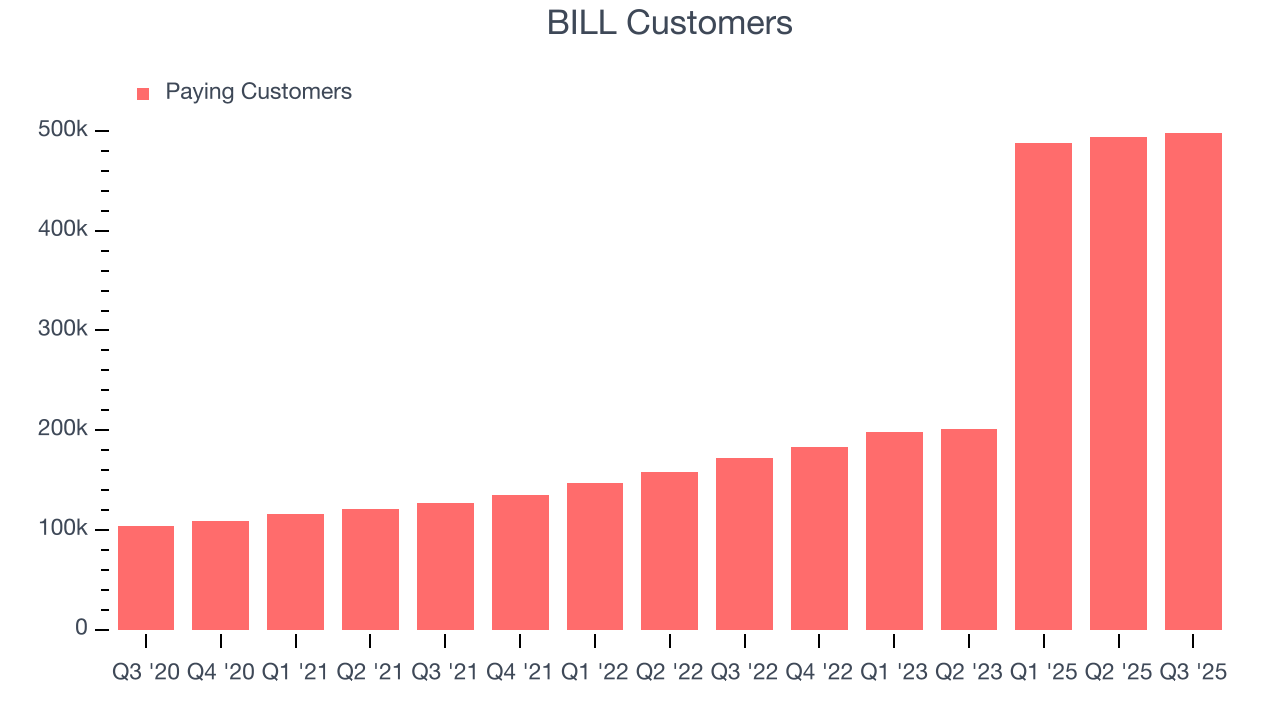
- Customers: 498,100, up from 493,800 in the previous quarter
- Market Capitalization: $4.73 billion
Company Overview
Transforming the messy back-office financial operations that plague small business owners, BILL (NYSE:BILL) provides a cloud-based platform that automates accounts payable, accounts receivable, and expense management for small and midsize businesses.
BILL's integrated platform connects businesses with their suppliers and clients to streamline financial workflows. The system automates the entire lifecycle of transactions—from capturing invoice data and routing approvals to processing payments and reconciling with accounting software. This automation eliminates manual data entry and paper-based processes that traditionally burden small business accounting departments.
For accounts payable, BILL uses artificial intelligence to extract key information from incoming bills, route them through customizable approval workflows, and schedule payments. On the accounts receivable side, businesses can create and send professional invoices electronically, track when clients view them, and accept various payment methods. The company's spend management solution includes corporate cards with built-in controls and real-time budget tracking.
A construction company, for example, might use BILL to automatically process supplier invoices for building materials, route them to project managers for approval, schedule timely payments, and sync everything back to their accounting system—all while monitoring cash flow in real-time.
BILL generates revenue through subscription fees and payment processing services. Its platform connects to popular accounting software like QuickBooks, Xero, and NetSuite, making it attractive to small businesses and their accountants. The company's network effects strengthen as more businesses join, making it easier for users to pay and get paid electronically without sharing sensitive banking information.
4. Finance and Accounting Software
Finance and accounting software benefits from dual trends around costs savings and ease of use. First is the SaaS-ification of businesses, large and small, who much prefer the flexibility of cloud-based, web-browser delivered software paid for on a subscription basis than the hassle and expense of purchasing and managing on-premise enterprise software. Second is the consumerization of business software, whereby multiple standalone processes like supply chain and tax management are aggregated into a single, easy to use platforms.
BILL competes with financial software providers like Intuit (NASDAQ:INTU), Oracle NetSuite (NYSE:ORCL), and Sage Group (LON:SGE), payment processors including PayPal (NASDAQ:PYPL) and Stripe (private), and expense management platforms such as SAP Concur (NYSE:SAP) and Expensify (NASDAQ:EXFY).
5. Revenue Growth
Examining a company’s long-term performance can provide clues about its quality. Even a bad business can shine for one or two quarters, but a top-tier one grows for years. Thankfully, BILL’s 54.8% annualized revenue growth over the last five years was incredible. Its growth beat the average software company and shows its offerings resonate with customers, a helpful starting point for our analysis.
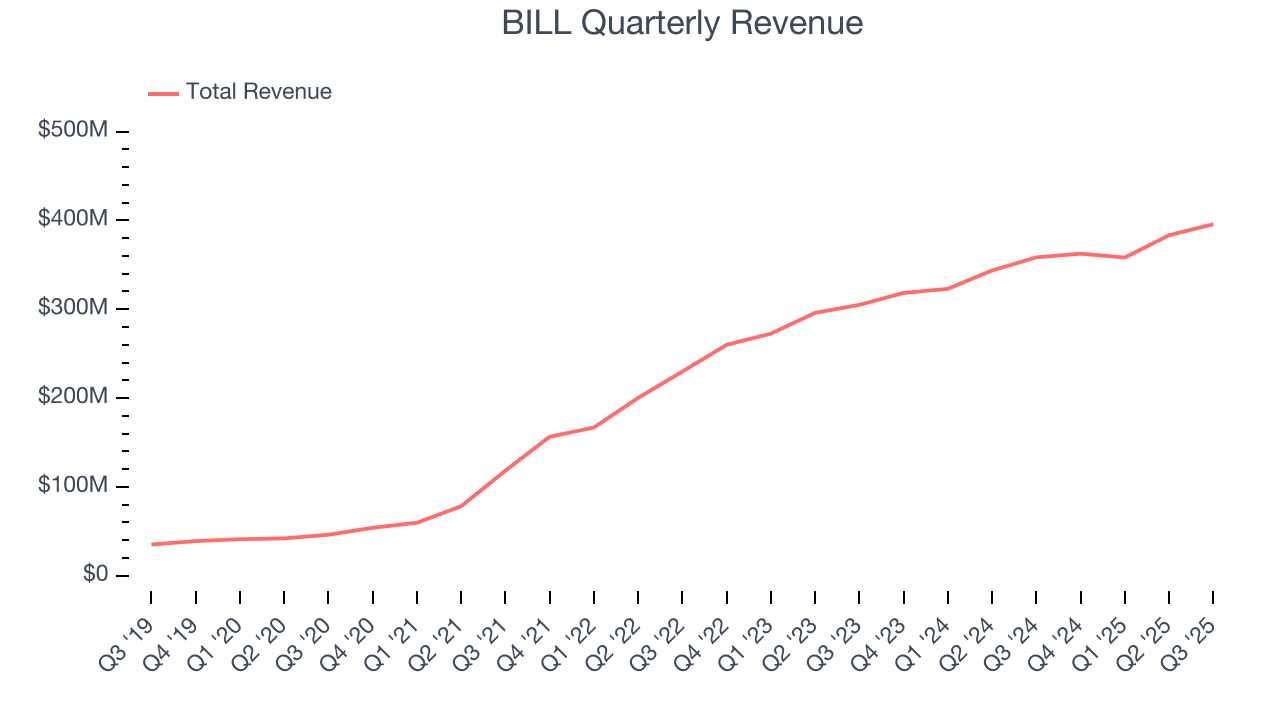
We at StockStory place the most emphasis on long-term growth, but within software, a half-decade historical view may miss recent innovations or disruptive industry trends. BILL’s annualized revenue growth of 15% over the last two years is below its five-year trend, but we still think the results were respectable. 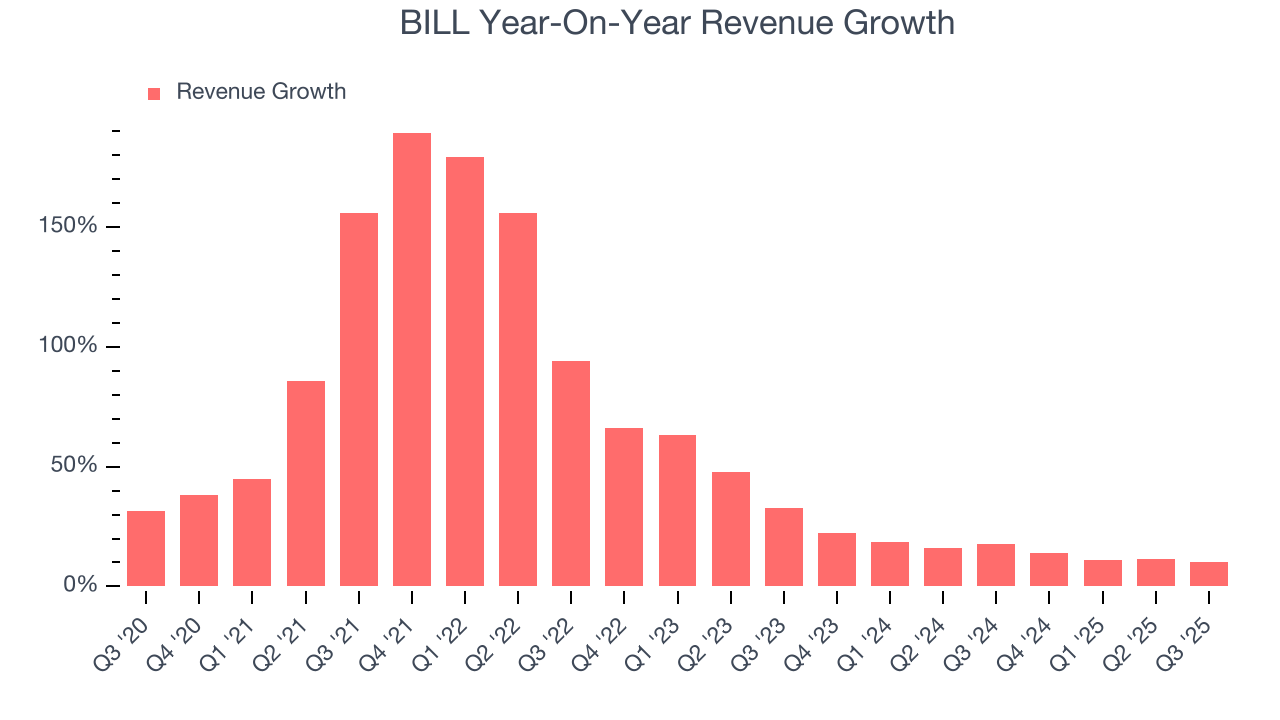
This quarter, BILL reported year-on-year revenue growth of 10.4%, and its $395.7 million of revenue exceeded Wall Street’s estimates by 1.2%. Company management is currently guiding for a 10.2% year-on-year increase in sales next quarter.
Looking further ahead, sell-side analysts expect revenue to grow 10.8% over the next 12 months, a deceleration versus the last two years. This projection is underwhelming and indicates its products and services will see some demand headwinds. At least the company is tracking well in other measures of financial health.
6. Billings
Billings is a non-GAAP metric that is often called “cash revenue” because it shows how much money the company has collected from customers in a certain period. This is different from revenue, which must be recognized in pieces over the length of a contract.
BILL’s billings came in at $394.1 million in Q3, and over the last four quarters, its growth was underwhelming as it averaged 11.9% year-on-year increases. This performance mirrored its total sales and suggests that increasing competition is causing challenges in acquiring/retaining customers. 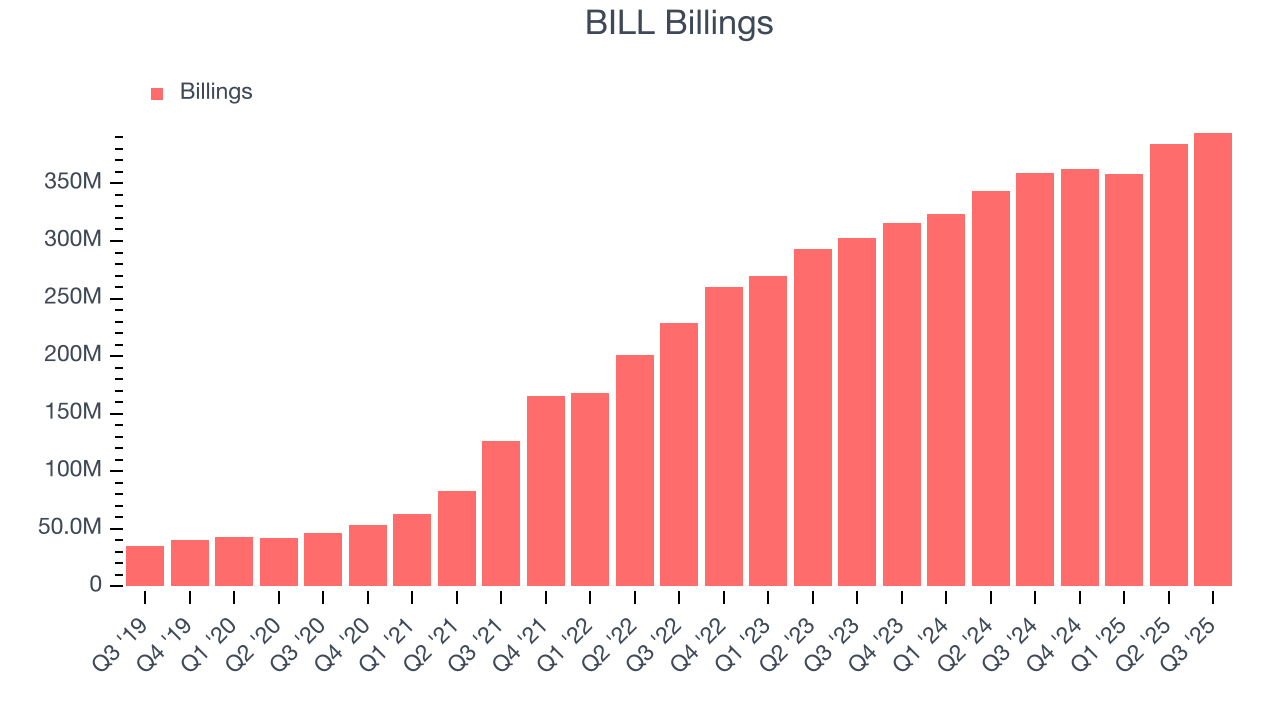
7. Customer Base
BILL reported 498,100 customers at the end of the quarter, a sequential increase of 4,300. That’s a little worse than last quarter but in line with what we’ve observed in past quarters, suggesting the company still has decent sales momentum despite the weaker quarter.
8. Customer Acquisition Efficiency
The customer acquisition cost (CAC) payback period represents the months required to recover the cost of acquiring a new customer. Essentially, it’s the break-even point for sales and marketing investments. A shorter CAC payback period is ideal, as it implies better returns on investment and business scalability.
BILL is extremely efficient at acquiring new customers, and its CAC payback period checked in at 16.1 months this quarter. The company’s rapid sales cycles stem from its strong brand reputation and self-serve model, where it can onboard many small customers with little to no oversight. These dynamics give BILL more resources to pursue new product initiatives so it can potentially move up market and serve enterprise clients, which can provide a second leg of growth. 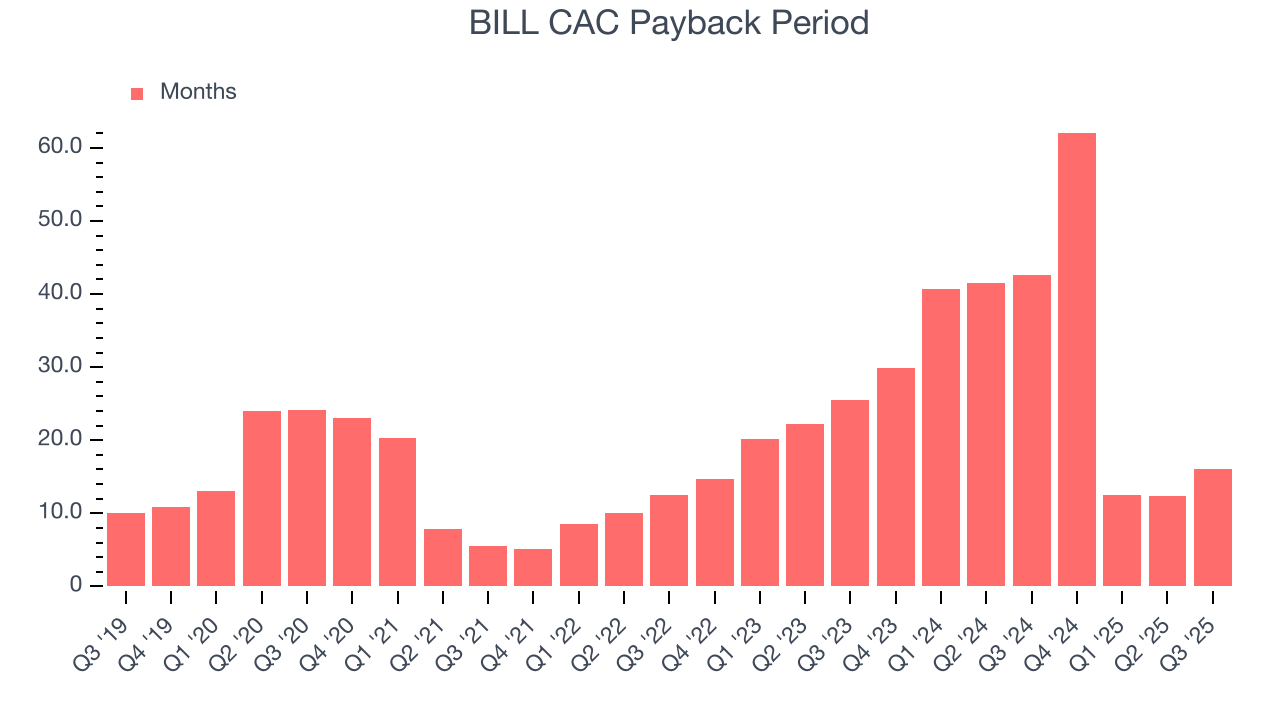
9. Gross Margin & Pricing Power
What makes the software-as-a-service model so attractive is that once the software is developed, it usually doesn’t cost much to provide it as an ongoing service. These minimal costs can include servers, licenses, and certain personnel.
BILL’s gross margin is one of the highest in the software sector, an output of its asset-lite business model and strong pricing power. It also enables the company to fund large investments in new products and sales during periods of rapid growth to achieve outsized profits at scale. As you can see below, it averaged an elite 83.1% gross margin over the last year. Said differently, roughly $83.12 was left to spend on selling, marketing, and R&D for every $100 in revenue.
The market not only cares about gross margin levels but also how they change over time because expansion creates firepower for profitability and free cash generation. BILL has seen gross margins decline by 2.7 percentage points over the last 2 year, which is among the worst in the software space.
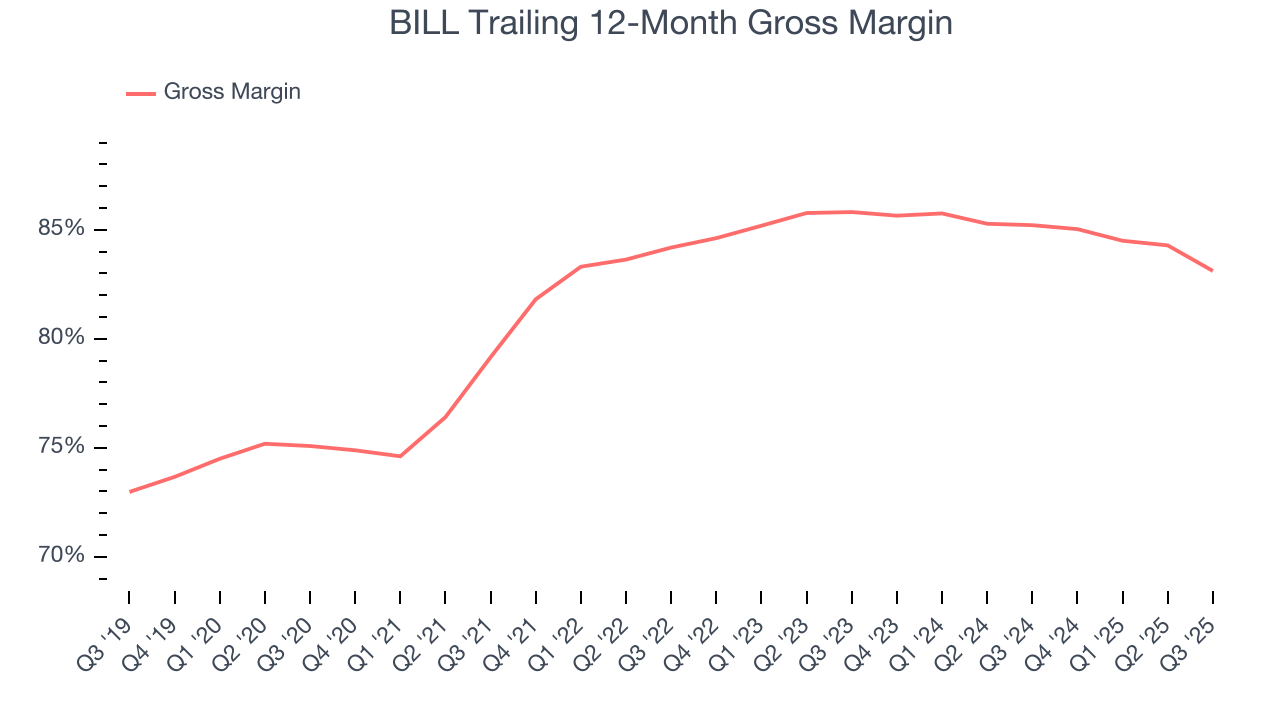
In Q3, BILL produced a 80.5% gross profit margin, marking a 4.5 percentage point decrease from 85.1% in the same quarter last year. BILL’s full-year margin has also been trending down over the past 12 months, decreasing by 2.1 percentage points. If this move continues, it could suggest a more competitive environment with some pressure to lower prices and higher input costs.
10. Operating Margin
Many software businesses adjust their profits for stock-based compensation (SBC), but we prioritize GAAP operating margin because SBC is a real expense used to attract and retain engineering and sales talent. This metric shows how much revenue remains after accounting for all core expenses – everything from the cost of goods sold to sales and R&D.
BILL’s expensive cost structure has contributed to an average operating margin of negative 6.2% over the last year. Unprofitable, high-growth software companies require extra attention because they spend heaps of money to capture market share. As seen in its fast historical revenue growth, this strategy seems to have worked so far, but it’s unclear what would happen if BILL reeled back its investments. Wall Street seems to think it will face some obstacles, and we tend to agree.
Over the last two years, BILL’s expanding sales gave it operating leverage as its margin rose by 3.1 percentage points. Still, it will take much more for the company to reach long-term profitability.
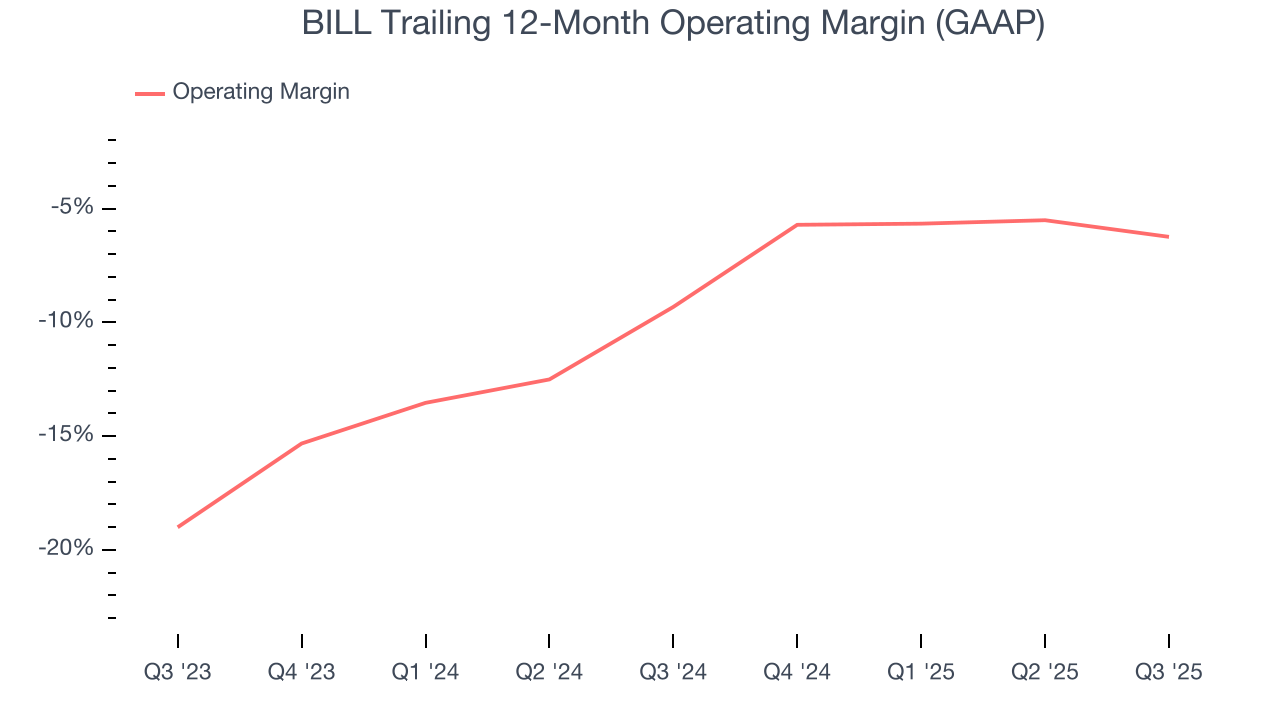
This quarter, BILL generated a negative 5.2% operating margin.
11. Cash Is King
Free cash flow isn't a prominently featured metric in company financials and earnings releases, but we think it's telling because it accounts for all operating and capital expenses, making it tough to manipulate. Cash is king.
BILL has shown impressive cash profitability, driven by its attractive business model and cost-effective customer acquisition strategy that give it the option to invest in new products and services rather than sales and marketing. The company’s free cash flow margin averaged 20.9% over the last year, better than the broader software sector. The divergence from its underwhelming operating margin stems from the add-back of non-cash charges like depreciation and stock-based compensation. GAAP operating profit expenses these line items, but free cash flow does not.
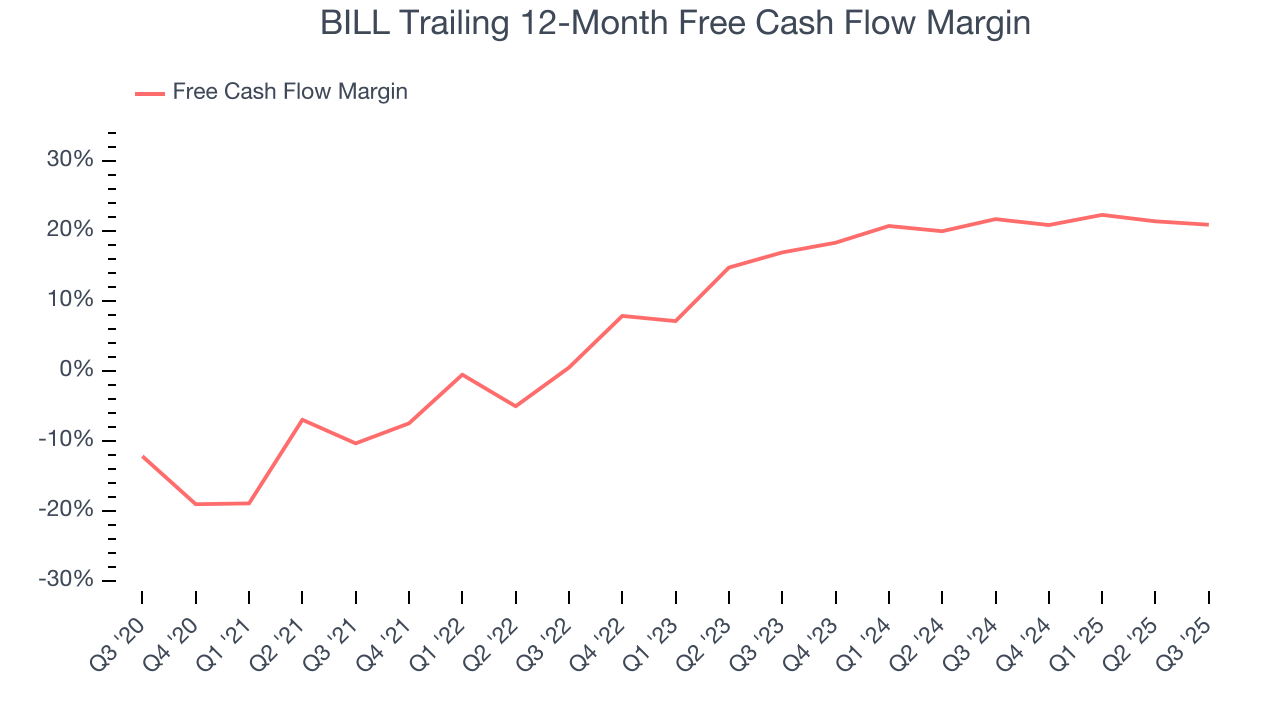
BILL’s free cash flow clocked in at $82.26 million in Q3, equivalent to a 20.8% margin. The company’s cash profitability regressed as it was 2 percentage points lower than in the same quarter last year, prompting us to pay closer attention. Short-term fluctuations typically aren’t a big deal because investment needs can be seasonal, but we’ll be watching to see if the trend extrapolates into future quarters.
Over the next year, analysts’ consensus estimates show they’re expecting BILL’s free cash flow margin of 20.9% for the last 12 months to remain the same.
12. Balance Sheet Assessment
Businesses that maintain a cash surplus face reduced bankruptcy risk.
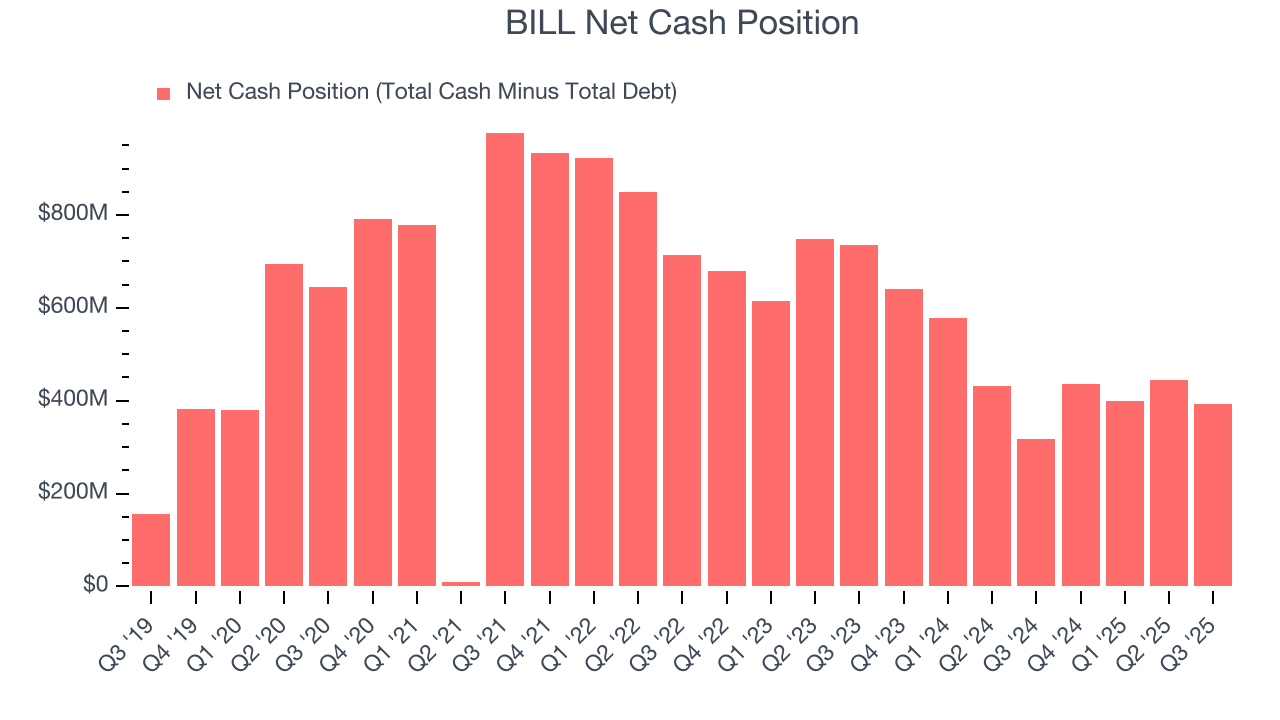
BILL is a well-capitalized company with $2.31 billion of cash and $1.92 billion of debt on its balance sheet. This $393.3 million net cash position is 8.6% of its market cap and gives it the freedom to borrow money, return capital to shareholders, or invest in growth initiatives. Leverage is not an issue here.
13. Key Takeaways from BILL’s Q3 Results
It was great to see BILL raise its full-year revenue and EPS guidance. We were also glad this quarter's revenue, EPS, and EBITDA exceeded Wall Street’s estimates. Overall, this print had some key positives. The stock traded up 5.7% to $46.94 immediately after reporting.
14. Is Now The Time To Buy BILL?
Updated: January 24, 2026 at 9:01 PM EST
The latest quarterly earnings matters, sure, but we actually think longer-term fundamentals and valuation matter more. Investors should consider all these pieces before deciding whether or not to invest in BILL.
When it comes to BILL’s business quality, there are some positives, but it ultimately falls short. First off, its revenue growth was exceptional over the last five years. And while BILL’s expanding operating margin shows it’s becoming more efficient at building and selling its software, its efficient sales strategy allows it to target and onboard new users at scale.
BILL’s price-to-sales ratio based on the next 12 months is 2.9x. This valuation multiple is fair, but we don’t have much faith in the company. We're fairly confident there are better investments elsewhere.
Wall Street analysts have a consensus one-year price target of $61.59 on the company (compared to the current share price of $48.42).