
Brown & Brown (BRO)
We like Brown & Brown. Its ability to balance growth and profitability while maintaining a bright outlook makes it a gem.― StockStory Analyst Team
1. News


2. Summary
Why We Like Brown & Brown
With roots dating back to 1939 and operations spanning 44 U.S. states and 14 countries, Brown & Brown (NYSE:BRO) is an insurance brokerage and risk management firm that markets and sells insurance products across property, casualty, and employee benefits sectors.
- Impressive 17.7% annual revenue growth over the last five years indicates it’s winning market share this cycle
- Earnings per share grew by 20.5% annually over the last five years, massively outpacing its peers
- Market share is on track to rise over the next 12 months as its 21.7% projected revenue growth implies demand will accelerate from its two-year trend


We’re fond of companies like Brown & Brown. The valuation looks fair relative to its quality, so this might be a favorable time to invest in some shares.
Why Is Now The Time To Buy Brown & Brown?


Brown & Brown’s stock price of $67.81 implies a valuation ratio of 14.9x forward P/E. The valuation multiple is below many companies in the business services sector. We therefore think the stock is a good deal for the fundamentals.
Our analysis and backtests show high-quality businesses routinely outperform the market over a multi-year period, especially when priced like this.
3. Brown & Brown (BRO) Research Report: Q4 CY2025 Update
Insurance brokerage firm Brown & Brown (NYSE:BRO) fell short of the markets revenue expectations in Q4 CY2025, but sales rose 36% year on year to $1.61 billion. Its non-GAAP profit of $0.93 per share was 3.3% above analysts’ consensus estimates.
Brown & Brown (BRO) Q4 CY2025 Highlights:
- Revenue: $1.61 billion vs analyst estimates of $1.64 billion (36% year-on-year growth, 2.2% miss)
- Adjusted EPS: $0.93 vs analyst estimates of $0.90 (3.3% beat)
- Adjusted EBITDA: $529 million vs analyst estimates of $522.4 million (32.9% margin, 1.3% beat)
- Free Cash Flow Margin: 26.4%, down from 28.8% in the same quarter last year
- Market Capitalization: $27.03 billion
Company Overview
With roots dating back to 1939 and operations spanning 44 U.S. states and 14 countries, Brown & Brown (NYSE:BRO) is an insurance brokerage and risk management firm that markets and sells insurance products across property, casualty, and employee benefits sectors.
Brown & Brown operates through three main segments: Retail, Programs, and Wholesale Brokerage. The Retail segment serves commercial businesses, public entities, and individuals with a broad range of insurance solutions including property and casualty coverage, employee benefits, and personal insurance. The Programs segment functions as a managing general underwriter (MGU), developing specialized insurance programs for specific industries and professionals such as dentists, physicians, and real estate professionals. Meanwhile, the Wholesale Brokerage segment connects retail insurance agencies with excess and surplus commercial insurance products for hard-to-place risks.
Unlike traditional insurers, Brown & Brown primarily acts as an intermediary rather than assuming underwriting risk. The company earns revenue mainly through commissions paid by insurance carriers based on premiums, supplemented by profit-sharing contingent commissions tied to underwriting results and direct fees from customers for specific services. For example, a manufacturing company might engage Brown & Brown to assess its risk exposure, recommend appropriate coverage levels, and then broker policies with suitable carriers.
The company enhances its core brokerage services with risk management strategies, loss control analysis, and claims processing assistance. In limited cases, Brown & Brown participates in underwriting through captive insurance facilities, particularly for property insurance covering earthquake and wind-exposed properties. The company also operates Wright National Flood Insurance Company, which writes flood insurance policies backed by the Federal Emergency Management Agency (FEMA).
4. Insurance Brokers
The insurance brokerage industry, while influenced by insurance pricing cycles, benefits from durable secular tailwinds as rising risk complexity (climate, data privacy), regulatory scrutiny, and insurance pricing inflation. These increase demand for professional risk-management advice. Brokers operate models that rely on commissions and fees tied to premium volumes and growing contributions from recurring advisory, benefits, and compliance services. Scale is a key advantage, enabling better carrier access, stronger data and benchmarking, and efficient deployment of technology and compliance investments, which in turn supports ongoing industry consolidation. The headwinds are labor intensity and wage inflation for producers, regulatory complexity (this cuts both ways, as you can see), and execution risk when integrating new digital tools into legacy workflows.
Brown & Brown competes with other major insurance brokers including Marsh & McLennan Companies (NYSE:MMC), Aon plc (NYSE:AON), Arthur J. Gallagher & Co. (NYSE:AJG), and Willis Towers Watson (NASDAQ:WTW), as well as numerous regional and local insurance agencies.
5. Revenue Growth
A company’s long-term sales performance is one signal of its overall quality. Any business can experience short-term success, but top-performing ones enjoy sustained growth for years.
With $5.90 billion in revenue over the past 12 months, Brown & Brown is one of the larger companies in the business services industry and benefits from a well-known brand that influences purchasing decisions.
As you can see below, Brown & Brown’s 17.7% annualized revenue growth over the last five years was incredible. This is a great starting point for our analysis because it shows Brown & Brown’s demand was higher than many business services companies.
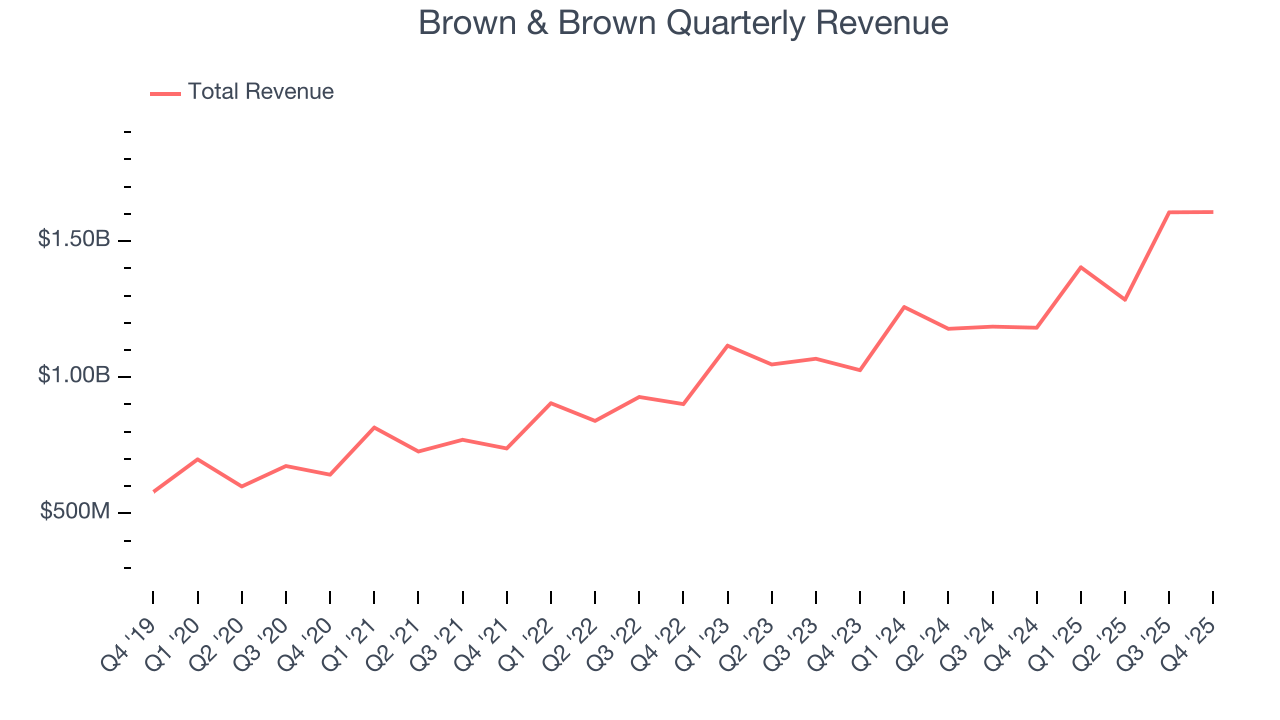
Long-term growth is the most important, but within business services, a half-decade historical view may miss new innovations or demand cycles. Brown & Brown’s annualized revenue growth of 17.7% over the last two years aligns with its five-year trend, suggesting its demand was predictably strong. 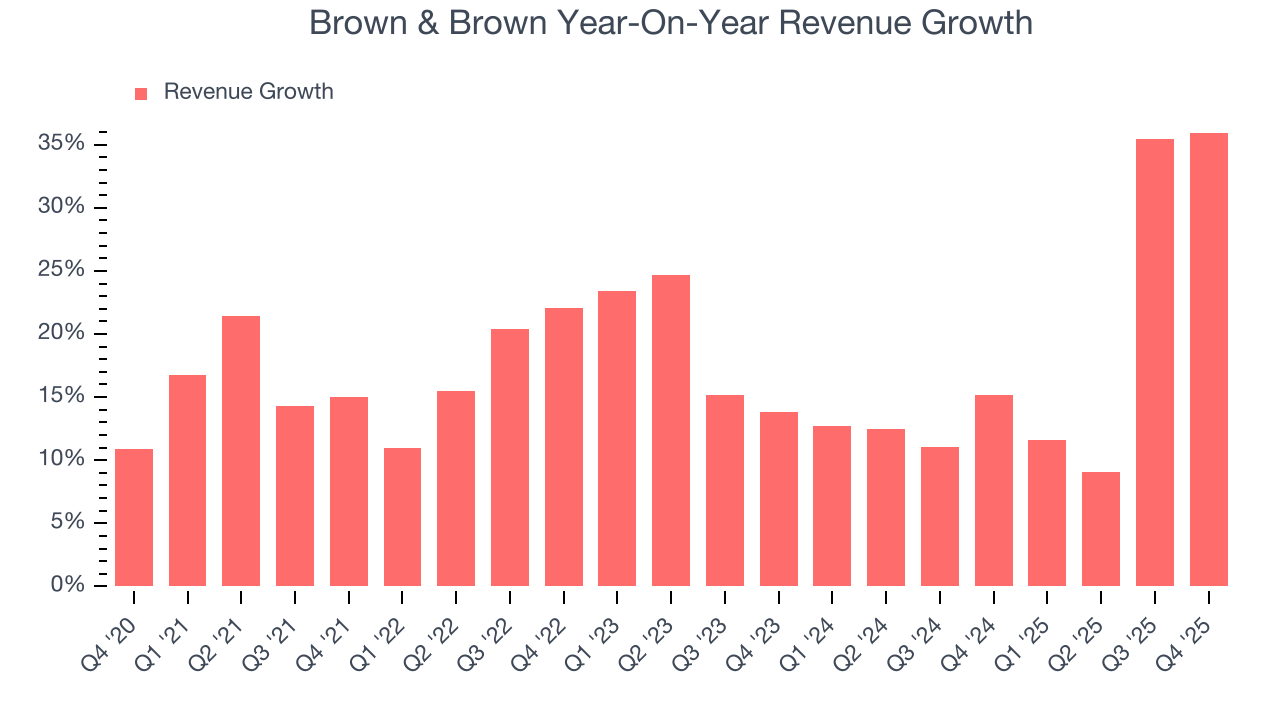
This quarter, Brown & Brown pulled off a wonderful 36% year-on-year revenue growth rate, but its $1.61 billion of revenue fell short of Wall Street’s rosy estimates.
Looking ahead, sell-side analysts expect revenue to grow 23.5% over the next 12 months, an improvement versus the last two years. This projection is eye-popping and suggests its newer products and services will catalyze better top-line performance.
6. Operating Margin
Operating margin is one of the best measures of profitability because it tells us how much money a company takes home after subtracting all core expenses, like marketing and R&D.
Brown & Brown has been a well-oiled machine over the last five years. It demonstrated elite profitability for a business services business, boasting an average operating margin of 25.7%.
Analyzing the trend in its profitability, Brown & Brown’s operating margin decreased by 2.5 percentage points over the last five years. This raises questions about the company’s expense base because its revenue growth should have given it leverage on its fixed costs, resulting in better economies of scale and profitability.
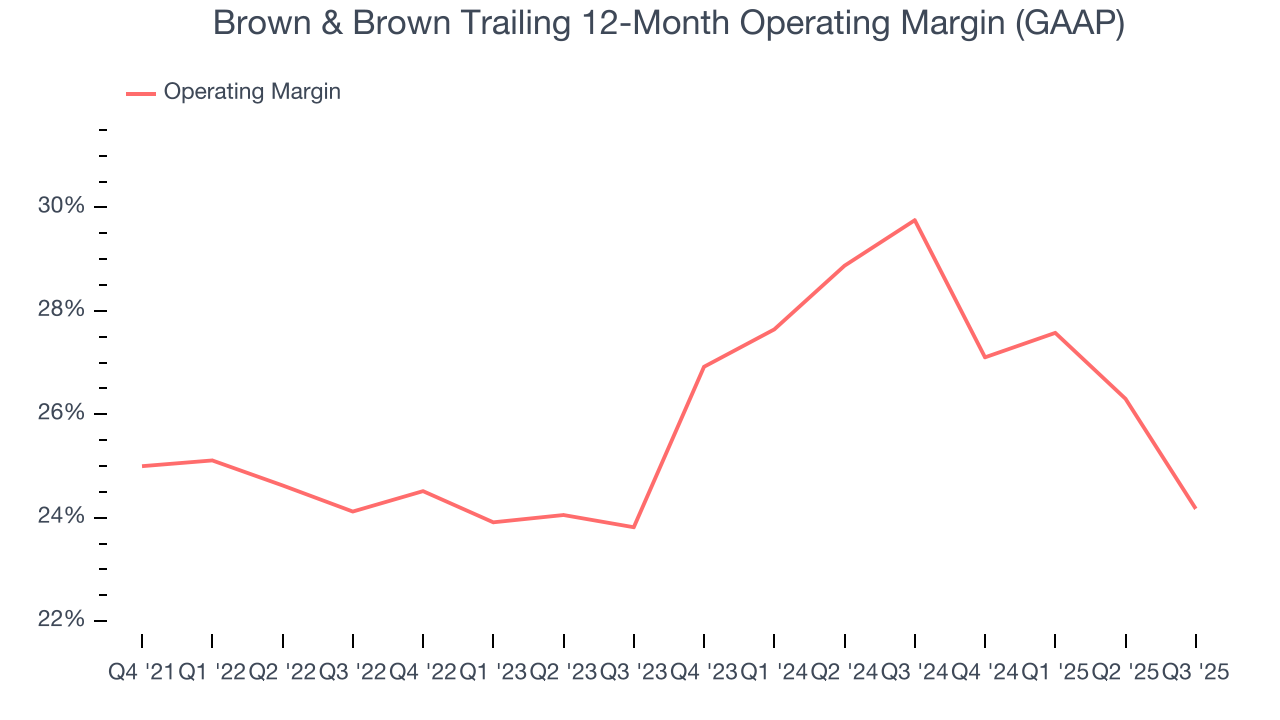
in line with the same quarter last year. This indicates the company’s overall cost structure has been relatively stable.
7. Earnings Per Share
Revenue trends explain a company’s historical growth, but the long-term change in earnings per share (EPS) points to the profitability of that growth – for example, a company could inflate its sales through excessive spending on advertising and promotions.
Brown & Brown’s EPS grew at an astounding 20.5% compounded annual growth rate over the last five years, higher than its 17.7% annualized revenue growth. However, we take this with a grain of salt because its operating margin didn’t improve and it didn’t repurchase its shares, meaning the delta came from reduced interest expenses or taxes.
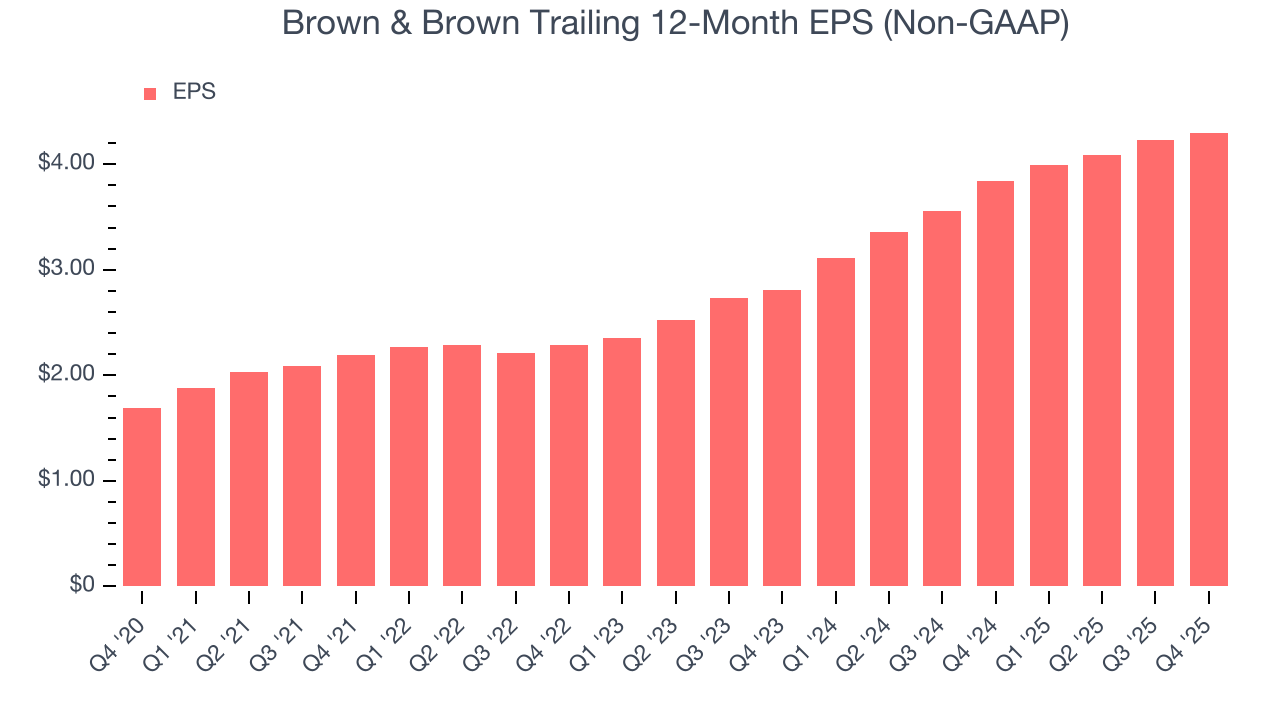
Like with revenue, we analyze EPS over a shorter period to see if we are missing a change in the business.
For Brown & Brown, its two-year annual EPS growth of 23.7% was higher than its five-year trend. We love it when earnings growth accelerates, especially when it accelerates off an already high base.
In Q4, Brown & Brown reported adjusted EPS of $0.93, up from $0.86 in the same quarter last year. This print beat analysts’ estimates by 3.3%. Over the next 12 months, Wall Street expects Brown & Brown’s full-year EPS of $4.30 to grow 7.3%.
8. Cash Is King
Free cash flow isn't a prominently featured metric in company financials and earnings releases, but we think it's telling because it accounts for all operating and capital expenses, making it tough to manipulate. Cash is king.
Brown & Brown has shown terrific cash profitability, enabling it to reinvest, return capital to investors, and stay ahead of the competition while maintaining an ample cushion. The company’s free cash flow margin was among the best in the business services sector, averaging 23.8% over the last five years.
Taking a step back, we can see that Brown & Brown’s margin dropped by 5.8 percentage points during that time. If its declines continue, it could signal increasing investment needs and capital intensity.
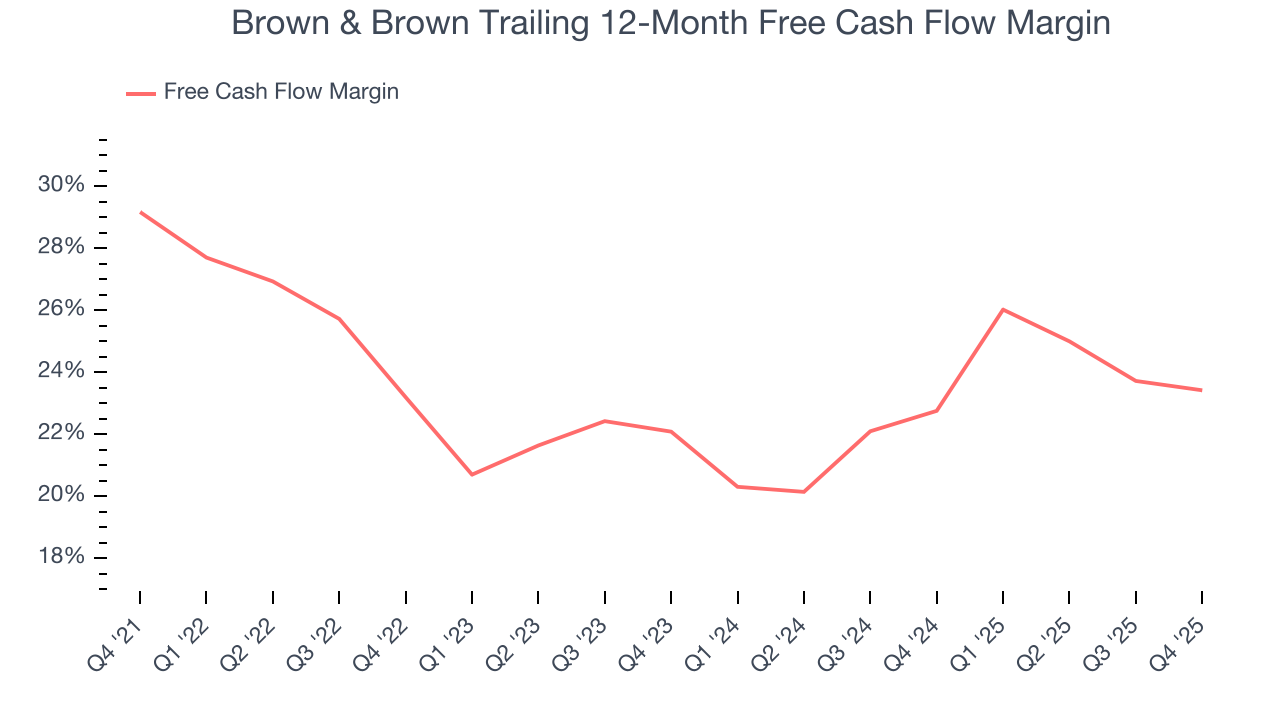
Brown & Brown’s free cash flow clocked in at $424 million in Q4, equivalent to a 26.4% margin. The company’s cash profitability regressed as it was 2.5 percentage points lower than in the same quarter last year, but it’s still above its five-year average. We wouldn’t put too much weight on this quarter’s decline because investment needs can be seasonal, causing short-term swings. Long-term trends trump temporary fluctuations.
9. Return on Invested Capital (ROIC)
EPS and free cash flow tell us whether a company was profitable while growing its revenue. But was it capital-efficient? Enter ROIC, a metric showing how much operating profit a company generates relative to the money it has raised (debt and equity).
Brown & Brown’s five-year average ROIC was 13%, higher than most business services businesses. This illustrates its management team’s ability to invest in profitable growth opportunities and generate value for shareholders.
We like to invest in businesses with high returns, but the trend in a company’s ROIC is what often surprises the market and moves the stock price. Fortunately, Brown & Brown’s ROIC averaged 1.8 percentage point increases over the last few years. This is a great sign when paired with its already strong returns. It could suggest its competitive advantage or profitable growth opportunities are expanding.
10. Balance Sheet Assessment
Brown & Brown reported $1.08 billion of cash and $7.86 billion of debt on its balance sheet in the most recent quarter. As investors in high-quality companies, we primarily focus on two things: 1) that a company’s debt level isn’t too high and 2) that its interest payments are not excessively burdening the business.
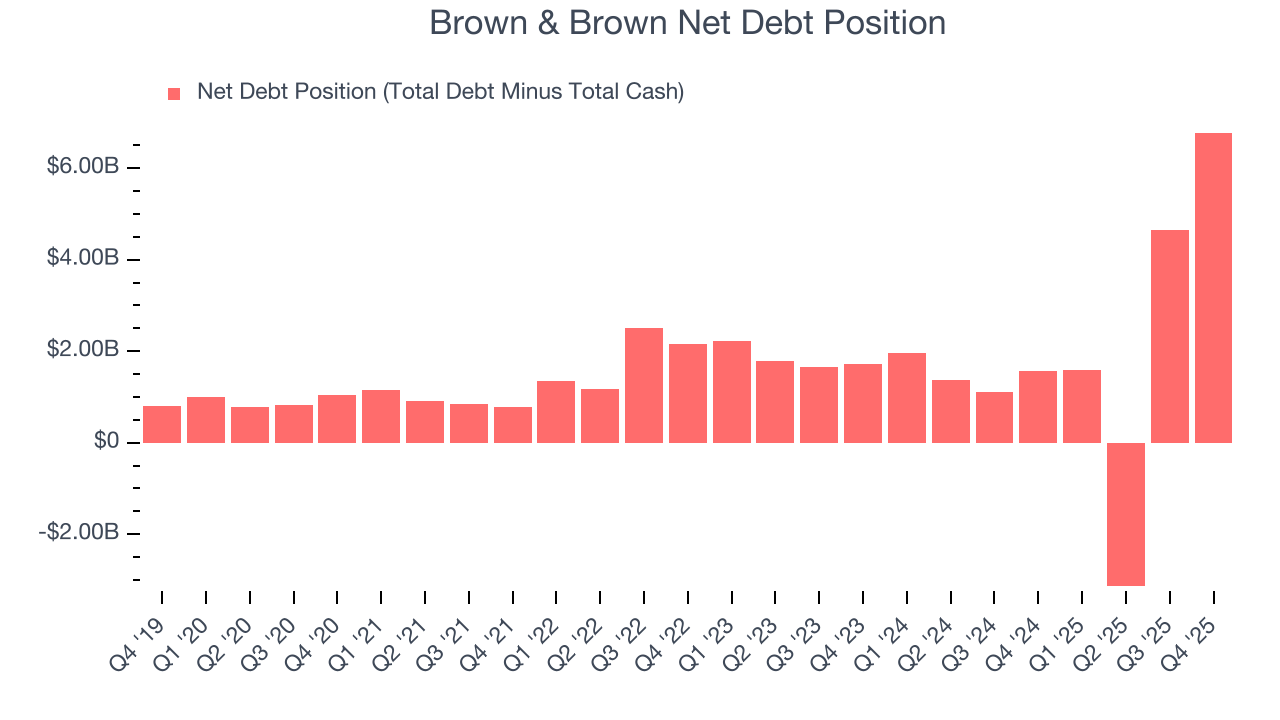
With $2.01 billion of EBITDA over the last 12 months, we view Brown & Brown’s 3.4× net-debt-to-EBITDA ratio as safe. We also see its $15 million of annual interest expenses as appropriate. The company’s profits give it plenty of breathing room, allowing it to continue investing in growth initiatives.
11. Key Takeaways from Brown & Brown’s Q4 Results
It was good to see Brown & Brown beat analysts’ EPS expectations this quarter. On the other hand, its revenue missed. Overall, this quarter could have been better. The stock traded down 3.6% to $77.26 immediately following the results.
12. Is Now The Time To Buy Brown & Brown?
Updated: February 11, 2026 at 11:43 PM EST
The latest quarterly earnings matters, sure, but we actually think longer-term fundamentals and valuation matter more. Investors should consider all these pieces before deciding whether or not to invest in Brown & Brown.
There are multiple reasons why we think Brown & Brown is an amazing business. For starters, its revenue growth was exceptional over the last five years and is expected to accelerate over the next 12 months. And while its cash profitability fell over the last five years, its powerful free cash flow generation enables it to stay ahead of the competition through consistent reinvestment of profits. On top of that, Brown & Brown’s impressive operating margins show it has a highly efficient business model.
Brown & Brown’s P/E ratio based on the next 12 months is 14.9x. Looking across the spectrum of business services companies today, Brown & Brown’s fundamentals shine bright. We like the stock at this price.
Wall Street analysts have a consensus one-year price target of $84.36 on the company (compared to the current share price of $67.81), implying they see 24.4% upside in buying Brown & Brown in the short term.