Citigroup (C)
We’re wary of Citigroup. Its sales have underperformed and its low returns on capital show it has few growth opportunities.― StockStory Analyst Team
1. News


2. Summary
Why We Think Citigroup Will Underperform
With operations in nearly 160 countries and a history dating back to 1812, Citigroup (NYSE:C) is a global financial services company that provides banking, investment, wealth management, and payment solutions to consumers, corporations, and governments.
- Annual sales growth of 2.4% over the last five years lagged behind its banking peers as its large revenue base made it difficult to generate incremental demand
- Large revenue base makes it harder to expand quickly, and its annual net interest income growth of 6% over the last five years was below our standards for the banking sector
- A positive is that its annual tangible book value per share growth of 5.7% over the last five years was above the sector average and underscores its products and services quality


Citigroup doesn’t fulfill our quality requirements. There are better opportunities in the market.
Why There Are Better Opportunities Than Citigroup


Citigroup is trading at $106.97 per share, or 0.9x forward P/B. This multiple is lower than most banking companies, but for good reason.
Cheap stocks can look like a great deal at first glance, but they can be value traps. They often have less earnings power, meaning there is more reliance on a re-rating to generate good returns - an unlikely scenario for low-quality companies.
3. Citigroup (C) Research Report: Q4 CY2025 Update
Global financial services giant Citigroup (NYSE:C) fell short of the markets revenue expectations in Q4 CY2025 as sales only rose 2% year on year to $19.87 billion. Its non-GAAP profit of $1.24 per share was 23.4% below analysts’ consensus estimates.
Citigroup (C) Q4 CY2025 Highlights:
- Revenue: $19.87 billion vs analyst estimates of $20.46 billion (2% year-on-year growth, 2.9% miss)
- Efficiency Ratio: 69.6% vs analyst estimates of 68.1% (154.4 basis point miss)
- Adjusted EPS: $1.24 vs analyst expectations of $1.62 (23.4% miss)
- Tangible Book Value per Share: $97.06 vs analyst estimates of $96.80 (8.6% year-on-year growth, in line)
- Market Capitalization: $208.1 billion
Company Overview
With operations in nearly 160 countries and a history dating back to 1812, Citigroup (NYSE:C) is a global financial services company that provides banking, investment, wealth management, and payment solutions to consumers, corporations, and governments.
Citigroup's business is organized into five key segments that serve different client needs. The Services segment offers treasury, trade, and securities solutions to help multinational corporations and institutions manage cash flow and facilitate cross-border transactions. Markets provides sales and trading services across asset classes like equities, foreign exchange, and commodities, acting as a market maker by holding inventory to meet client demand.
The Banking segment supports corporate clients with capital-raising through investment banking services and provides commercial banking services. U.S. Personal Banking serves retail customers and small businesses through branded credit cards (including co-branded cards with partners like Costco and American Airlines), retail services for store cards, and traditional banking services concentrated in six major U.S. metropolitan areas.
For affluent and high-net-worth individuals, the Wealth segment delivers specialized banking, lending, investment, and trust services. This includes the Private Bank for ultra-high-net-worth clients, Wealth at Work for professional industries like law firms and consulting groups, and Citigold for affluent clients seeking premium financial relationships.
A corporate client might use Citigroup's treasury services to manage international cash flows, its investment banking team to raise capital through a bond issuance, and its foreign exchange trading desk to hedge currency risks—all through a single financial relationship. The company generates revenue through interest on loans, fees for financial services, and trading activities, with its global footprint allowing it to serve clients across developed and emerging markets.
4. Diversified Banks
At their core, diversified banks take in deposits and engage in various forms of lending, which means revenue is generated through interest rate spreads (difference between loan and deposit rates) and fees. Other revenue comes from adjacent services such as wealth management, card and account fees, and products such as annuities. These institutions benefit from rising interest rates that improve NIMs (net interest margins), digital transformation reducing operational costs, and expanding wealth management services as populations age. However, they face headwinds including fintech competition disrupting traditional models (how disruptive is crypto?), stringent regulatory requirements increasing compliance costs, and cybersecurity threats requiring substantial technology investments. Economic downturns also pose risks through potential loan defaults and compressed margins during accommodative monetary policy periods.
Citigroup competes with other global financial institutions including JPMorgan Chase (NYSE:JPM), Bank of America (NYSE:BAC), Wells Fargo (NYSE:WFC), and Goldman Sachs (NYSE:GS) in the U.S., as well as international banks like HSBC (NYSE:HSBC) and Deutsche Bank (NYSE:DB).
5. Sales Growth
From lending activities to service fees, most banks build their revenue model around two income sources. Interest rate spreads between loans and deposits create the first stream, with the second coming from charges on everything from basic bank accounts to complex investment banking transactions. Unfortunately, Citigroup’s 2.4% annualized revenue growth over the last five years was sluggish. This was below our standards and is a poor baseline for our analysis.
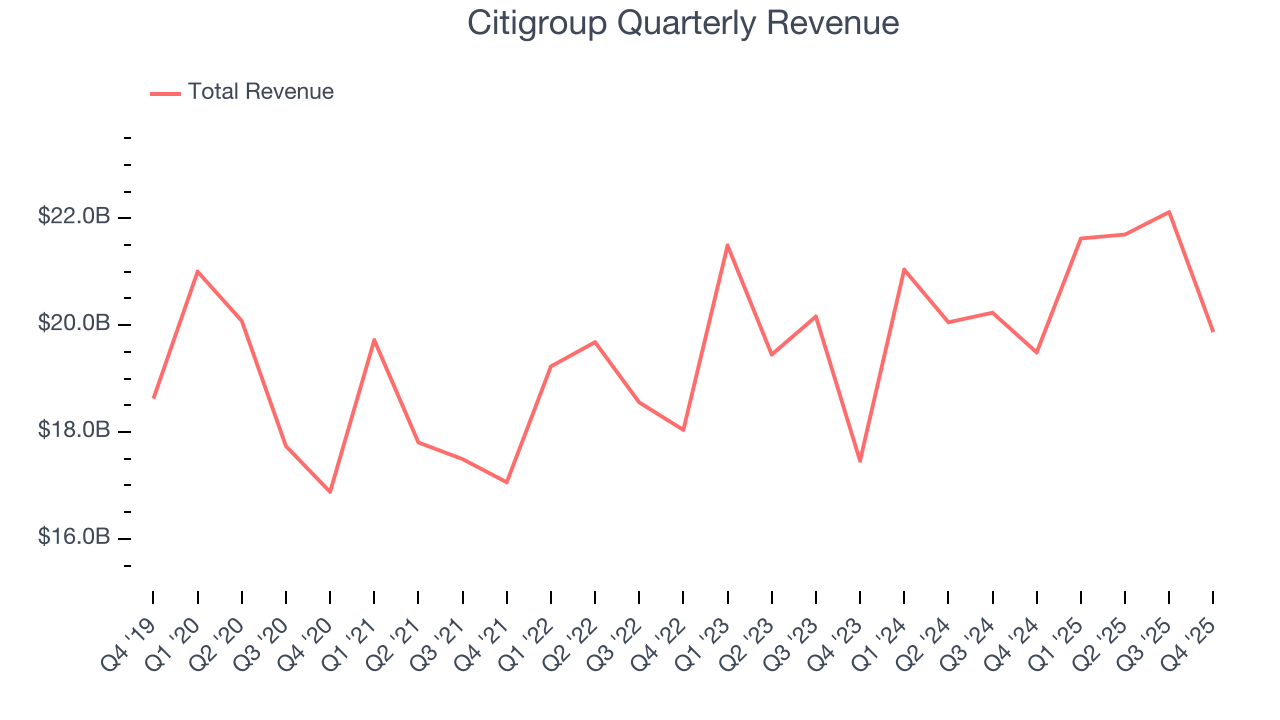
We at StockStory place the most emphasis on long-term growth, but within financials, a half-decade historical view may miss recent interest rate changes, market returns, and industry trends. Citigroup’s annualized revenue growth of 4.2% over the last two years is above its five-year trend, but we were still disappointed by the results. 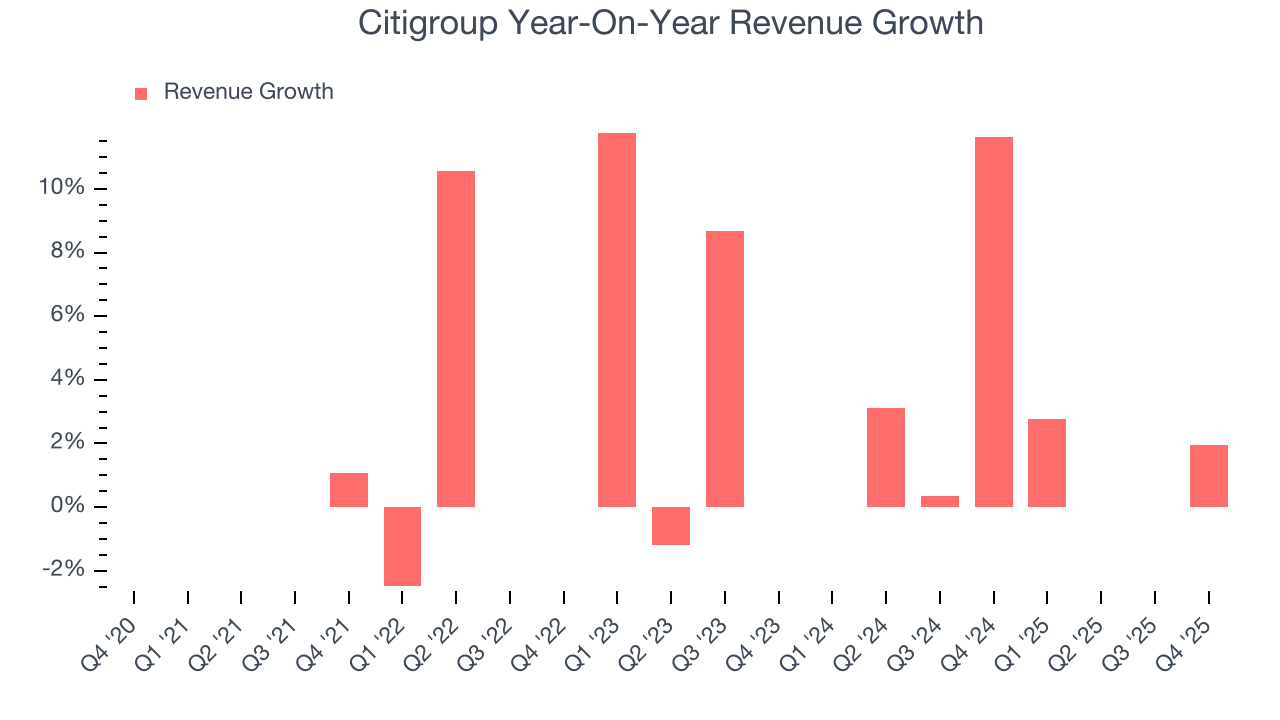 Note: Quarters not shown were determined to be outliers, impacted by outsized investment gains/losses that are not indicative of the recurring fundamentals of the business.
This quarter, Citigroup’s revenue grew by 2% year on year to $19.87 billion, falling short of Wall Street’s estimates.
Net interest income made up 64.9% of the company’s total revenue during the last five years, meaning lending operations are Citigroup’s largest source of revenue.
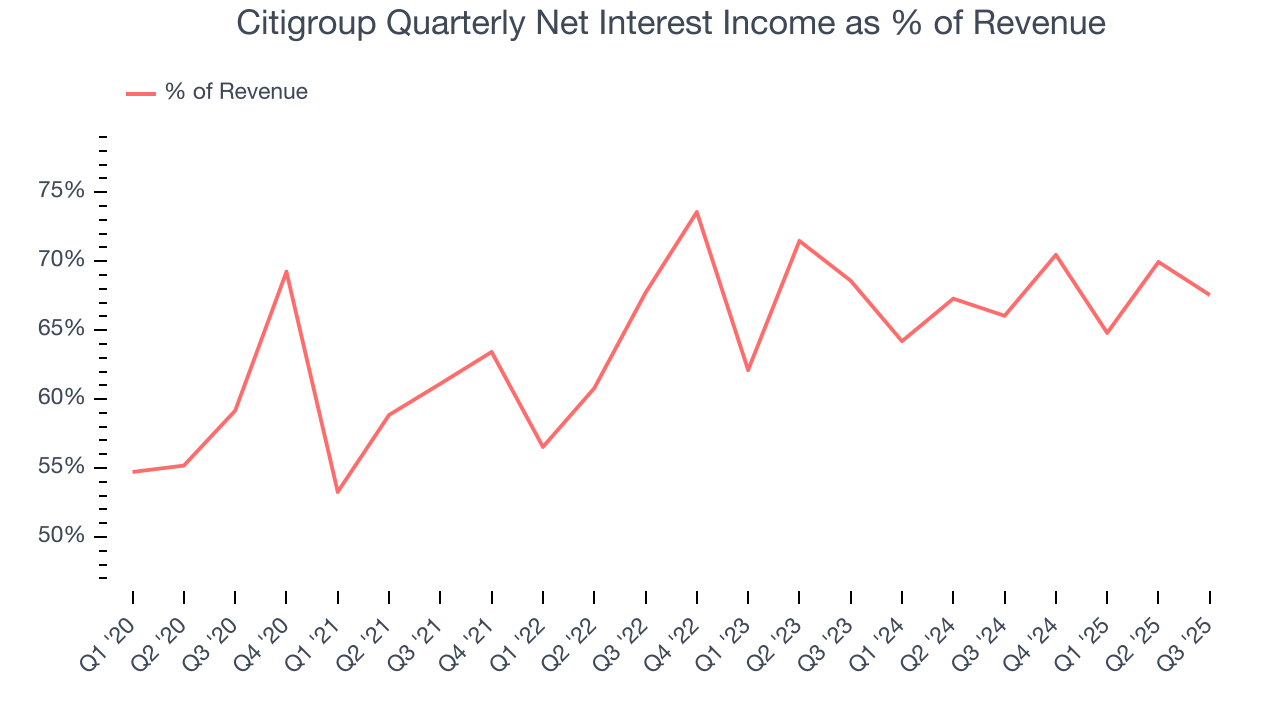
Our experience and research show the market cares primarily about a bank’s net interest income growth as non-interest income is considered a lower-quality and non-recurring revenue source.
6. Earnings Per Share
Revenue trends explain a company’s historical growth, but the long-term change in earnings per share (EPS) points to the profitability of that growth – for example, a company could inflate its sales through excessive spending on advertising and promotions.
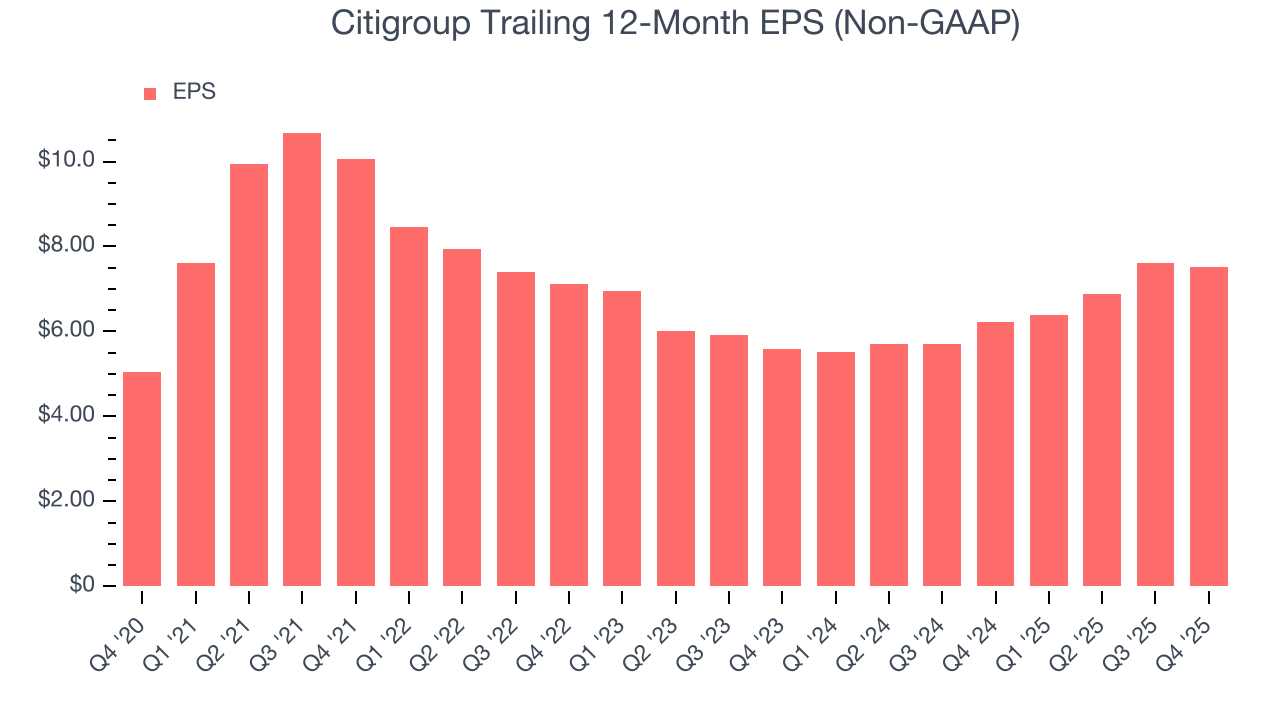
Citigroup’s EPS grew at an unimpressive 8.3% compounded annual growth rate over the last five years. This performance was better than its flat revenue, but we take it with a grain of salt because its efficiency ratio didn’t improve and it didn’t repurchase its shares, meaning the delta came from factors we consider non-core or less sustainable over the long term.
Like with revenue, we analyze EPS over a shorter period to see if we are missing a change in the business.
For Citigroup, its two-year annual EPS growth of 15.9% was higher than its five-year trend. This acceleration made it one of the faster-growing banking companies in recent history.
In Q4, Citigroup reported adjusted EPS of $1.24, down from $1.35 in the same quarter last year. This print missed analysts’ estimates. Over the next 12 months, Wall Street expects Citigroup’s full-year EPS of $7.51 to grow 35.9%.
7. Tangible Book Value Per Share (TBVPS)
Banks profit by intermediating between depositors and borrowers, making them fundamentally balance sheet-driven enterprises. Market participants emphasize balance sheet quality and sustained book value growth when evaluating these institutions.
When analyzing banks, tangible book value per share (TBVPS) takes precedence over many other metrics. This measure isolates genuine per-share value by removing intangible assets of debatable liquidation worth. Traditional metrics like EPS are helpful but face distortion from M&A activity and loan loss accounting rules.
Citigroup’s TBVPS grew at a decent 5.7% annual clip over the last five years. The last two years show a similar trajectory as TBVPS grew by 6.1% annually from $86.19 to $97.06 per share.
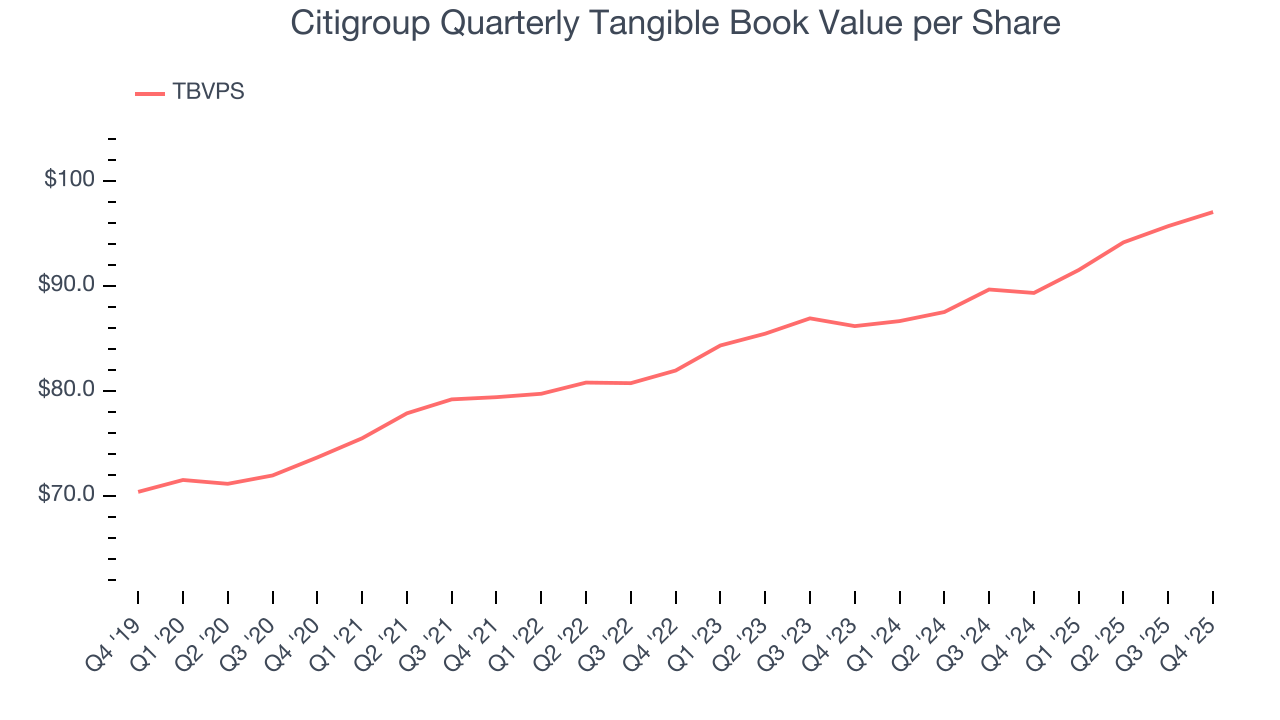
Over the next 12 months, Consensus estimates call for Citigroup’s TBVPS to grow by 9% to $105.80, paltry growth rate.
8. Balance Sheet Assessment
Leverage is core to a financial firm’s business model (loans funded by deposits). To ensure economic stability and avoid a repeat of the 2008 GFC, regulators require certain levels of capital and liquidity, focusing on the Tier 1 capital ratio.
Tier 1 capital is the highest-quality capital that a firm holds, consisting primarily of common stock and retained earnings, but also physical gold. It serves as the primary cushion against losses and is the first line of defense in times of financial distress.
This capital is divided by risk-weighted assets to derive the Tier 1 capital ratio. Risk-weighted means that cash and US treasury securities are assigned little risk while unsecured consumer loans and equity investments get much higher risk weights, for example.
New regulation after the 2008 financial crisis requires that all firms must maintain a Tier 1 capital ratio greater than 4.5%. On top of this, there are additional buffers based on scale, risk profile, and other regulatory classifications, so that at the end of the day, firms generally must maintain a 7-10% ratio at minimum.
Over the last two years, Citigroup has averaged a Tier 1 capital ratio of 12.1%, which is considered safe and well capitalized in the event that macro or market conditions suddenly deteriorate.
9. Return on Equity
Return on equity, or ROE, quantifies bank profitability relative to shareholder equity - an essential capital source for these institutions. Over extended periods, superior ROE performance drives faster shareholder wealth compounding through reinvestment, share repurchases, and dividend growth.
Over the last five years, Citigroup has averaged an ROE of 7.7%, uninspiring for a company operating in a sector where the average shakes out around 7.5%.
10. Key Takeaways from Citigroup’s Q4 Results
We struggled to find many positives in these results. Its revenue missed and its EPS fell short of Wall Street’s estimates. Overall, this was a weaker quarter. The stock traded down 4.1% to $111.47 immediately after reporting.
11. Is Now The Time To Buy Citigroup?
Updated: March 29, 2026 at 12:58 AM EDT
Before deciding whether to buy Citigroup or pass, we urge investors to consider business quality, valuation, and the latest quarterly results.
Citigroup isn’t a terrible business, but it doesn’t pass our bar. First off, its revenue growth was weak over the last five years. While its projected EPS for the next year implies the company’s fundamentals will improve, the downside is its net interest income growth was weak over the last five years. On top of that, its estimated sales for the next 12 months are weak.
Citigroup’s P/B ratio based on the next 12 months is 0.9x. This valuation is reasonable, but the company’s shakier fundamentals present too much downside risk. We're fairly confident there are better investments elsewhere.
Wall Street analysts have a consensus one-year price target of $133.52 on the company (compared to the current share price of $106.97).
Although the price target is bullish, readers should exercise caution because analysts tend to be overly optimistic. The firms they work for, often big banks, have relationships with companies that extend into fundraising, M&A advisory, and other rewarding business lines. As a result, they typically hesitate to say bad things for fear they will lose out. We at StockStory do not suffer from such conflicts of interest, so we’ll always tell it like it is.