
CNO Financial Group (CNO)
We’re wary of CNO Financial Group. Its sluggish sales growth shows demand is soft, a worrisome sign for investors in high-quality stocks.― StockStory Analyst Team
1. News


2. Summary
Why We Think CNO Financial Group Will Underperform
Rebranded from Conseco in 2010 to signal a fresh start after navigating financial challenges, CNO Financial Group (NYSE:CNO) develops and markets health insurance, annuities, and life insurance products primarily targeting middle-income pre-retirees and retirees.
- Policy losses and capital returns have eroded its book value per share this cycle as its book value per share declined by 5.7% annually over the last five years
- Stagnant net premiums earned over the last five years suggest the firm needs alternative growth strategies
- The good news is that its capital strength is on track to rise over the next 12 months as its 54.7% projected book value per share growth implies profitability will accelerate from its two-year trend


CNO Financial Group’s quality is not up to our standards. We see more lucrative opportunities elsewhere.
Why There Are Better Opportunities Than CNO Financial Group


At $40.65 per share, CNO Financial Group trades at 1.5x forward P/B. Yes, this valuation multiple is lower than that of other insurance peers, but we’ll remind you that you often get what you pay for.
Our advice is to pay up for elite businesses whose advantages are tailwinds to earnings growth. Don’t get sucked into lower-quality businesses just because they seem like bargains. These mediocre businesses often never achieve a higher multiple as hoped, a phenomenon known as a “value trap”.
3. CNO Financial Group (CNO) Research Report: Q3 CY2025 Update
Insurance services company CNO Financial Group (NYSE:CNO) reported Q3 CY2025 results topping the market’s revenue expectations, with sales up 26.2% year on year to $1.19 billion. Its non-GAAP profit of $1.29 per share was 40.2% above analysts’ consensus estimates.
CNO Financial Group (CNO) Q3 CY2025 Highlights:
Company Overview
Rebranded from Conseco in 2010 to signal a fresh start after navigating financial challenges, CNO Financial Group (NYSE:CNO) develops and markets health insurance, annuities, and life insurance products primarily targeting middle-income pre-retirees and retirees.
CNO operates through two main divisions: Consumer and Worksite. The Consumer Division engages directly with individual customers through various channels including face-to-face meetings with exclusive agents, phone calls, and online interactions. The Worksite Division focuses on selling voluntary benefits in workplace settings, offering employers and their employees benefits administration and advocacy services.
The company's product portfolio spans three main categories. Its annuity products include fixed indexed annuities that combine guaranteed minimum returns with potential market-linked gains, traditional fixed rate annuities, and immediate annuities that provide regular income payments. Health insurance offerings feature Medicare supplement policies that cover gaps in federal Medicare coverage, supplemental health products for specific conditions like cancer or heart disease, and long-term care insurance for nursing home or home healthcare needs. Life insurance products round out the lineup with both interest-sensitive options like universal life and traditional policies including whole life and term coverage.
CNO markets its products primarily under three brands: Bankers Life, Washington National, and Colonial Penn. Its distribution network includes approximately 4,200 exclusive agents operating from over 230 branch offices, independent producers, and direct marketing channels. The company maintains a strategic focus on the middle-income market segment, which it views as underserved by larger insurers.
Revenue generation comes primarily from premium payments and the investment spread—the difference between what CNO earns on its investment portfolio and what it pays out to policyholders in benefits and credited interest.
4. Life Insurance
Life insurance companies collect premiums from policyholders in exchange for providing a future death benefit or retirement income stream. Interest rates matter for the sector (and make it cyclical), with higher rates allowing insurers to reinvest their fixed-income portfolios at more attractive yields and vice versa. Additionally, favorable demographic shifts, such as an aging population, are driving strong demand for retirement products while AI and data analytics offer significant opportunities to improve underwriting accuracy and operational efficiency. Conversely, the industry faces headwinds from persistent competition from agile insurtechs that threaten traditional distribution models.
CNO Financial Group's competitors in the insurance market include Northwestern Mutual, Mutual of Omaha, and New York Life in the long-term care and life insurance segments. For Medicare supplement products, the company competes with Blue Cross and Blue Shield Plans, UnitedHealthcare, and Mutual of Omaha. In the worksite benefits space, its main rivals include AFLAC, Unum, MetLife, and Globe Life.
5. Revenue Growth
In general, insurance companies earn revenue from three primary sources. The first is the core insurance business itself, often called underwriting and represented in the income statement as premiums earned. The second source is investment income from investing the “float” (premiums collected upfront not yet paid out as claims) in assets such as fixed-income assets and equities. The third is fees from various sources such as policy administration, annuities, or other value-added services. Regrettably, CNO Financial Group’s revenue grew at a sluggish 2.8% compounded annual growth rate over the last five years. This was below our standards and is a rough starting point for our analysis.
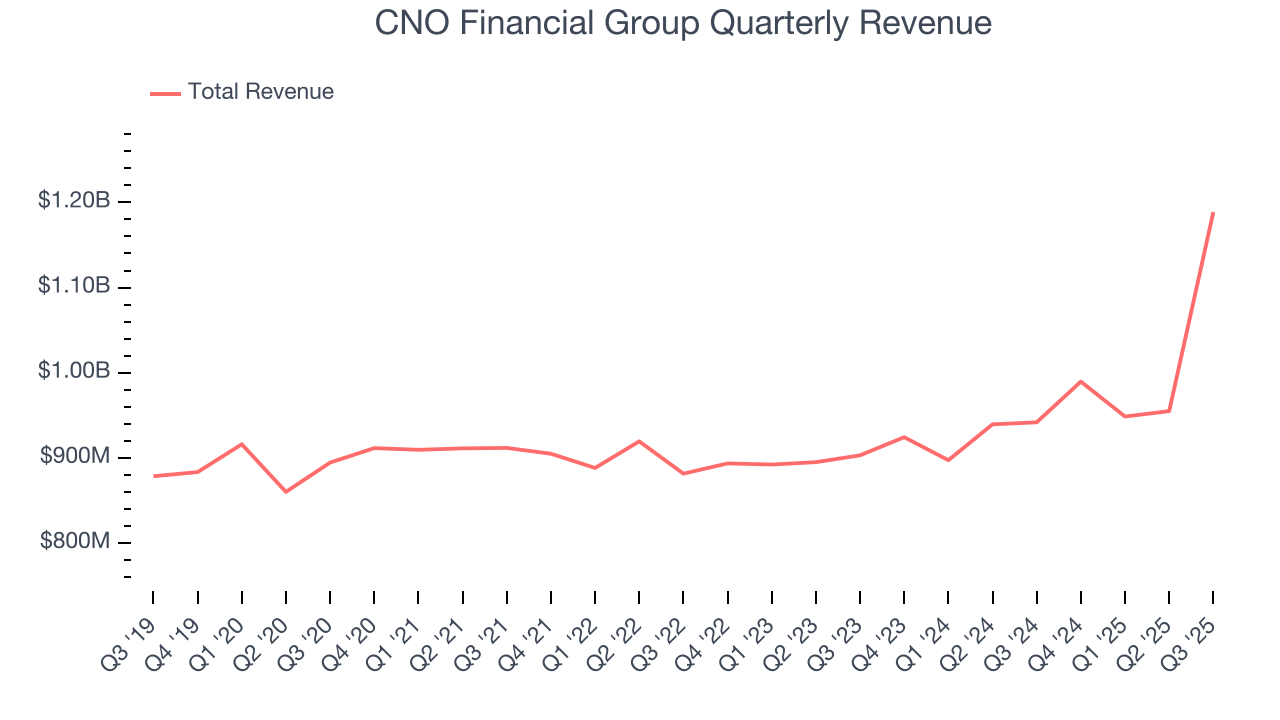
Long-term growth is the most important, but within financials, a half-decade historical view may miss recent interest rate changes and market returns. CNO Financial Group’s annualized revenue growth of 6.7% over the last two years is above its five-year trend, but we were still disappointed by the results. 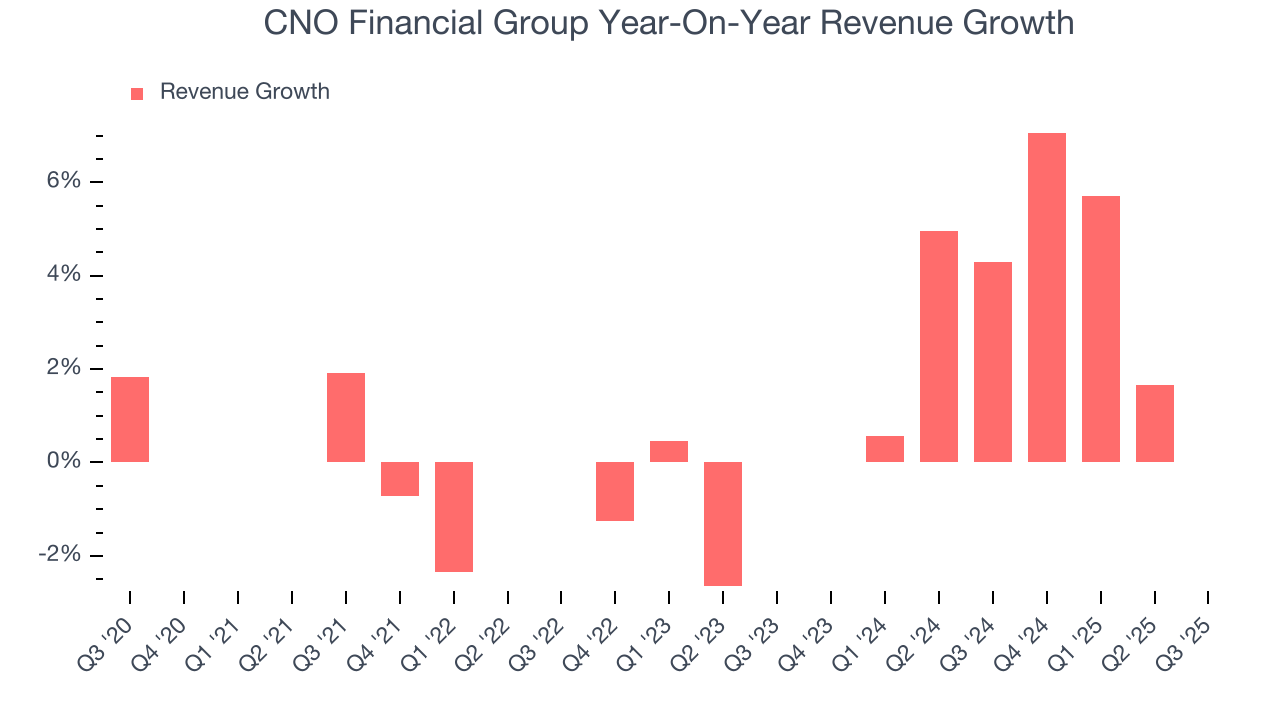 Note: Quarters not shown were determined to be outliers, impacted by outsized investment gains/losses that are not indicative of the recurring fundamentals of the business.
This quarter, CNO Financial Group reported robust year-on-year revenue growth of 26.2%, and its $1.19 billion of revenue topped Wall Street estimates by 22.7%.
Net premiums earned made up 68.1% of the company’s total revenue during the last five years, meaning insurance operations are CNO Financial Group’s largest source of revenue.
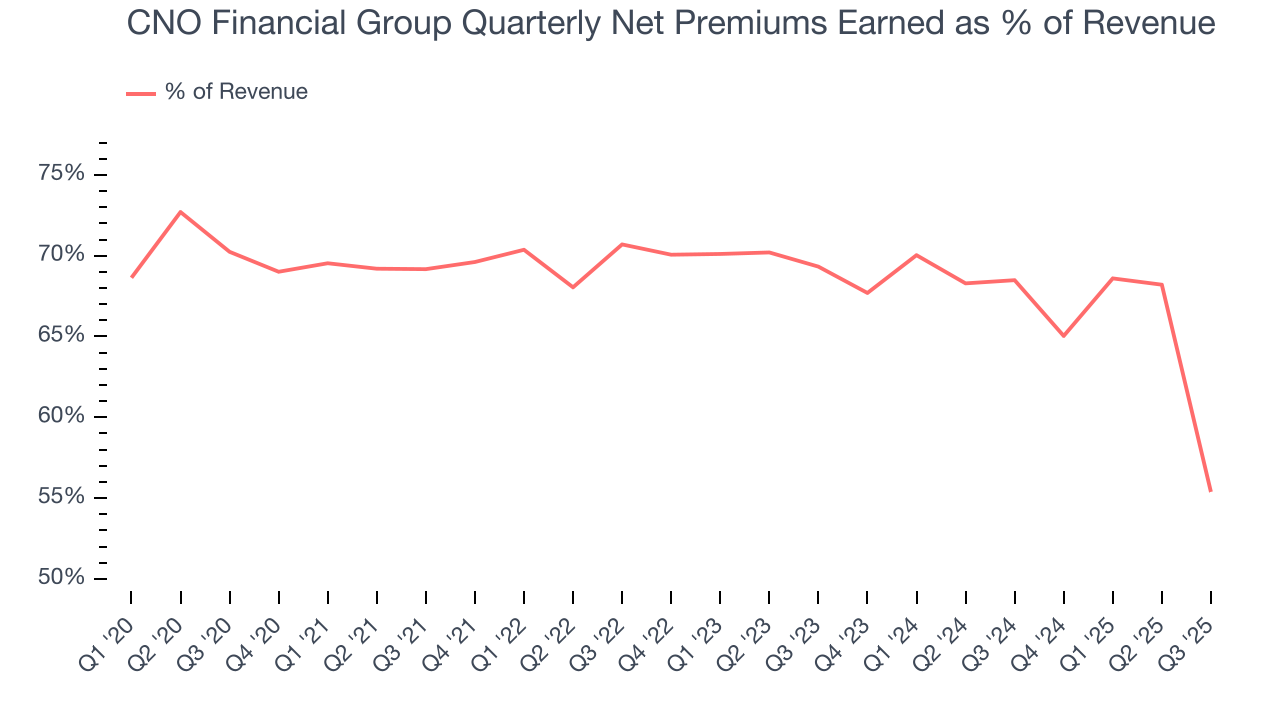
Our experience and research show the market cares primarily about an insurer’s net premiums earned growth as investment and fee income are considered more susceptible to market volatility and economic cycles.
6. Net Premiums Earned
Net premiums earned are net of what’s paid to reinsurers (insurance for insurance companies), which are used by insurers to protect themselves from large losses.
CNO Financial Group’s net premiums earned was flat over the last five years, much worse than the broader insurance industry. This shows that policy underwriting underperformed its other business lines.
When analyzing CNO Financial Group’s net premiums earned over the last two years, we can see that growth accelerated to 1.9% annually. Since two-year net premiums earned grew slower than total revenue over this period, it’s implied that other line items such as investment income grew at a faster rate. These additional streams do play a key role in the bottom line, but their impact can vary. While some firms have excelled in consistently investing their float, sudden shifts in the fixed income and equity markets can heavily sway short-term performance.
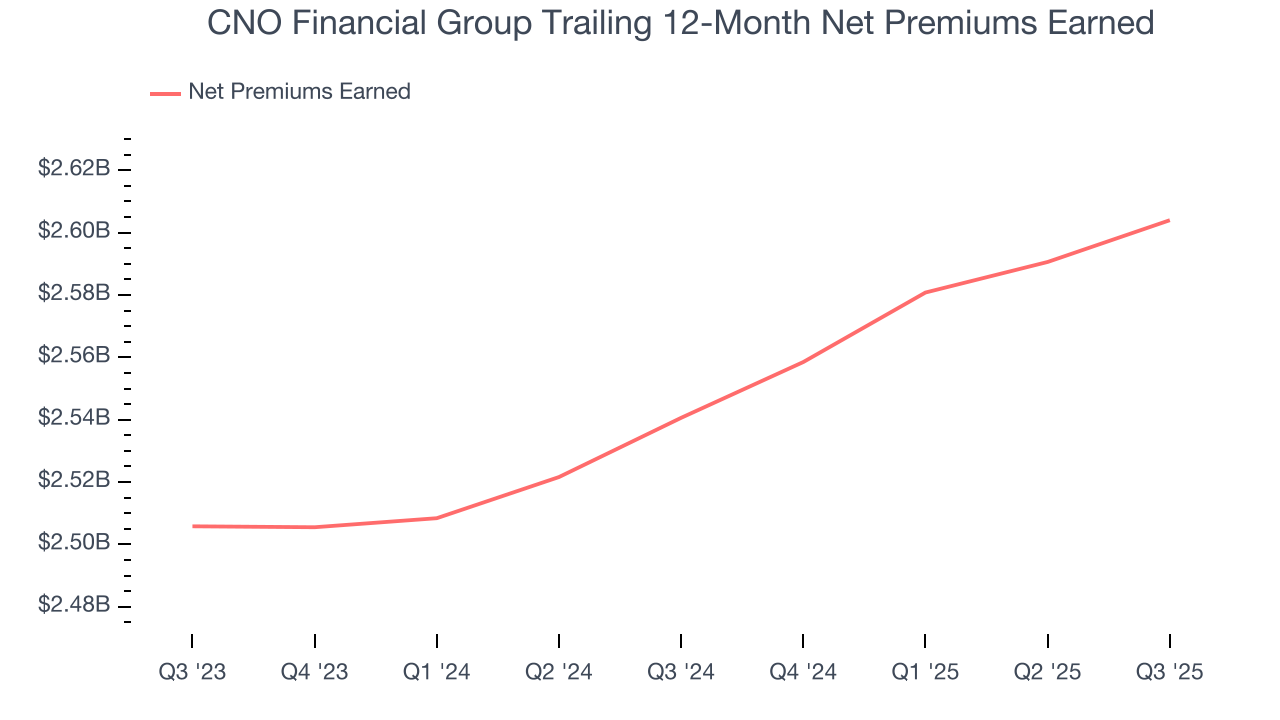
In Q3, CNO Financial Group produced $658.4 million of net premiums earned, up 2.1% year on year.
7. Pre-Tax Profit Margin
Revenue growth is one major determinant of business quality, and the efficiency of operations is another. For insurance companies, we look at pre-tax profit rather than the operating margin that defines sectors such as consumer, tech, and industrials.
The economics of insurers are driven by their balance sheets, where assets (investing the float + premiums receivable) and liabilities (claims to pay) define the fundamentals. Interest income and expense should therefore be factored into the definition of profit but taxes - which are largely out of a company’s control - should not.
Over the last four years, CNO Financial Group’s pre-tax profit margin has risen by 5.8 percentage points, going from 15.5% to 9.6%. Expenses have stabilized more recently as the company’s pre-tax profit margin was flat on a two-year basis.
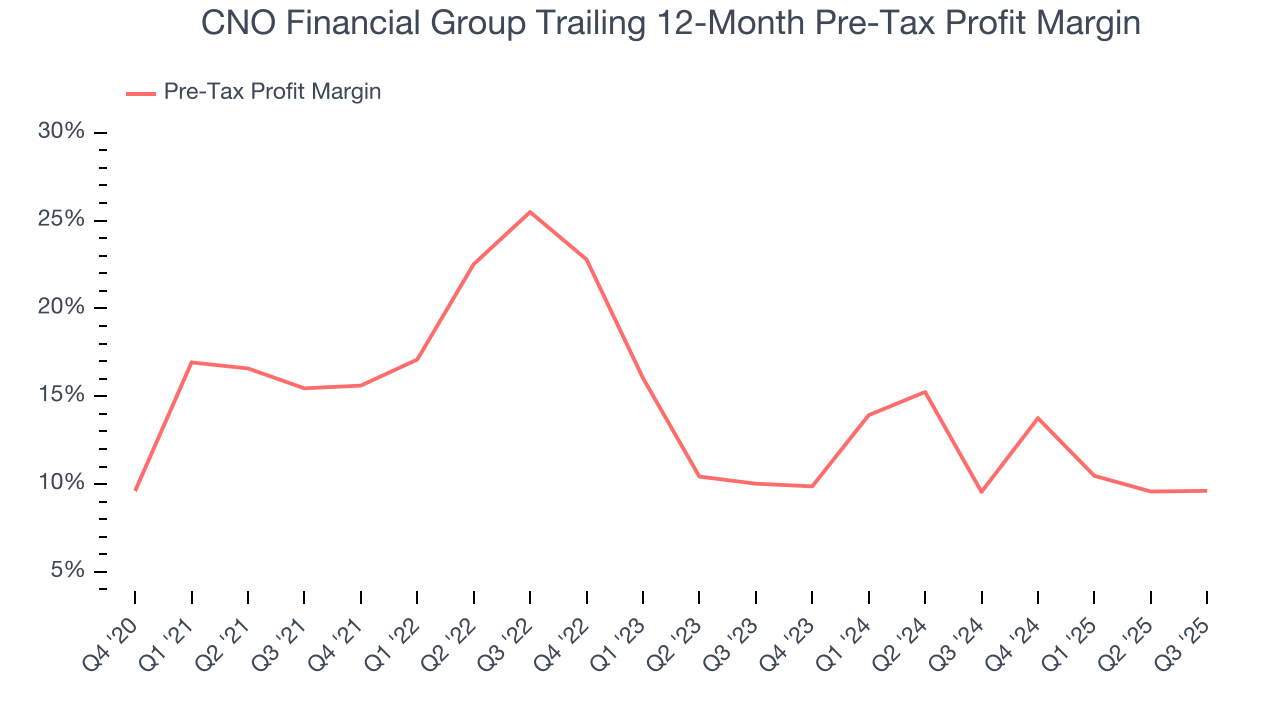
In Q3, CNO Financial Group’s pre-tax profit margin was 3%. This result was 1.9 percentage points better than the same quarter last year.
8. Earnings Per Share
We track the long-term change in earnings per share (EPS) for the same reason as long-term revenue growth. Compared to revenue, however, EPS highlights whether a company’s growth is profitable.
CNO Financial Group’s EPS grew at a solid 13.4% compounded annual growth rate over the last five years, higher than its 2.8% annualized revenue growth. However, this alone doesn’t tell us much about its business quality because its pre-tax profit margin didn’t improve.
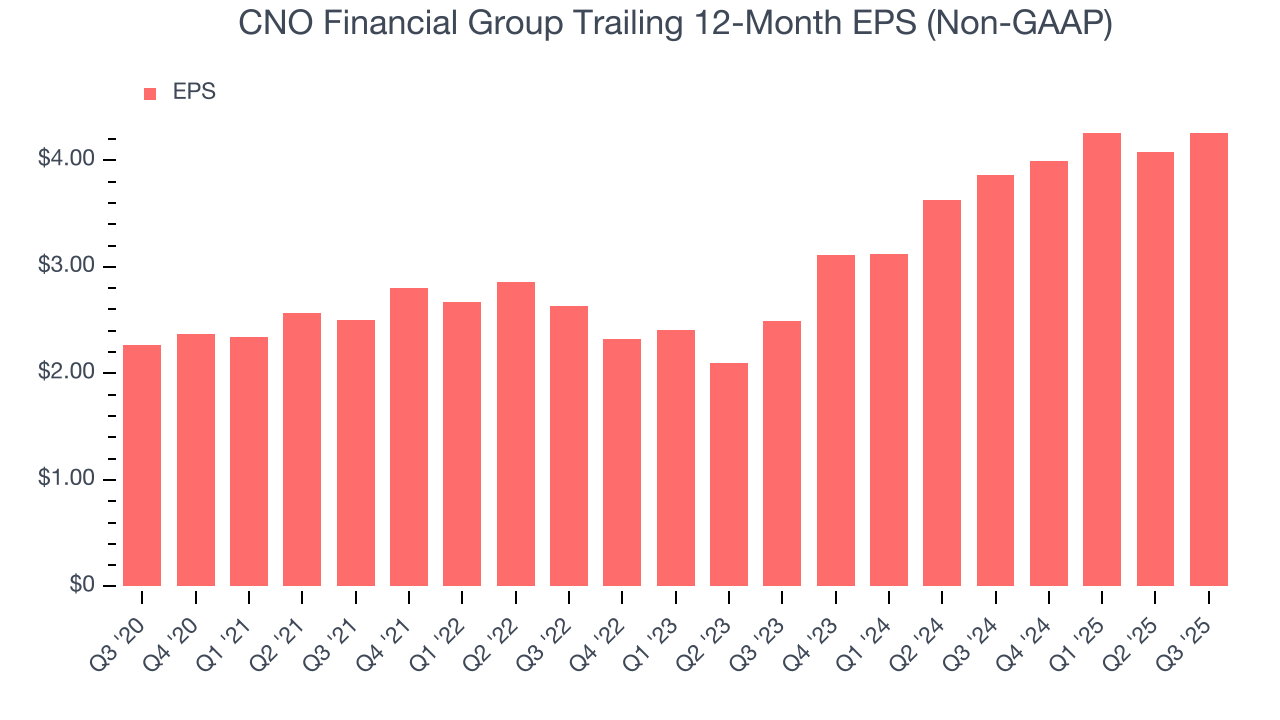
Like with revenue, we analyze EPS over a more recent period because it can provide insight into an emerging theme or development for the business.
For CNO Financial Group, its two-year annual EPS growth of 30.8% was higher than its five-year trend. We love it when earnings growth accelerates, especially when it accelerates off an already high base.
In Q3, CNO Financial Group reported adjusted EPS of $1.29, up from $1.11 in the same quarter last year. This print easily cleared analysts’ estimates, and shareholders should be content with the results. Over the next 12 months, Wall Street expects CNO Financial Group’s full-year EPS of $4.26 to shrink by 1.5%.
9. Book Value Per Share (BVPS)
Insurance companies are balance sheet businesses, collecting premiums upfront and paying out claims over time. The float–premiums collected but not yet paid out–are invested, creating an asset base supported by a liability structure. Book value per share (BVPS) captures this dynamic by measuring these assets (investment portfolio, cash, reinsurance recoverables) less liabilities (claim reserves, debt, future policy benefits). BVPS is essentially the residual value for shareholders.
We therefore consider BVPS very important to track for insurers and a metric that sheds light on business quality. While other (and more commonly known) per-share metrics like EPS can sometimes be lumpy due to reserve releases or one-time items and can be managed or skewed while still following accounting rules, BVPS reflects long-term capital growth and is harder to manipulate.
CNO Financial Group’s BVPS declined at a 5.7% annual clip over the last five years. However, BVPS growth has accelerated recently, growing by 27.1% annually over the last two years from $16.85 to $27.24 per share.
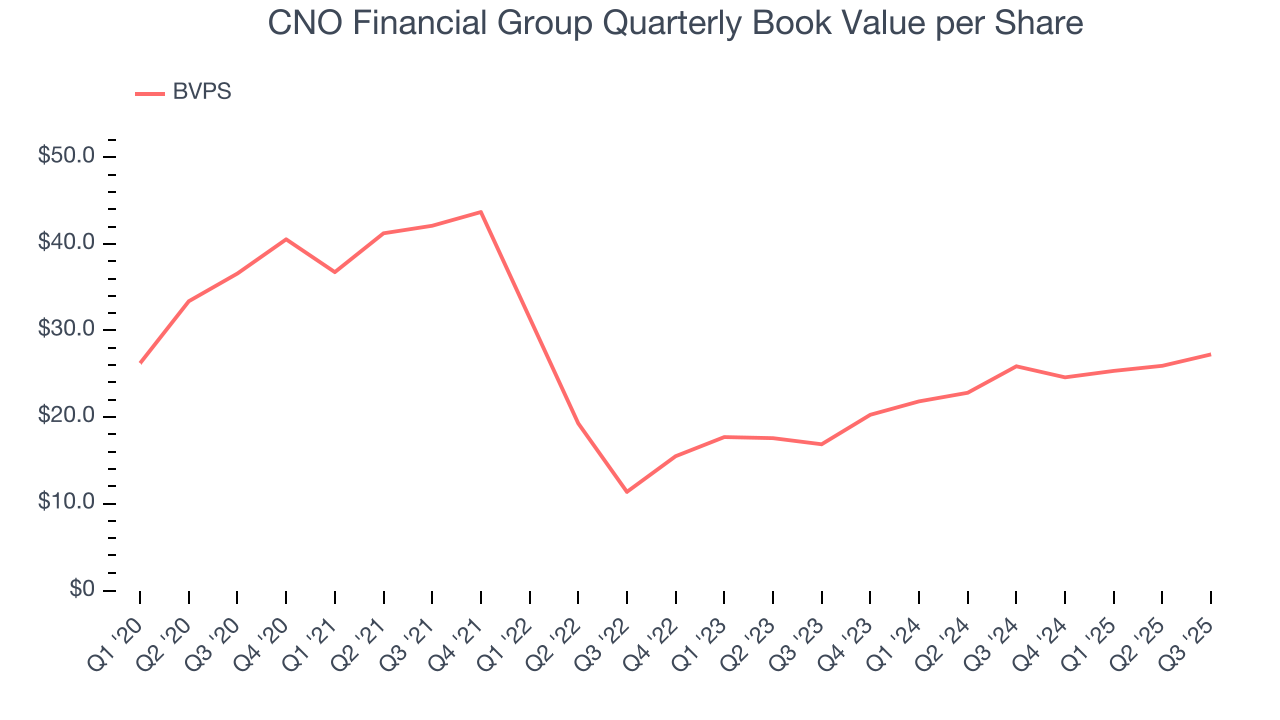
Over the next 12 months, Consensus estimates call for CNO Financial Group’s BVPS to grow by 56.8% to $39.45, elite growth rate.
10. Balance Sheet Assessment
The debt-to-equity ratio is a widely used measure to assess a company's balance sheet health. A higher ratio means that a business aggressively financed its growth with debt. This can result in higher earnings (if the borrowed funds are invested profitably) but also increases risk.
If debt levels are too high, there could be difficulties in meeting obligations, especially during economic downturns or periods of rising interest rates if the debt has variable-rate payments.
CNO Financial Group has no debt, so leverage is not an issue here.
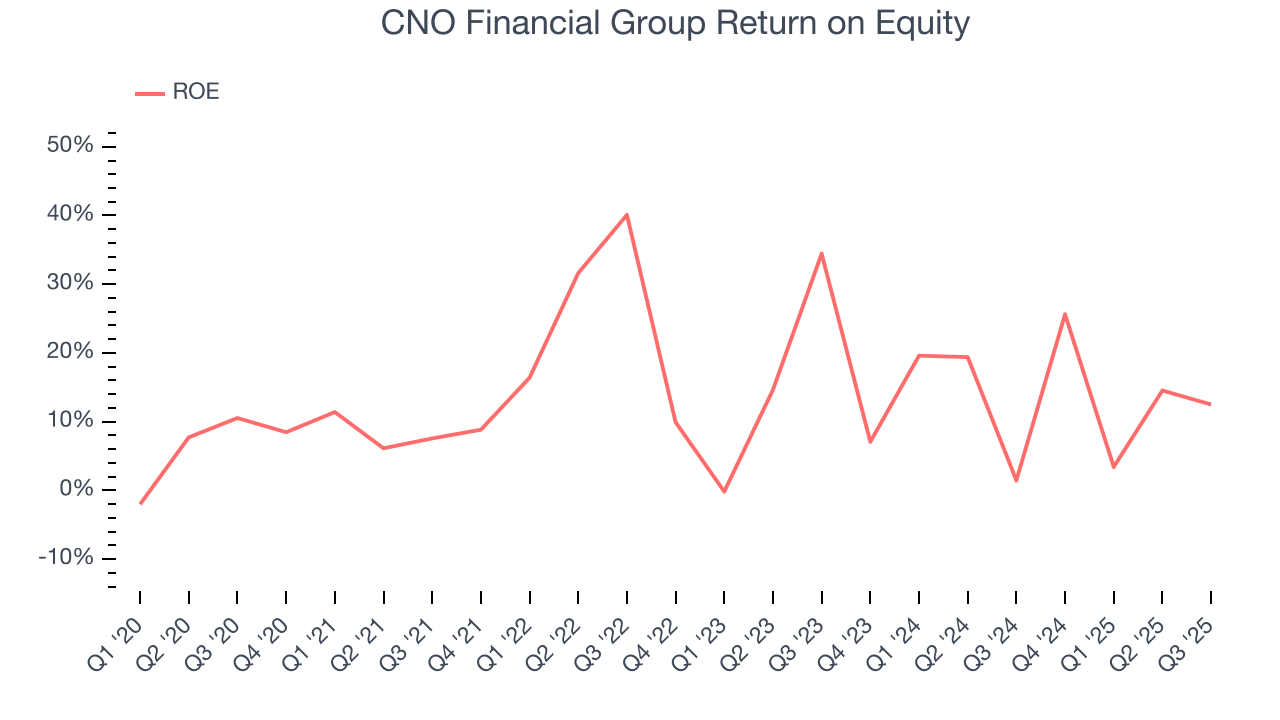
11. Return on Equity
Return on Equity, or ROE, ties everything together and is a vital metric. It tells us how much profit the insurer generates for each dollar of shareholder equity entrusted to management. Over a long period, insurers with higher ROEs tend to compound shareholder wealth faster through retained earnings, buybacks, and dividends.
Over the last five years, CNO Financial Group has averaged an ROE of 14.6%, healthy for a company operating in a sector where the average shakes out around 12.5% and those putting up 20%+ are greatly admired. This is a bright spot for CNO Financial Group.
12. Key Takeaways from CNO Financial Group’s Q3 Results
It was good to see CNO Financial Group beat analysts’ EPS expectations this quarter. We were also excited its revenue outperformed Wall Street’s estimates by a wide margin. On the other hand, its book value per share missed. Overall, we think this was a solid quarter with some key areas of upside. The stock remained flat at $39.59 immediately after reporting.
13. Is Now The Time To Buy CNO Financial Group?
Updated: January 24, 2026 at 11:26 PM EST
Before investing in or passing on CNO Financial Group, we urge you to understand the company’s business quality (or lack thereof), valuation, and the latest quarterly results - in that order.
CNO Financial Group isn’t a terrible business, but it doesn’t pass our bar. To begin with, its revenue growth was weak over the last five years. And while its estimated BVPS growth for the next 12 months is great, the downside is its BVPS has declined over the last five years. On top of that, its projected EPS for the next year is lacking.
CNO Financial Group’s P/B ratio based on the next 12 months is 1.5x. While this valuation is fair, the upside isn’t great compared to the potential downside. We're fairly confident there are better stocks to buy right now.
Wall Street analysts have a consensus one-year price target of $47.25 on the company (compared to the current share price of $40.65).
Although the price target is bullish, readers should exercise caution because analysts tend to be overly optimistic. The firms they work for, often big banks, have relationships with companies that extend into fundraising, M&A advisory, and other rewarding business lines. As a result, they typically hesitate to say bad things for fear they will lose out. We at StockStory do not suffer from such conflicts of interest, so we’ll always tell it like it is.