
Capital One (COF)
Capital One piques our interest. Its eye-popping 27.6% annualized EPS growth over the last five years has significantly outpaced its peers.― StockStory Analyst Team
1. News


2. Summary
Why Capital One Is Interesting
Starting as a credit card company in 1988 before expanding into a full-service bank, Capital One (NYSE:COF) is a financial services company that offers credit cards, auto loans, banking services, and commercial lending to consumers and businesses.
- Performance over the past five years shows its incremental sales were extremely profitable, as its annual earnings per share growth of 27.6% outpaced its revenue gains
- Solid 13.5% annual revenue growth over the last five years indicates its offering’s solve complex business issues
- On the flip side, its products and services are facing profitability challenges during this cycle, as seen in its flat tangible book value per share over the last two years


Capital One has some respectable qualities. If you’ve been itching to buy the stock, the price looks fair.


3. Capital One (COF) Research Report: Q4 CY2025 Update
Financial services company Capital One (NYSE:COF) announced better-than-expected revenue in Q4 CY2025, with sales up 52.9% year on year to $15.58 billion. Its non-GAAP profit of $3.86 per share was 6.8% below analysts’ consensus estimates.
Capital One (COF) Q4 CY2025 Highlights:
- Net Interest Margin: 8.3% vs analyst estimates of 8.3% (in line)
- Revenue: $15.58 billion vs analyst estimates of $15.49 billion (52.9% year-on-year growth, 0.6% beat)
- Efficiency Ratio: 60% vs analyst estimates of 52.5% (747.7 basis point miss)
- Adjusted EPS: $3.86 vs analyst expectations of $4.14 (6.8% miss)
- Tangible Book Value per Share: $107.72 vs analyst estimates of $106.76 (1% year-on-year growth, 0.9% beat)
- Market Capitalization: $146.9 billion
Company Overview
Starting as a credit card company in 1988 before expanding into a full-service bank, Capital One (NYSE:COF) is a financial services company that offers credit cards, auto loans, banking services, and commercial lending to consumers and businesses.
Capital One operates through three main business segments: Credit Card, Consumer Banking, and Commercial Banking. As the third-largest issuer of Visa and MasterCard credit cards in the U.S., the company's credit card business serves both prime and subprime borrowers with variable-rate products. Its underwriting process relies heavily on automated systems and predictive models to evaluate applicants based on credit scores, payment history, and income.
In Consumer Banking, Capital One provides deposit accounts, personal loans, and auto financing. A customer might use Capital One's digital banking platform to open a high-yield savings account, then later finance a new vehicle through the company's auto loan division, which serves both prime and subprime borrowers with fixed-rate loans typically under 75 months.
The Commercial Banking segment caters to mid-market companies with annual revenues between $20 million and $2 billion, offering loans, deposit services, treasury management, and capital markets solutions. For example, a growing regional healthcare provider might use Capital One's commercial real estate financing to expand its facilities while also utilizing the bank's cash management services.
Capital One generates revenue primarily through interest income on loans and credit cards, as well as through fees and interchange revenue from card transactions. The company maintains a significant digital presence while also operating physical branch locations and cafés across the United States. Beyond its U.S. operations, Capital One conducts business in the United Kingdom and Canada, primarily through credit card offerings.
4. Credit Card
Credit card companies facilitate electronic payments and extend revolving credit to consumers. Growth comes from increasing digital payment adoption, cross-border transaction growth, and value-added services for cardholders and merchants. Challenges include regulatory scrutiny of fees and practices, competition from alternative payment methods, and potential credit losses during economic downturns.
Capital One's primary competitors include major credit card issuers and banks such as JPMorgan Chase (NYSE:JPM), Bank of America (NYSE:BAC), Citigroup (NYSE:C), American Express (NYSE:AXP), and Discover Financial Services (NYSE:DFS). In auto lending, it competes with Ally Financial (NYSE:ALLY) and traditional banks.
5. Revenue Growth
A company’s long-term sales performance is one signal of its overall quality. Even a bad business can shine for one or two quarters, but a top-tier one grows for years. Over the last five years, Capital One grew its revenue at a solid 13.5% compounded annual growth rate. Its growth beat the average financials company and shows its offerings resonate with customers, a helpful starting point for our analysis.
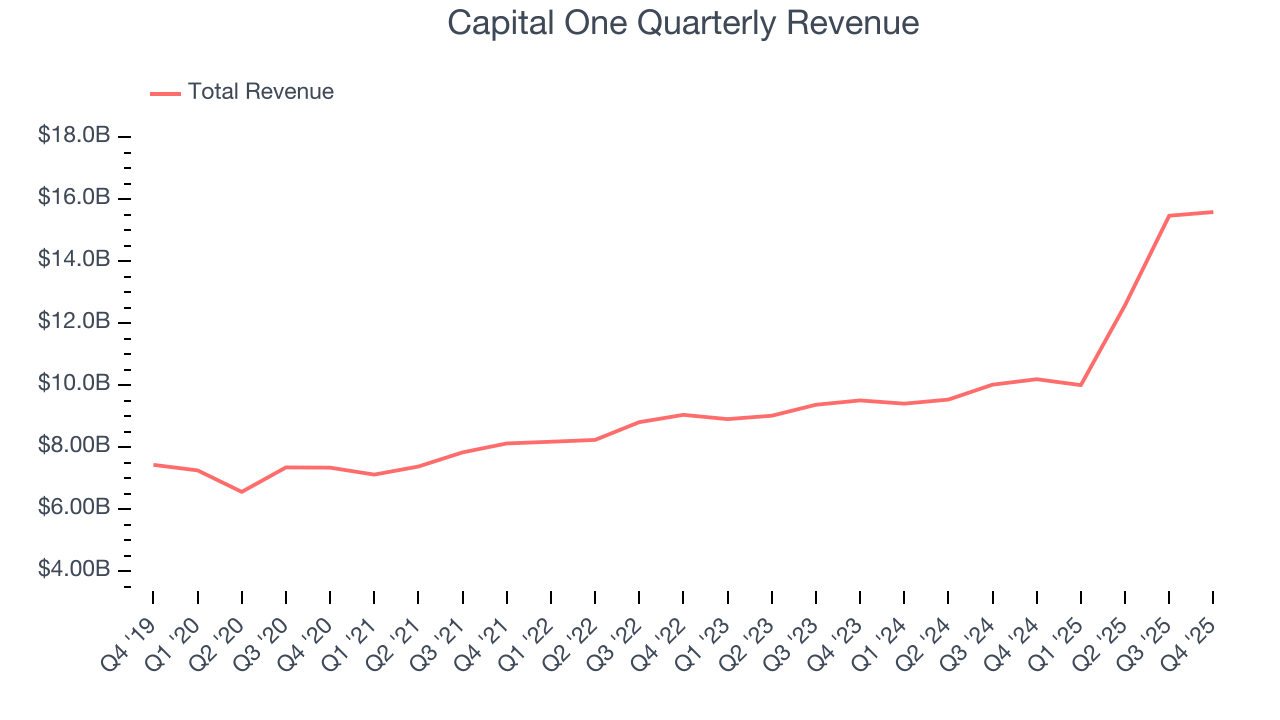
Long-term growth is the most important, but within financials, a half-decade historical view may miss recent interest rate changes and market returns. Capital One’s annualized revenue growth of 20.7% over the last two years is above its five-year trend, suggesting its demand was strong and recently accelerated. 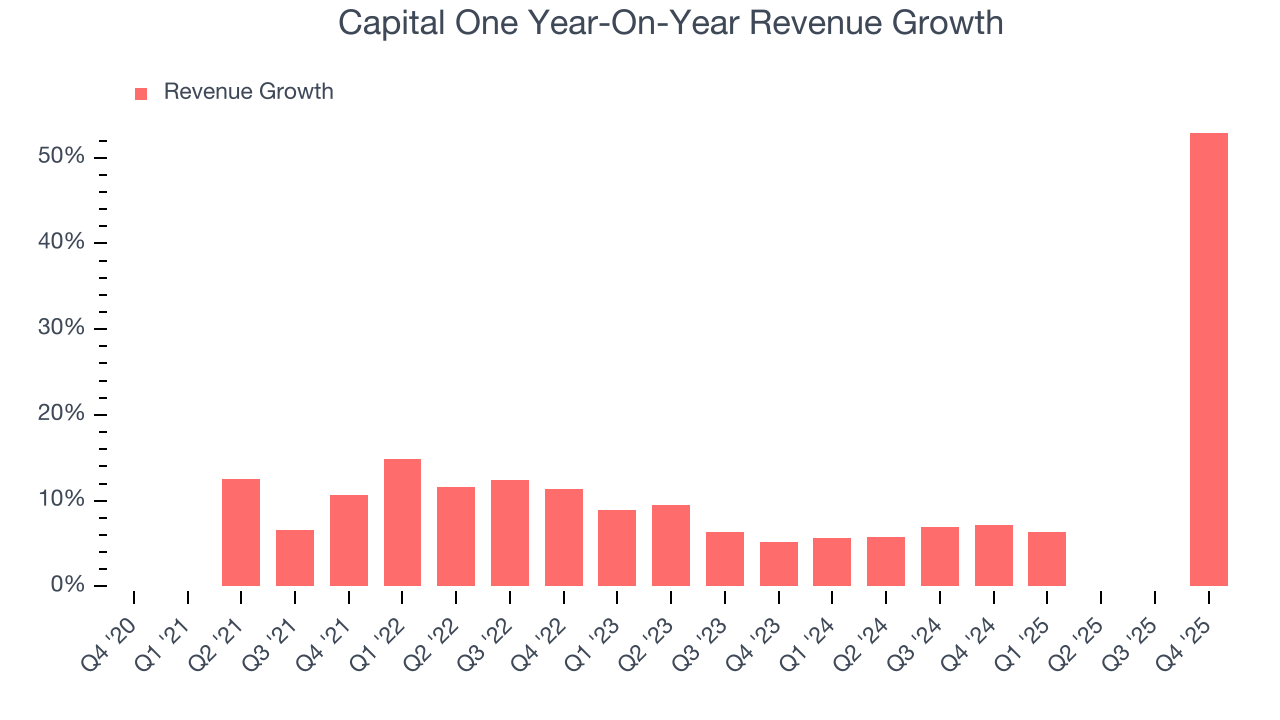 Note: Quarters not shown were determined to be outliers, impacted by outsized investment gains/losses that are not indicative of the recurring fundamentals of the business.
This quarter, Capital One reported magnificent year-on-year revenue growth of 52.9%, and its $15.58 billion of revenue beat Wall Street’s estimates by 0.6%.
6. Net Interest Margin
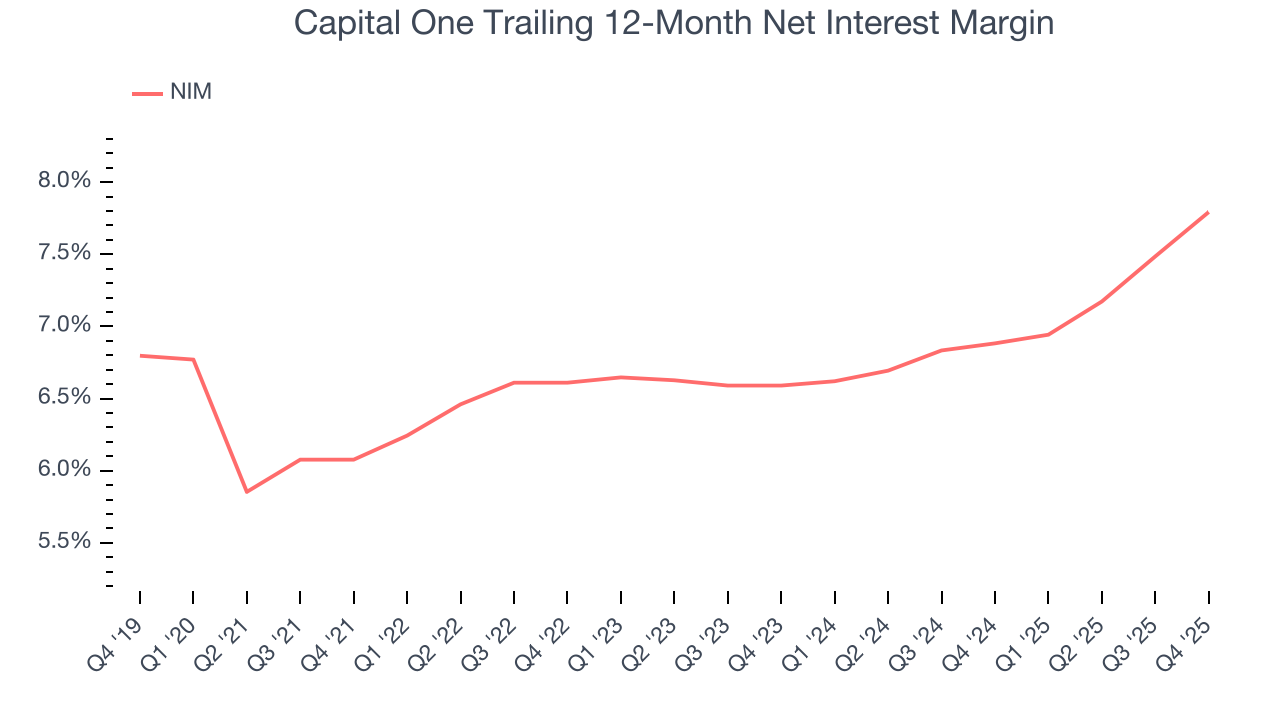
The net interest margin (NIM) is a key profitability indicator that measures the difference between what a financial institution earns on its loans and what it pays on its deposits. This metric measures how efficiently one can generate income from its core lending activities.
Capital One’s net interest margin has increased by 171.6 and 120.2 basis points (100 basis points = 1 percentage point) over the last four and two years, respectively. These rates of change were better than the broader financials industry. The firm’s NIM for the trailing 12 months was 7.8%.
7. Efficiency Ratio
Topline growth carries importance, but the overall profitability behind this expansion determines true value creation. For Credit Card companies, the efficiency ratio captures this relationship by measuring non-interest expenses, including salaries, facilities, technology, and marketing, against total revenue.
Investors focus on efficiency ratio changes rather than absolute levels, understanding that expense structures vary by revenue mix. Counterintuitively, lower efficiency ratios indicate better performance since they represent lower costs relative to revenue.
Over the last four years, Capital One’s efficiency ratio couldn’t build momentum, hanging around 45.7%. It has also worsened by 2.3 percentage points on a two-year basis, showing its expenses have recently increased at a faster rate than revenue. This usually raises questions unless the company is in high-growth mode and reinvesting its profits into attractive ventures.
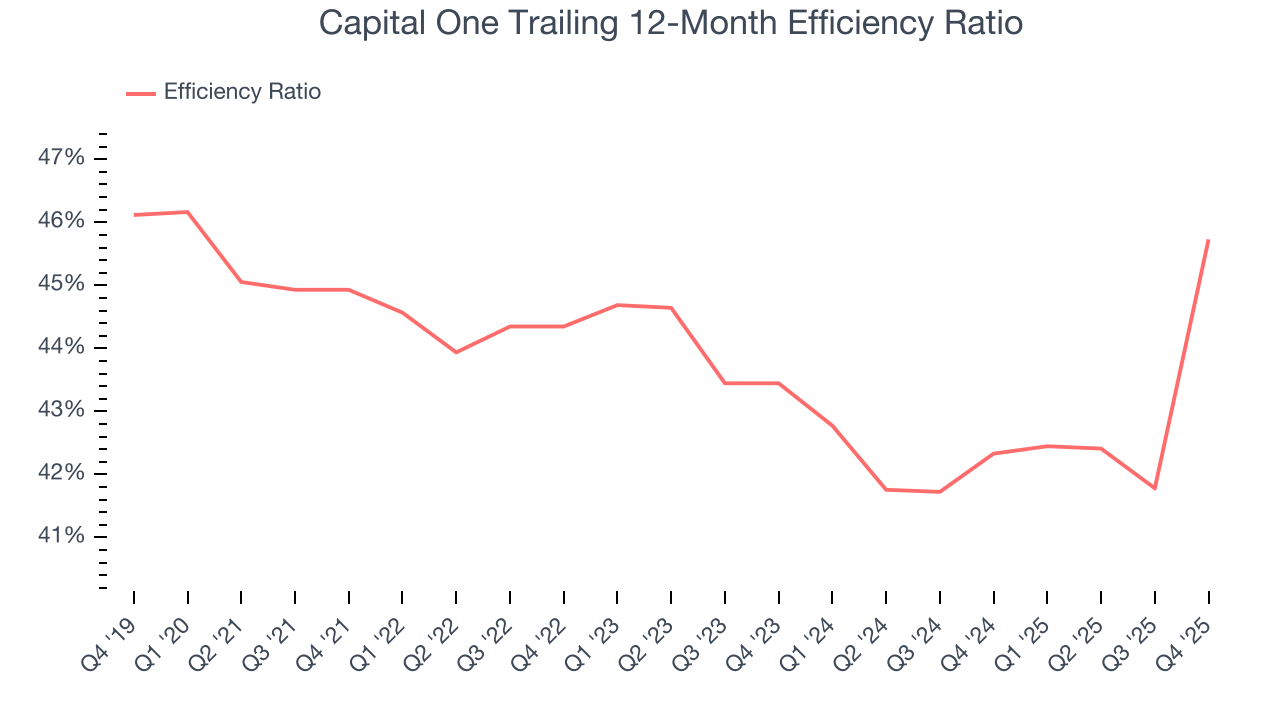
Capital One’s efficiency ratio came in at 60% this quarter, falling short of analysts’ expectations by 747.7 basis points (100 basis points = 1 percentage point). This result was 15.8 percentage points worse than the same quarter last year.
8. Earnings Per Share
We track the long-term change in earnings per share (EPS) for the same reason as long-term revenue growth. Compared to revenue, however, EPS highlights whether a company’s growth is profitable.
Capital One’s EPS grew at an astounding 27.6% compounded annual growth rate over the last five years, higher than its 13.5% annualized revenue growth. However, we take this with a grain of salt because its efficiency ratio didn’t improve and it didn’t repurchase its shares, meaning the delta came from factors we consider non-core or less sustainable over the long term.
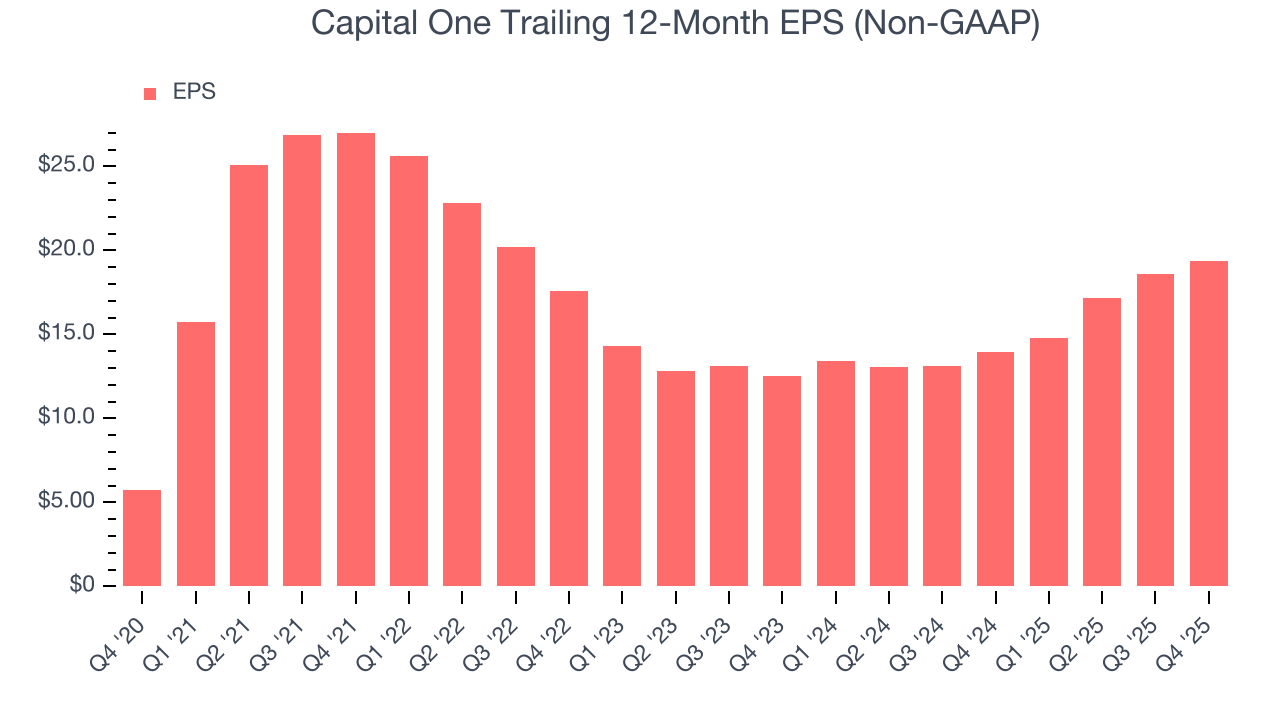
Like with revenue, we analyze EPS over a more recent period because it can provide insight into an emerging theme or development for the business.
For Capital One, its two-year annual EPS growth of 24.3% was lower than its five-year trend. We still think its growth was good and hope it can accelerate in the future.
In Q4, Capital One reported adjusted EPS of $3.86, up from $3.09 in the same quarter last year. Despite growing year on year, this print missed analysts’ estimates, but we care more about long-term adjusted EPS growth than short-term movements. Over the next 12 months, Wall Street expects Capital One’s full-year EPS of $19.35 to grow 8.7%.
9. Tangible Book Value Per Share (TBVPS)
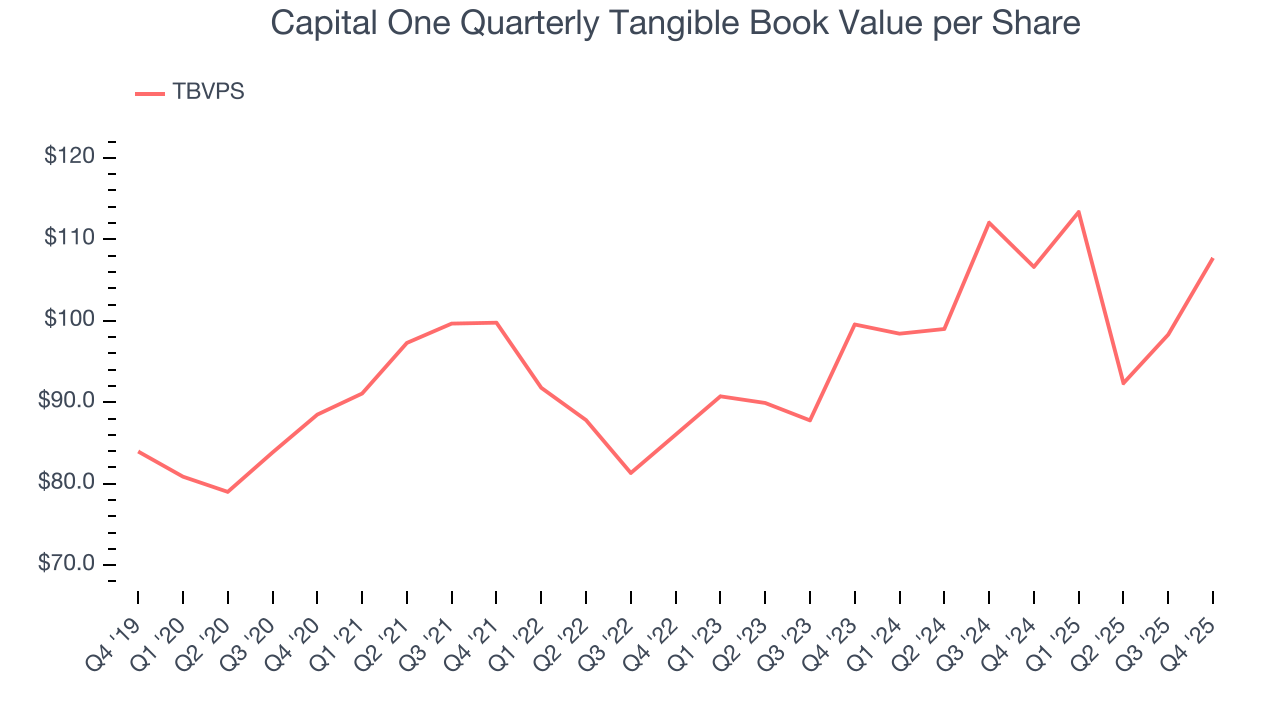
Diversified financial companies operate across multiple business segments, from investment banking and trading to wealth management and specialized lending. Their valuations hinge on balance sheet quality and the ability to compound shareholder equity across these diverse operations.
This explains why tangible book value per share (TBVPS) is a premier metric for the sector. TBVPS provides concrete per-share net worth that investors can trust when evaluating companies with complex, multi-faceted business models. EPS can become murky due to the complexity of multiple revenue streams, acquisition impacts, or accounting flexibility across different financial services, and book value resists financial engineering manipulation.
Capital One’s TBVPS grew at a sluggish 4% annual clip over the last five years. The last two years show a similar trajectory as TBVPS grew by 4% annually from $99.55 to $107.72 per share.
10. Return on Equity
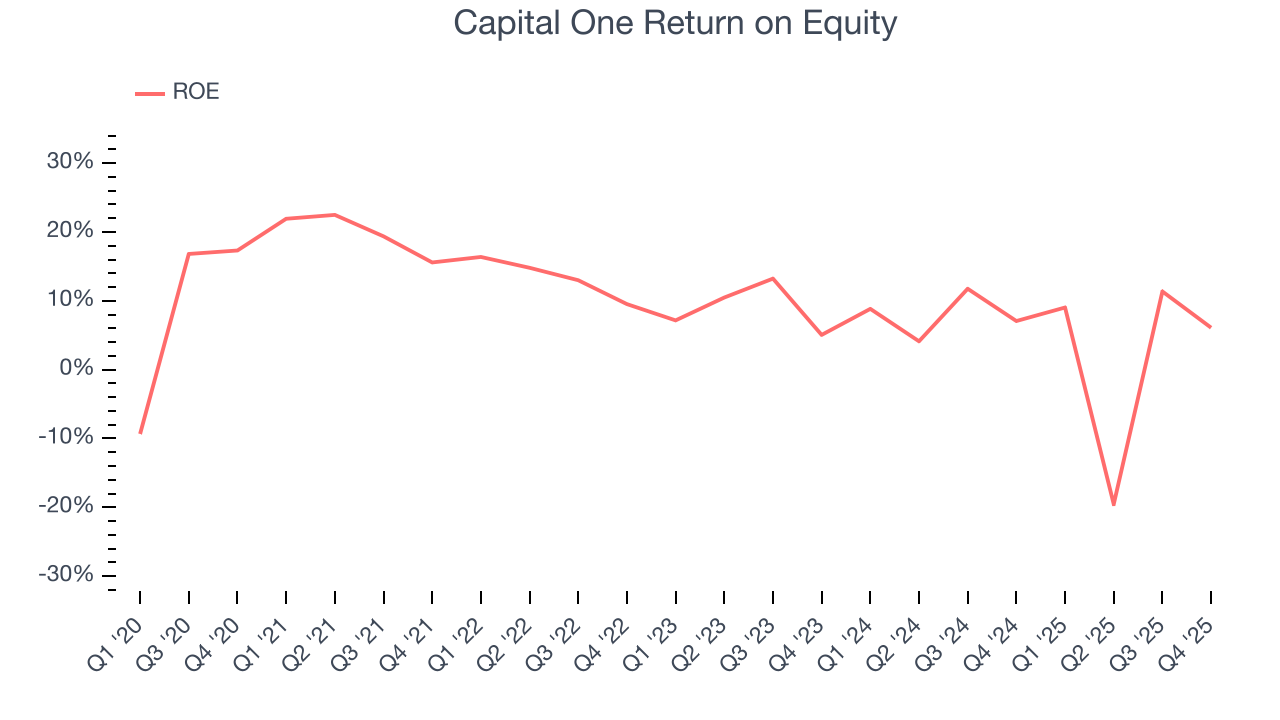
Return on equity (ROE) reveals the profit generated per dollar of shareholder equity, which represents a key source of bank funding. Banks maintaining elevated ROE levels tend to accelerate wealth creation for shareholders via earnings retention, buybacks, and distributions.
Over the last five years, Capital One has averaged an ROE of 10.4%, respectable for a company operating in a sector where the average shakes out around 10% and those putting up 25%+ are greatly admired. This shows Capital One has a narrow competitive moat.
11. Balance Sheet Assessment
Leverage is core to a financial firm’s business model (loans funded by deposits). To ensure economic stability and avoid a repeat of the 2008 GFC, regulators require certain levels of capital and liquidity, focusing on the Tier 1 capital ratio.
Tier 1 capital is the highest-quality capital that a firm holds, consisting primarily of common stock and retained earnings, but also physical gold. It serves as the primary cushion against losses and is the first line of defense in times of financial distress.
This capital is divided by risk-weighted assets to derive the Tier 1 capital ratio. Risk-weighted means that cash and US treasury securities are assigned little risk while unsecured consumer loans and equity investments get much higher risk weights, for example.
New regulation after the 2008 financial crisis requires that all firms must maintain a Tier 1 capital ratio greater than 4.5%. On top of this, there are additional buffers based on scale, risk profile, and other regulatory classifications, so that at the end of the day, firms generally must maintain a 7-10% ratio at minimum.
Over the last two years, Capital One has averaged a Tier 1 capital ratio of 13.6%, which is considered safe and well capitalized in the event that macro or market conditions suddenly deteriorate.
12. Key Takeaways from Capital One’s Q4 Results
We were impressed by how significantly Capital One blew past analysts’ efficiency ratio expectations this quarter. On the other hand, its EPS missed and its net interest margin was in line with Wall Street’s estimates. Overall, this was a softer quarter. The stock traded down 3.8% to $225.39 immediately after reporting.
13. Is Now The Time To Buy Capital One?
Updated: March 15, 2026 at 12:05 AM EDT
Before investing in or passing on Capital One, we urge you to understand the company’s business quality (or lack thereof), valuation, and the latest quarterly results - in that order.
In our opinion, Capital One is a good company. First off, its revenue growth was solid over the last five years and is expected to accelerate over the next 12 months. And while its TBVPS growth was weak over the last five years, its astounding EPS growth over the last five years shows its profits are trickling down to shareholders. On top of that, its expanding net interest margin shows its loan book is becoming more profitable.
Capital One’s P/E ratio based on the next 12 months is 8.6x. Looking at the financials space right now, Capital One trades at a compelling valuation. If you believe in the company and its growth potential, now is an opportune time to buy shares.
Wall Street analysts have a consensus one-year price target of $275.48 on the company (compared to the current share price of $180.03), implying they see 53% upside in buying Capital One in the short term.